
Houses for sale & to rent in Saltcoats, North Ayrshire
House Prices in Saltcoats
Properties in Saltcoats have an average house price of £119k and had 402 Property Transactions within the last 3 years.¹
Saltcoats is an area in North Ayrshire with 5,751 households², where the most expensive property was sold for £395k.
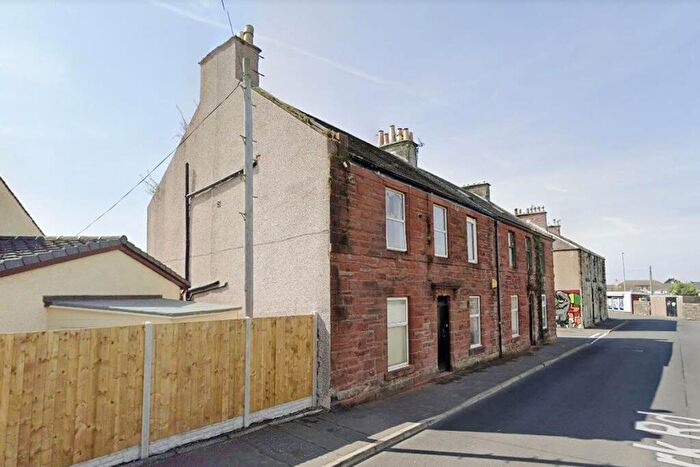
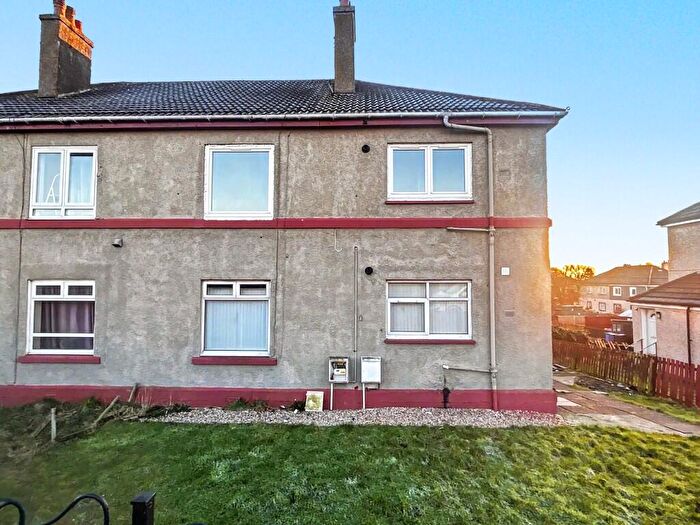
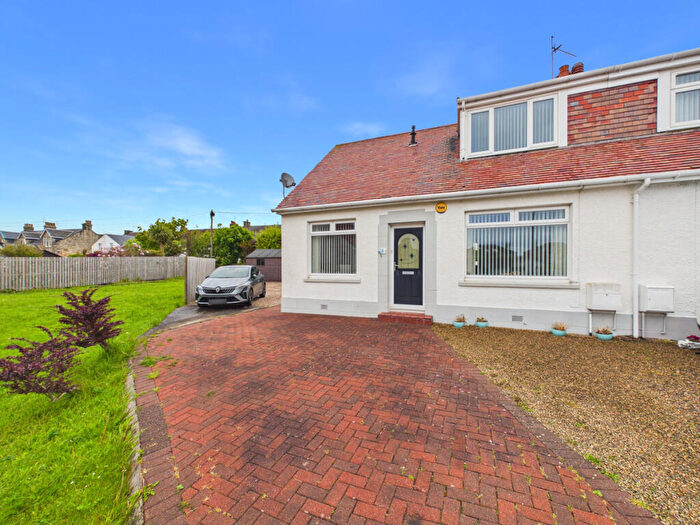
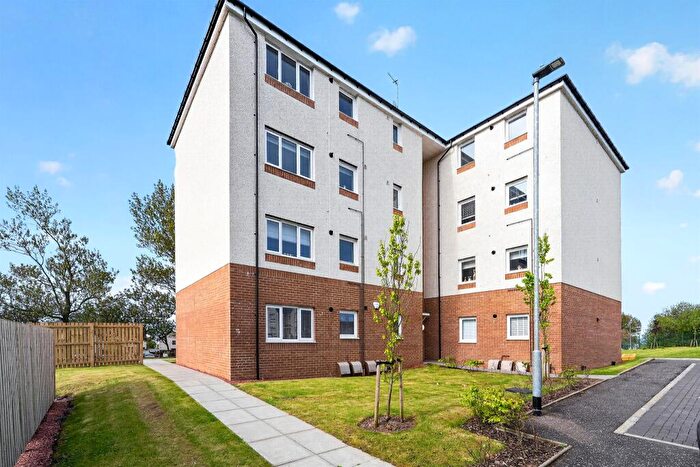
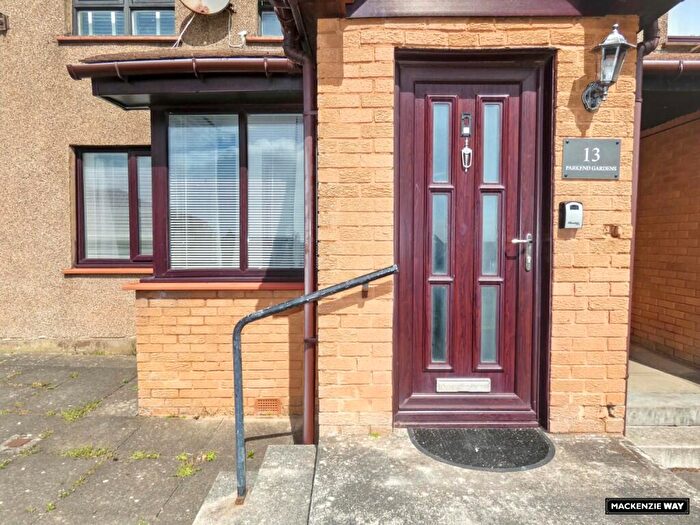
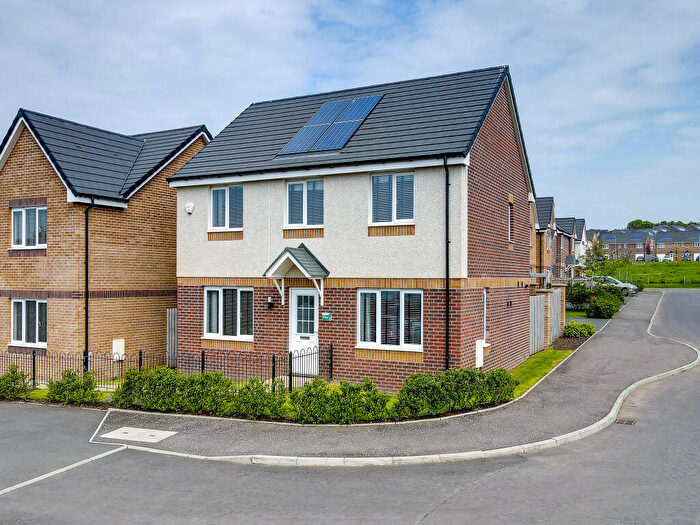
Properties for sale in Saltcoats
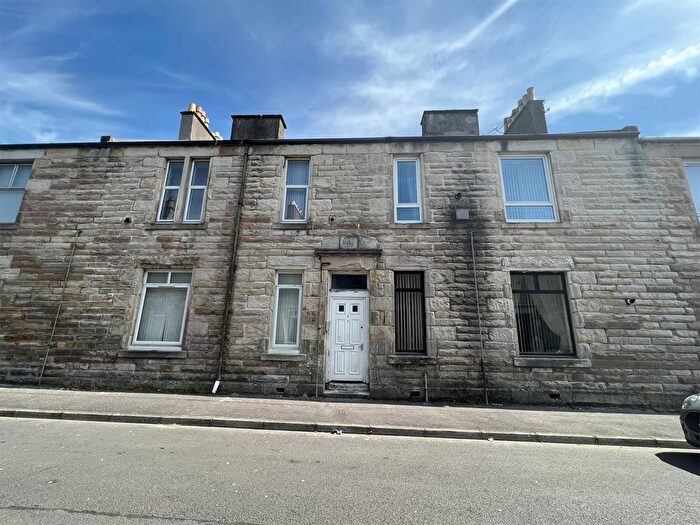

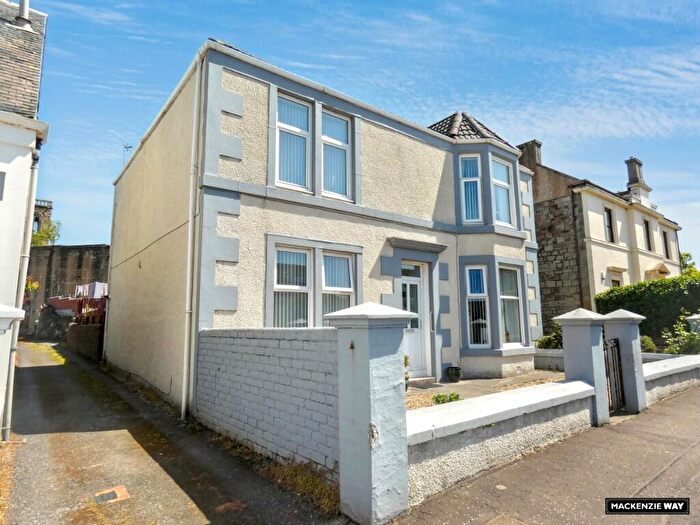
![]()
If you are looking to sell your house, let it out, or receive a property valuation, an expert can help you.
Click the button below to get started.


Neighbourhoods in Saltcoats
Navigate through our locations to find the location of your next house in Saltcoats, North Ayrshire for sale or to rent.
Transport in Saltcoats
Please see below transportation links in this area:
-
 Saltcoats Station
 -
Ardrossan South Beach Station
-
Ardrossan Town Station
-
Stevenston Station
-
Ardrossan Harbour Station
- FAQ
- Price Paid By Year
Frequently asked questions about Saltcoats
What is the average price for a property for sale in Saltcoats?
The average price for a property for sale in Saltcoats is £118,696. This amount is 17% lower than the average price in North Ayrshire. There are 1,967 property listings for sale in Saltcoats.
What locations have the most expensive properties for sale in Saltcoats?
The location with the most expensive properties for sale in Saltcoats is Saltcoats at an average of £126,270.
What locations have the most affordable properties for sale in Saltcoats?
The location with the most affordable properties for sale in Saltcoats is Stevenston at an average of £93,879.
Which train stations are available in or near Saltcoats?
Some of the train stations available in or near Saltcoats are Saltcoats, Ardrossan South Beach and Ardrossan Town.
Property Price Paid in Saltcoats by Year
The average sold property price by year was:
| Year | Average Sold Price | Price Change |
Sold Properties
|
|---|---|---|---|
| 2025 | £120,564 | 1% |
136 Properties |
| 2024 | £119,400 | 3% |
131 Properties |
| 2023 | £116,130 | -2% |
135 Properties |
| 2022 | £118,689 | 12% |
202 Properties |
| 2021 | £104,644 | -0,1% |
243 Properties |
| 2020 | £104,707 | 5% |
181 Properties |
| 2019 | £99,900 | 5% |
231 Properties |
| 2018 | £95,212 | -2% |
211 Properties |
| 2017 | £97,444 | 12% |
186 Properties |
| 2016 | £86,204 | -7% |
180 Properties |
| 2015 | £92,471 | 6% |
167 Properties |
| 2014 | £86,981 | -7% |
161 Properties |
| 2013 | £92,886 | 2% |
150 Properties |
| 2012 | £91,483 | -19% |
168 Properties |
| 2011 | £108,669 | 5% |
163 Properties |
| 2010 | £103,414 | 16% |
142 Properties |
| 2009 | £87,205 | -46% |
150 Properties |
| 2008 | £127,080 | 22% |
270 Properties |
| 2007 | £99,579 | 12% |
443 Properties |
| 2006 | £87,817 | 8% |
398 Properties |
| 2005 | £80,986 | 4% |
379 Properties |
| 2004 | £77,821 | 25% |
375 Properties |
| 2003 | £58,124 | 11% |
417 Properties |
| 2002 | £51,817 | -10% |
338 Properties |
| 2001 | £57,075 | - |
24 Properties |