
Houses for sale & to rent in Glasgow, North Lanarkshire
House Prices in Glasgow
Properties in Glasgow have an average house price of £167k and had 2,851 Property Transactions within the last 3 years.¹
Glasgow is an area in North Lanarkshire with 43,118 households², where the most expensive property was sold for £925k.
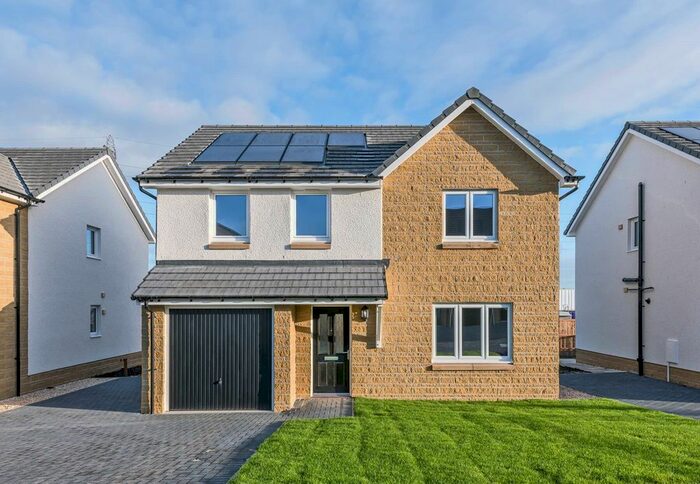
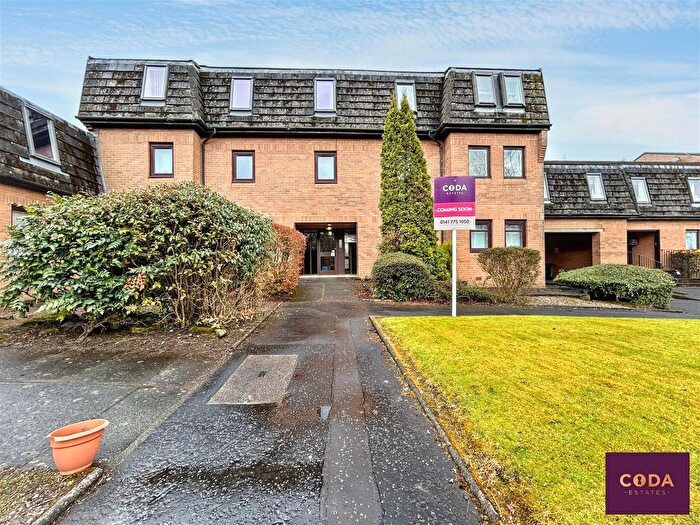
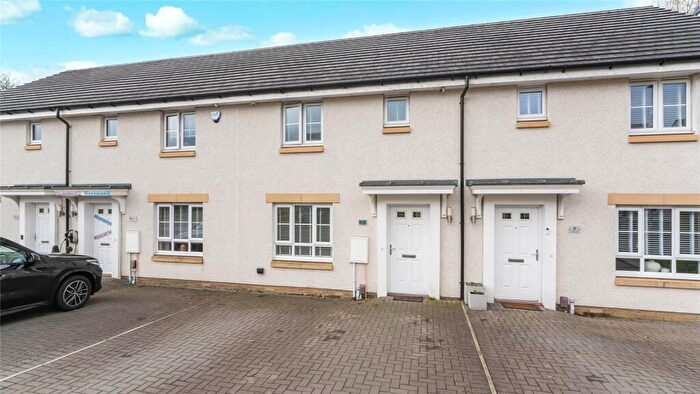
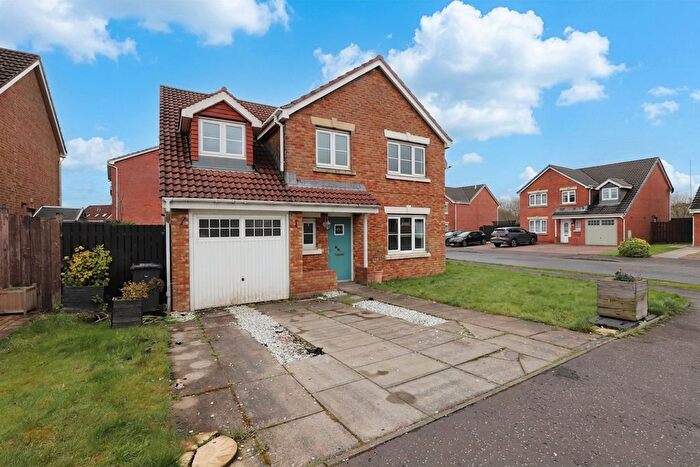
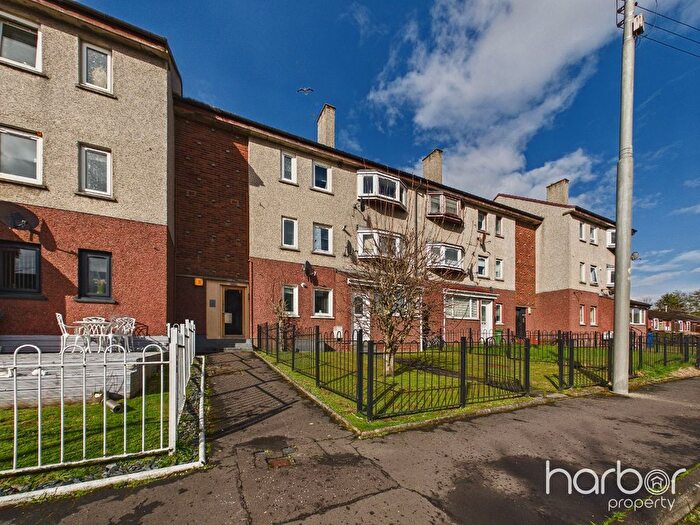
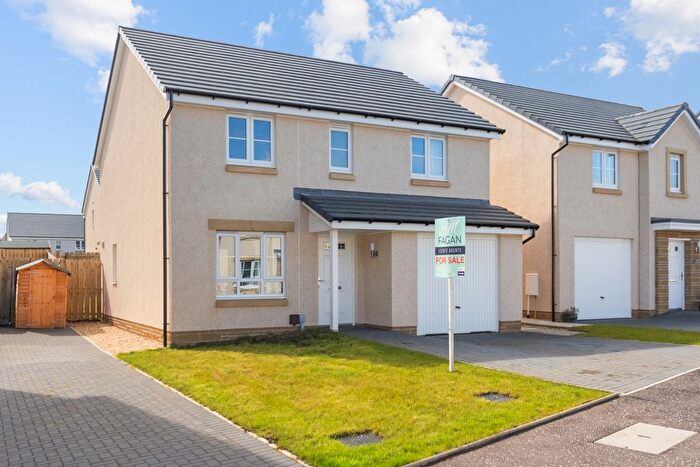
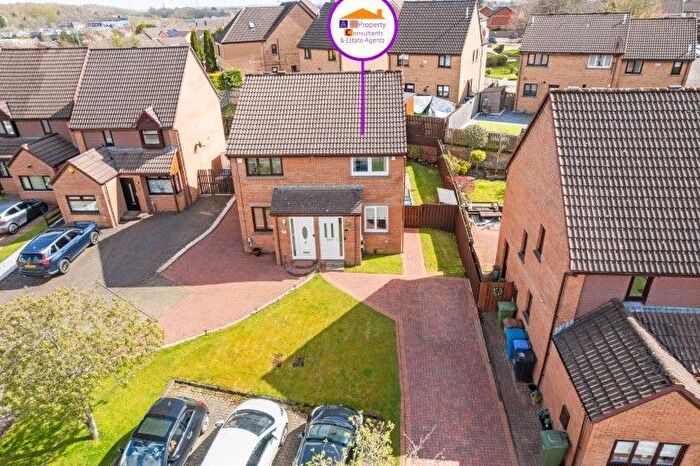
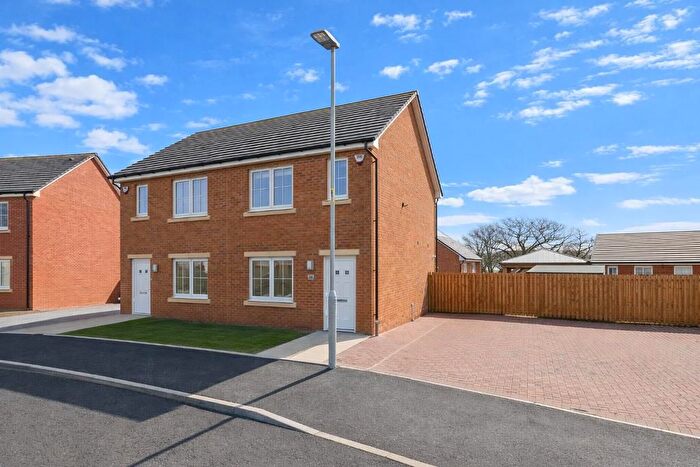
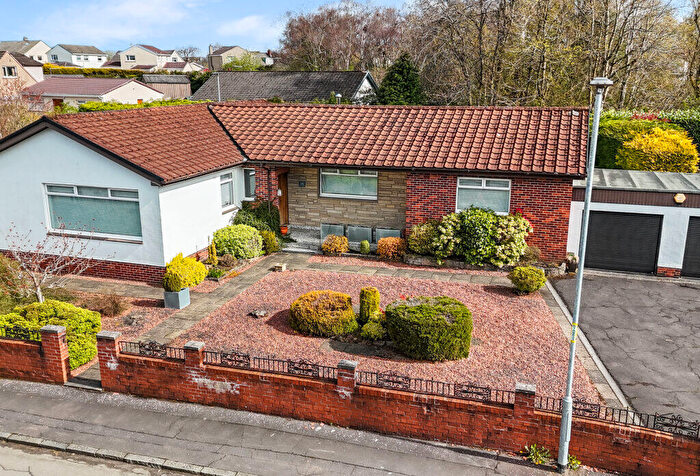
Properties for sale in Glasgow
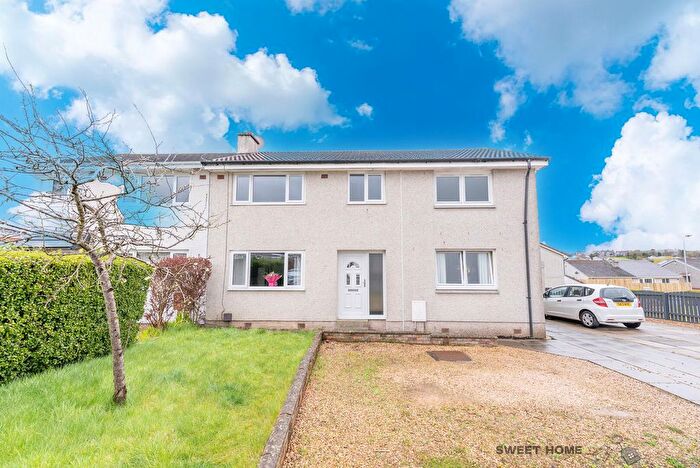
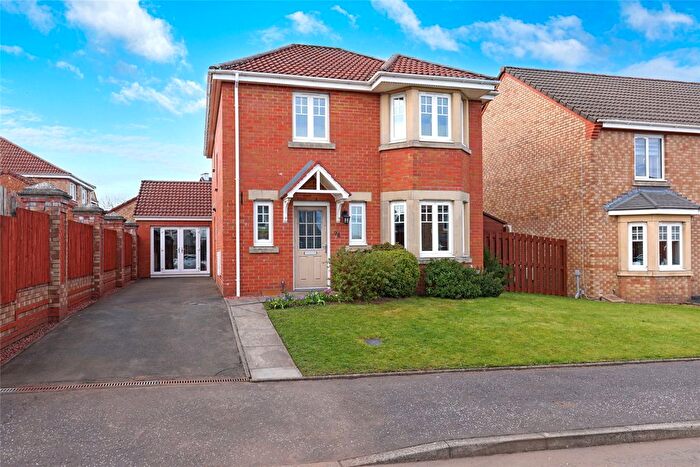
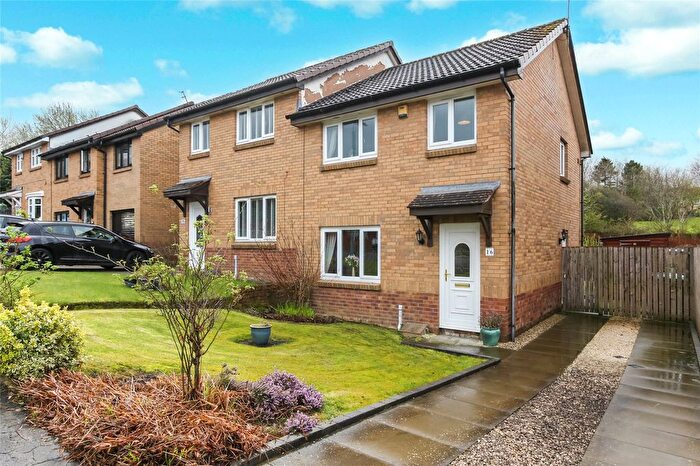

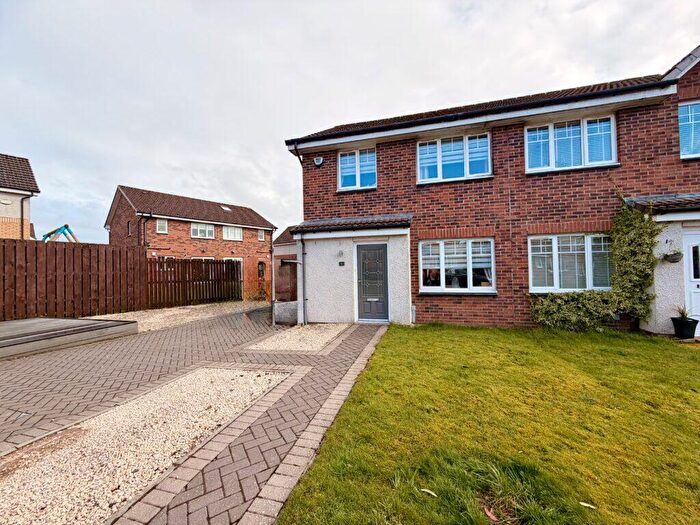
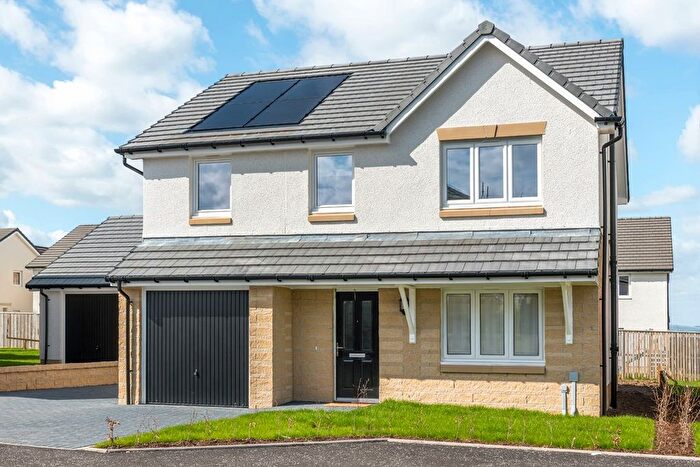
![]()
If you are looking to sell your house, let it out, or receive a property valuation, an expert can help you.
Click the button below to get started.


Neighbourhoods in Glasgow
Navigate through our locations to find the location of your next house in Glasgow, North Lanarkshire for sale or to rent.
Transport in Glasgow
Please see below transportation links in this area:

- FAQ
- Price Paid By Year
Frequently asked questions about Glasgow
What is the average price for a property for sale in Glasgow?
The average price for a property for sale in Glasgow is £166,940. This amount is 11% higher than the average price in North Lanarkshire. There are more than 10,000 property listings for sale in Glasgow.
What locations have the most expensive properties for sale in Glasgow?
The locations with the most expensive properties for sale in Glasgow are Stepps, Chryston and Muirhead at an average of £239,774, Cumbernauld North at an average of £239,517 and Gartcosh, Glenboig and Moodiesburn at an average of £185,245.
What locations have the most affordable properties for sale in Glasgow?
The locations with the most affordable properties for sale in Glasgow are Cumbernauld East at an average of £102,218, Cumbernauld South at an average of £113,501 and Kilsyth at an average of £135,695.
Which train stations are available in or near Glasgow?
Some of the train stations available in or near Glasgow are Gartcosh, Greenfaulds and Croy.
Property Price Paid in Glasgow by Year
The average sold property price by year was:
| Year | Average Sold Price | Price Change |
Sold Properties
|
|---|---|---|---|
| 2025 | £172,126 | 3% |
905 Properties |
| 2024 | £167,013 | 3% |
960 Properties |
| 2023 | £162,109 | -6% |
986 Properties |
| 2022 | £172,597 | 10% |
1,724 Properties |
| 2021 | £154,833 | -3% |
1,790 Properties |
| 2020 | £159,745 | -4% |
1,710 Properties |
| 2019 | £165,908 | 2% |
2,181 Properties |
| 2018 | £161,821 | 9% |
2,140 Properties |
| 2017 | £147,676 | 4% |
1,993 Properties |
| 2016 | £141,901 | 0,3% |
1,989 Properties |
| 2015 | £141,497 | 7% |
1,811 Properties |
| 2014 | £132,275 | 7% |
1,637 Properties |
| 2013 | £122,767 | -3% |
1,403 Properties |
| 2012 | £125,896 | 1% |
1,261 Properties |
| 2011 | £124,355 | -36% |
1,056 Properties |
| 2010 | £169,290 | 30% |
1,108 Properties |
| 2009 | £117,973 | -6% |
1,095 Properties |
| 2008 | £125,566 | -3% |
1,874 Properties |
| 2007 | £129,216 | 11% |
2,810 Properties |
| 2006 | £115,358 | 11% |
2,974 Properties |
| 2005 | £102,197 | 8% |
2,831 Properties |
| 2004 | £93,874 | 15% |
2,715 Properties |
| 2003 | £79,884 | 12% |
2,828 Properties |
| 2002 | £70,487 | 25% |
2,900 Properties |
| 2001 | £53,043 | - |
183 Properties |