
Houses for sale in Glasgow, East Dunbartonshire
House Prices in Glasgow
Properties in Glasgow have an average house price of £292k and had 2,467 Property Transactions within the last 3 years.¹
Glasgow is an area in East Dunbartonshire with 43,385 households², where the most expensive property was sold for £2M.
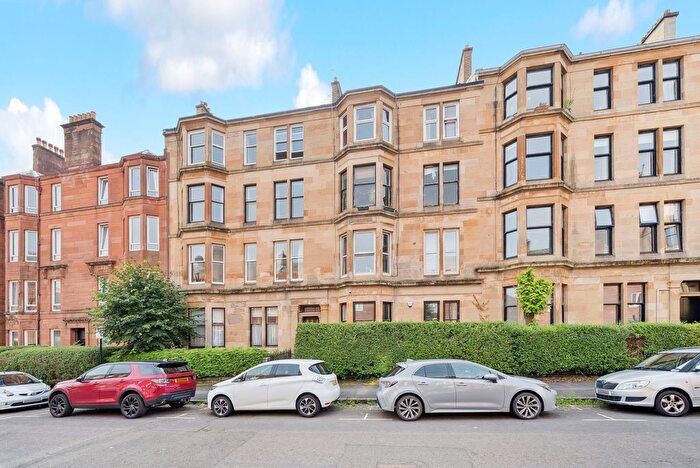
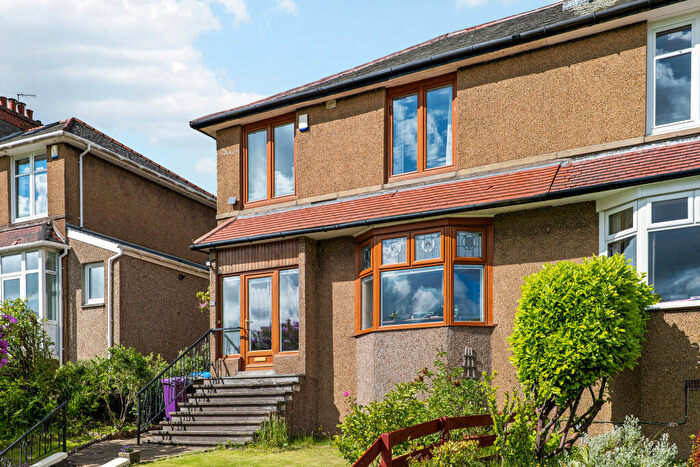
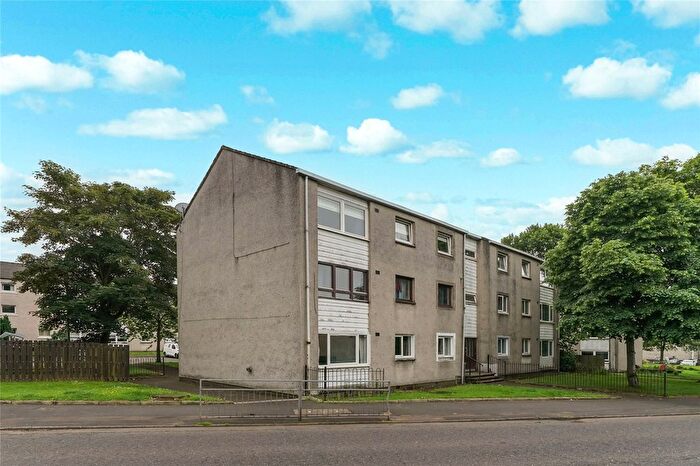
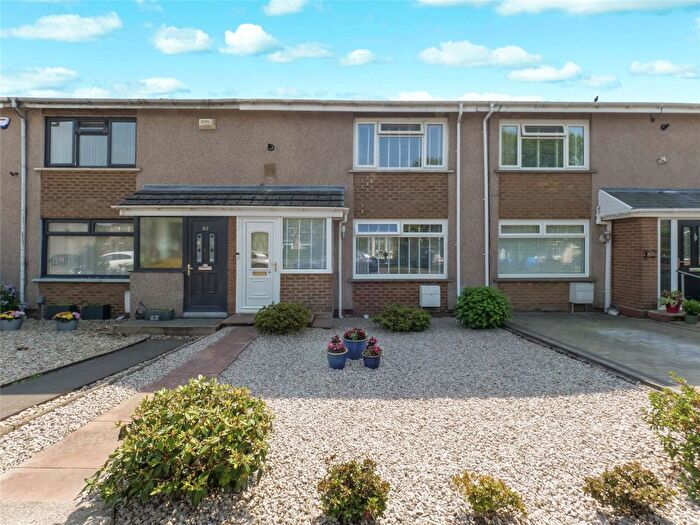
Properties for sale in Glasgow
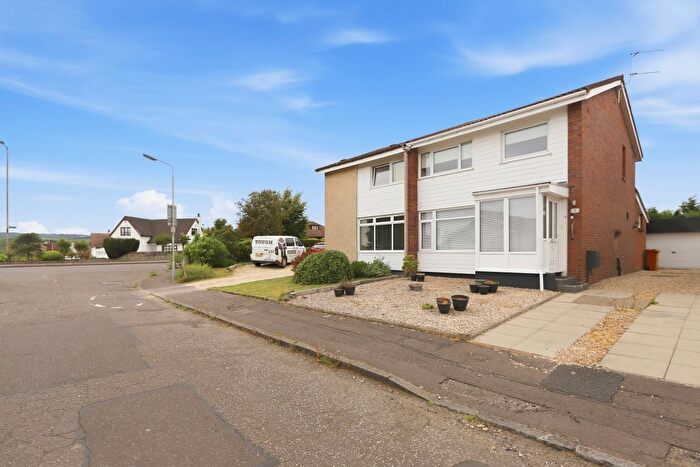
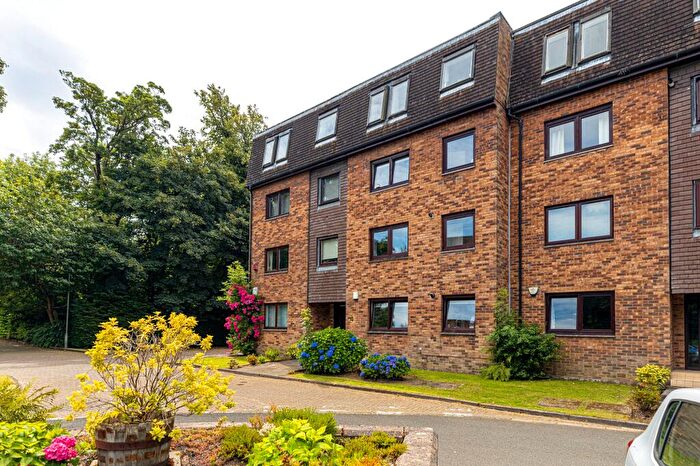
![]()
If you are looking to sell your house, let it out, or receive a property valuation, an expert can help you.
Click the button below to get started.
Neighbourhoods in Glasgow
Navigate through our locations to find the location of your next house in Glasgow, East Dunbartonshire for sale or to rent.
Property price trends in Glasgow
According to the latest Registers of Scotland data, the average home in Glasgow sold for £295,819 in 2025. That figure comes from a substantial record of 42,160 sales logged over the past 24 years.
Prices have moved up over the last three years. Compared with 2022, when the typical sale came in around £288,000, that's a rise of roughly 2.7%.
Looking back five years, average prices are up about 15.2% since 2020, a gain of around £39,084 in cash terms.
Zoom out to the past decade for the fuller picture. Back in 2015, homes here averaged £222,577, so the typical sold price has climbed about 32.9% since then, roughly 2.9% a year. Stretch the view to fifteen years and that annual pace eases back to about 2.7%.
Frequently asked questions about Glasgow
What is the average price for a property for sale in Glasgow?
The average price for a property for sale in Glasgow is £291,964. This amount is 0.21% lower than the average price in East Dunbartonshire. There are more than 10,000 property listings for sale in Glasgow.
What locations have the most expensive properties for sale in Glasgow?
The locations with the most expensive properties for sale in Glasgow are Bearsden South at an average of £424,408, Bearsden North at an average of £410,373 and Milngavie at an average of £340,696.
What locations have the most affordable properties for sale in Glasgow?
The locations with the most affordable properties for sale in Glasgow are Kirkintilloch East and North and Twechar at an average of £159,767, Bishopbriggs South at an average of £226,840 and Bishopbriggs North and Campsie at an average of £247,279.
Which train stations are available in or near Glasgow?
Some of the train stations available in or near Glasgow are Bishopbriggs, Ashfield and Possilpark and Parkhouse.
Property Price Paid in Glasgow by Year
The average sold property price by year was:
| Year | Average Sold Price | Price Change |
Sold Properties
|
|---|---|---|---|
| 2025 | £295,819 | 2% |
818 Properties |
| 2024 | £289,526 | -0,3% |
778 Properties |
| 2023 | £290,521 | 1% |
871 Properties |
| 2022 | £288,000 | 6% |
1,620 Properties |
| 2021 | £271,348 | 5% |
1,866 Properties |
| 2020 | £256,735 | 0,4% |
1,661 Properties |
| 2019 | £255,692 | 3% |
2,078 Properties |
| 2018 | £247,191 | 5% |
1,860 Properties |
| 2017 | £236,043 | 6% |
2,069 Properties |
| 2016 | £221,876 | -0,3% |
1,965 Properties |
Transport in Glasgow
Please see below transportation links in this area:
