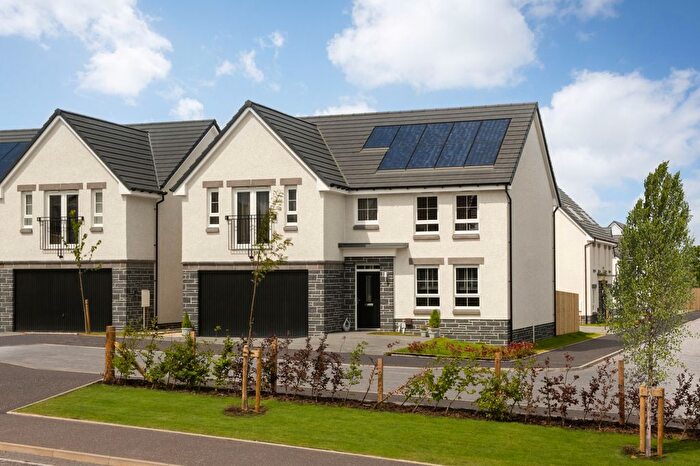
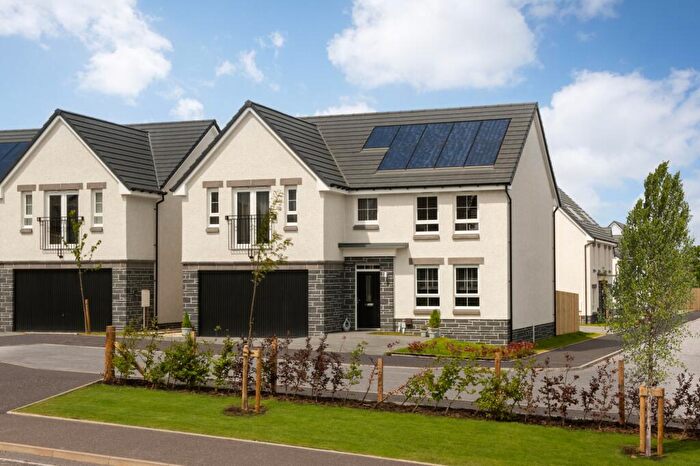
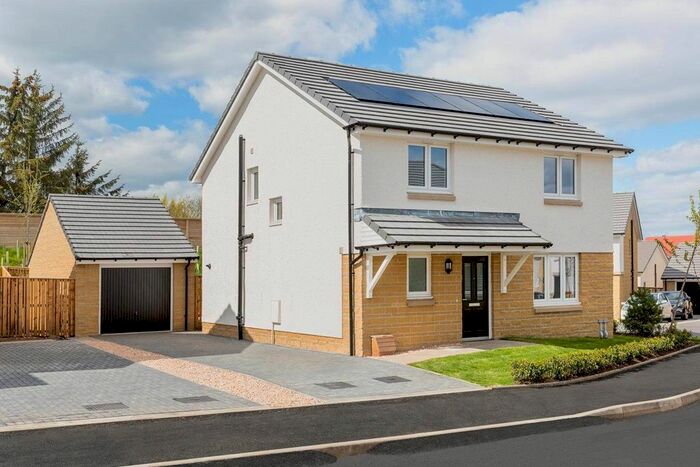
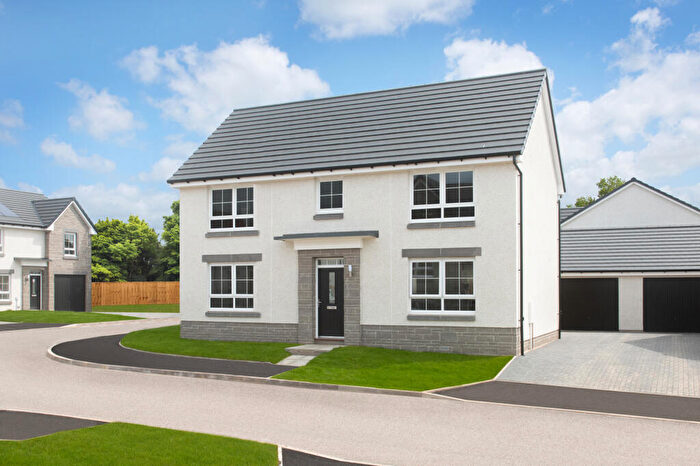
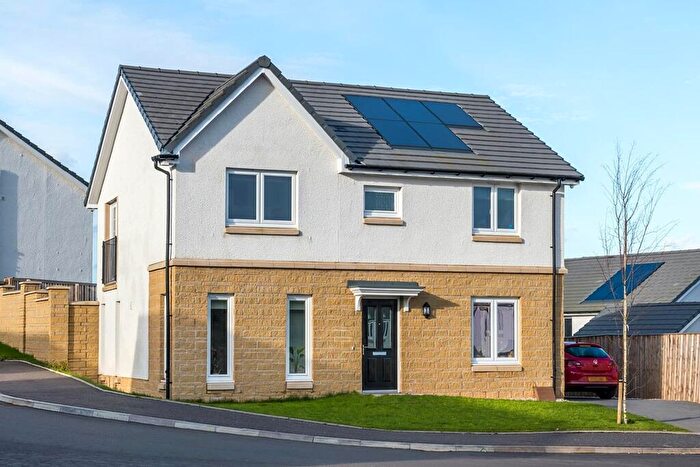
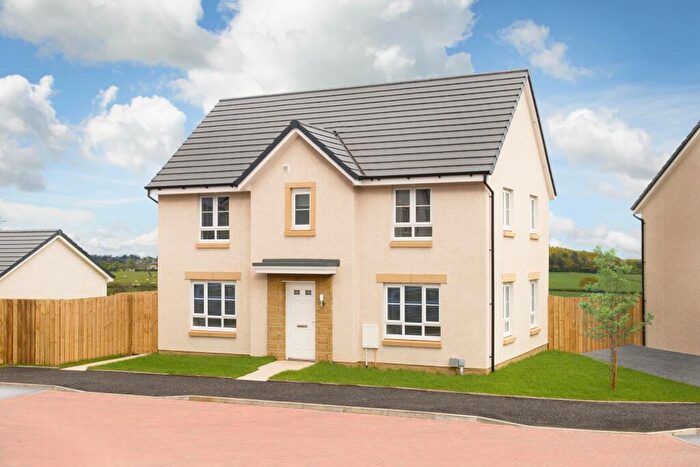
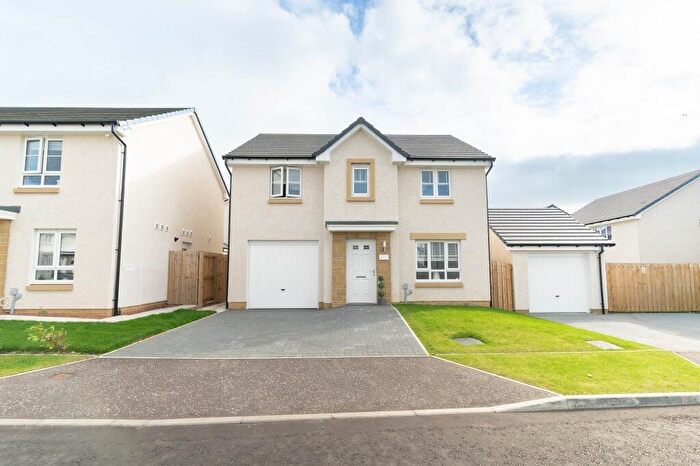
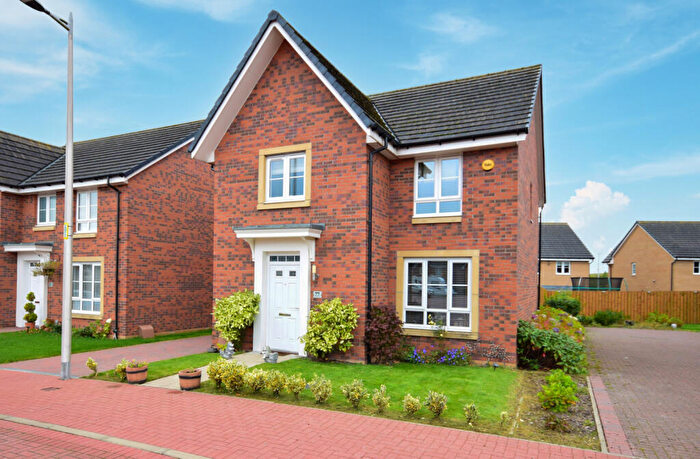
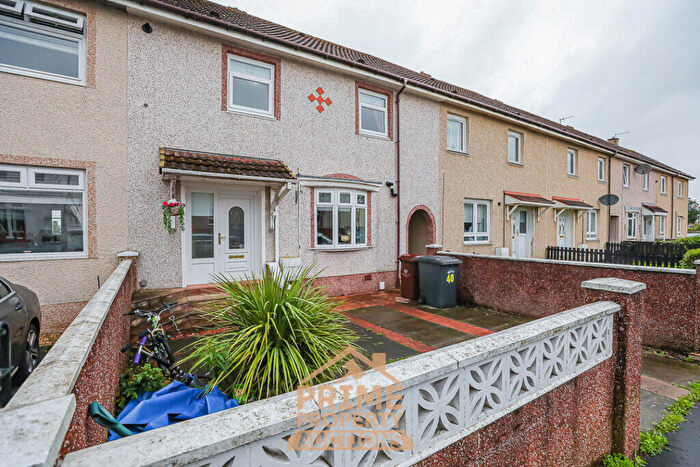
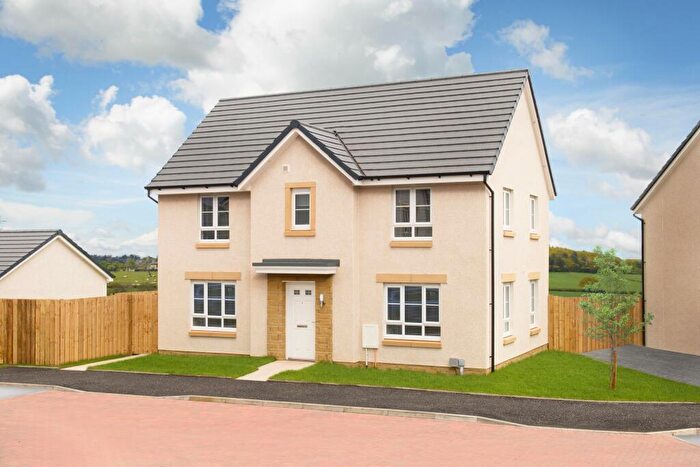
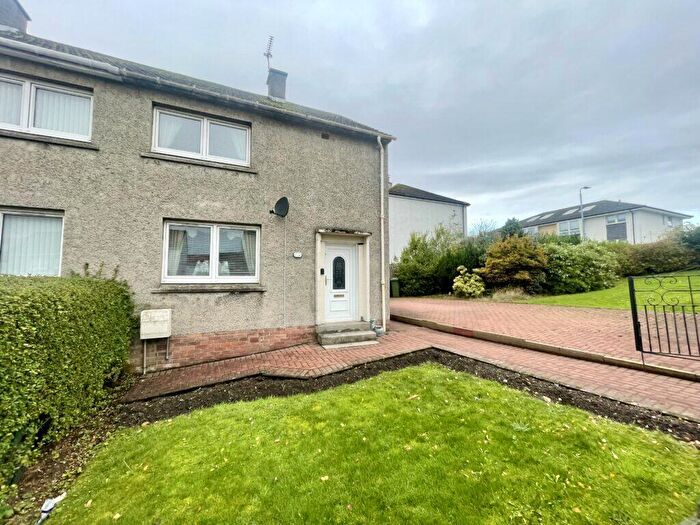
Houses for sale & to rent in Mossend and Holytown, Motherwell
House Prices in Mossend and Holytown
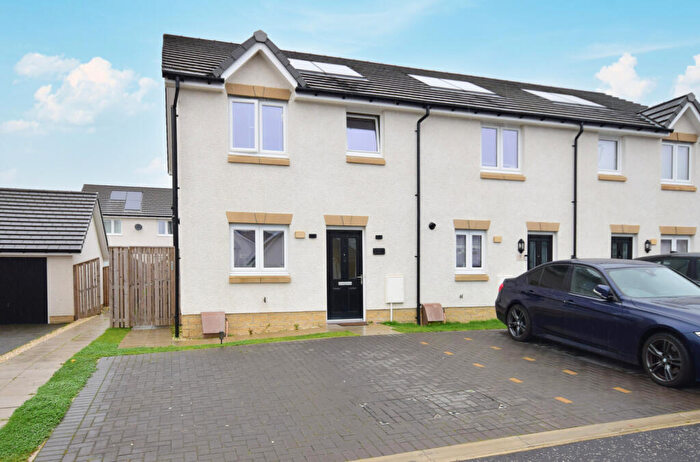
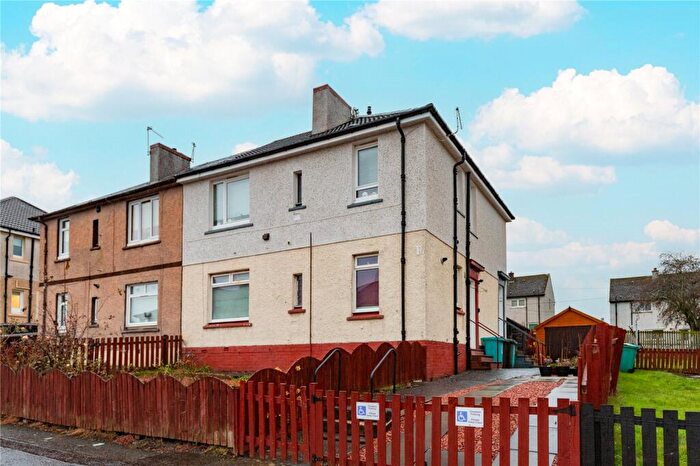
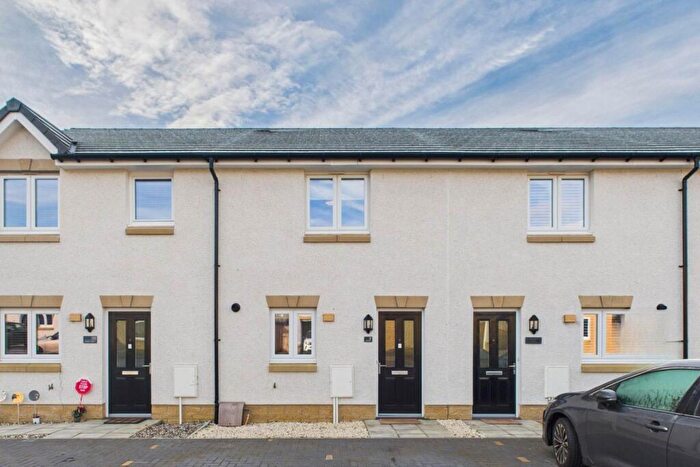
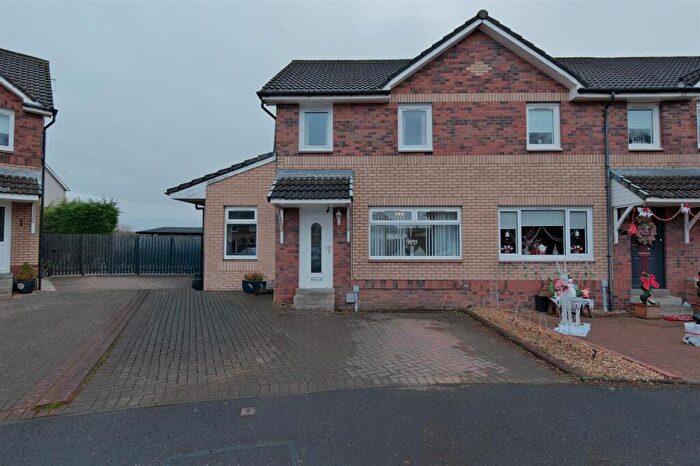
Properties in Mossend and Holytown have an average house price of £192,845.00 and had 144 Property Transactions within the last 3 years¹.
Mossend and Holytown is an area in Motherwell, North Lanarkshire with 2,289 households², where the most expensive property was sold for £399,995.00.
Properties for sale in Mossend and Holytown
Roads and Postcodes in Mossend and Holytown
Navigate through our locations to find the location of your next house in Mossend and Holytown, Motherwell for sale or to rent.
| Streets | Postcodes |
|---|---|
| Abbotsford Place | ML1 4QQ |
| Abernethy Place | ML1 5UW |
| Alder Lane | ML1 4PN |
| Almond Place | ML1 4PD |
| Apollo Path | ML1 4SW |
| Archerfield Crescent | ML1 5FW |
| Ash Walk | ML1 4PH |
| Auchterarder Road | ML1 5XG |
| Ballantrae Wynd | ML1 4NR ML1 4NY |
| Ballindalloch Drive | ML1 5UX |
| Barrie Road | ML1 5WG |
| Beatrice Drive | ML1 4UT |
| Bell Crescent | ML1 5WS |
| Biggar Road | ML1 5UD |
| Birch Street | ML1 4SF |
| Bo'ness Road | ML1 4TQ |
| Braemar Gardens | ML1 5UY |
| Brittain Way | ML1 4XJ |
| Brodick Way | ML1 5XF |
| Brora Green | ML1 5UJ |
| Burn Crescent | ML1 4NF ML1 4NG ML1 4NL ML1 4NN |
| Burn Lane | ML1 4HB |
| Burnet Crescent | ML1 4ZB |
| Burns Crescent | ML1 5WE |
| Byramsmuir Road | ML1 4WH |
| Carmuirs Drive | ML1 5US |
| Carrbridge Crescent | ML1 5UZ |
| Castle Avenue | ML1 4TX |
| Castle Drive | ML1 4TS |
| Catriona Way | ML1 4NS ML1 4NU |
| Central Avenue | ML1 4TE |
| Clyde Lane | ML1 4LZ |
| Clyde Place | ML1 4NA |
| Coddington Crescent | ML1 4YF |
| Condor Glen | ML1 4UY |
| Craigielaw Walk | ML1 5UT |
| Creston Wynd | ML1 4ZF |
| Crow Avenue | ML1 4SE |
| Cuckoo Way | ML1 4PS ML1 4PZ ML1 4QA |
| Dale Drive | ML1 4NB ML1 4ND |
| Dalmahoy Drive | ML1 5UP |
| Dee Path | ML1 4SX |
| Deveron Road | ML1 4SU |
| Dirleton Court | ML1 5UF |
| Dornoch Road | ML1 4NZ ML1 4QB ML1 4QD ML1 4QE ML1 4SY |
| Dovecote Road | ML1 4GP |
| Earn Lane | ML1 4RS |
| East Road | ML1 4NE |
| Eck Path | ML1 4RR |
| Edinburgh Road | ML1 5GH ML1 5RU ML1 5SY |
| Fortrose Gardens | ML1 5UL |
| Fyne Way | ML1 4RJ |
| Garten Walk | ML1 5WD |
| Gemini Grove | ML1 4SP |
| George Street | ML1 4NQ |
| Glasgow & Edinburgh Road | ML1 5GJ |
| Goil Way | ML1 4RL |
| Graham Street | ML1 4QX |
| Grantholm Avenue | ML1 4TY |
| Grayling Road | ML1 4ZD ML1 4ZE |
| Greenside Road Industrial Estate | ML1 5FL |
| Hall Street | ML1 4LX |
| Hamilton Place | ML1 4NJ |
| Harburn Place | ML1 5UG |
| Heather Avenue | ML1 4XX |
| Hermiston Place | ML1 4NP |
| High Street | ML1 5ST |
| Holytown Road | ML1 4TD |
| Howden Place | ML1 4RH ML1 4RN |
| Ivanhoe Place | ML1 4QF |
| Ivy Terrace | ML1 4QH |
| Jerviston Street | ML1 4LY |
| Juniper Wynd | ML1 4SB |
| Katrine Wynd | ML1 4RW |
| Keir Hardie Avenue | ML1 4SH |
| Kenilworth Court | ML1 4NT |
| Kirriemuir Drive | ML1 5XJ |
| Lammermuir Place | ML1 4NX |
| Larch Grove | ML1 4PJ |
| Legbrannock Road | ML1 5SZ |
| Leven Path | ML1 4QY |
| Lilac Way | ML1 4PP |
| Lomond Way | ML1 4QZ |
| Longniddry Gardens | ML1 5UN |
| Louise Gardens | ML1 4XF |
| Lubnaig Walk | ML1 4QP |
| Main Street | ML1 4TA ML1 4TH ML1 4TJ ML1 4TP ML1 4TW |
| Maple Road | ML1 4SD |
| Mcdonald Place | ML1 4QU |
| Mcneil Drive | ML1 4UR |
| Melrose Avenue | ML1 4SG |
| Moray Way | ML1 4QJ |
| Morris Drive | ML1 5UU |
| Morrison Way | ML1 4YX |
| Myrtle Drive | ML1 4PW |
| Ness Way | ML1 4QW |
| Newhouse Industrial Estate | ML1 5RX ML1 5RY ML1 5SB ML1 5SE ML1 5SQ |
| O'wood Avenue | ML1 4TR ML1 4TT ML1 4TU ML1 4TZ |
| Oak Path | ML1 4PT |
| Olive Court | ML1 4PL |
| Panmuir Crescent | ML1 5UR |
| Park Avenue | ML1 4XT |
| Parklands Avenue | ML1 4WQ |
| Parklands Way | ML1 4WR |
| Paterson Walk | ML1 4YY |
| Pavilion Court | ML1 4FU |
| Plantation Avenue | ML1 4UA |
| Quarry Street | ML1 4HD ML1 4HH ML1 4HJ |
| Redwood Road | ML1 4PG ML1 4PQ |
| Renshaw Place | ML1 4UF |
| Rosemarkie Grove | ML1 5UQ |
| Rowallan Drive | ML1 5WX ML1 5XA |
| Rowantree Avenue Industrial Estate | ML1 5SG |
| Rowantree Terrace | ML1 4QG |
| Sherry Avenue | ML1 4XY ML1 4YA ML1 4YB ML1 4YD ML1 4YE |
| Shirrel Road | ML1 4RD |
| Spey Walk | ML1 4ST |
| Spruce Way | ML1 4PB ML1 4PE |
| St Andrews Street | ML1 4SN |
| Stevenston Street | ML1 4LR ML1 4LT ML1 4RG ML1 4RQ |
| Stuart Quadrant | ML1 4TN |
| Sunnyside Avenue | ML1 4RZ |
| Sunnyside Crescent | ML1 4RU ML1 4RY ML1 4SA |
| Sunnyside Gate | ML1 4TG |
| Sunnyside Place | ML1 4RX |
| Sunnyside Terrace | ML1 4SJ ML1 4SL |
| Thankerton Avenue | ML1 4TF |
| Thistle Gardens | ML1 4XZ |
| Thornhill Gardens | ML1 5XB |
| Townhead Avenue | ML1 4ZA |
| Trossachs Avenue | ML1 4RP |
| Tweed Lane | ML1 4SS |
| Union Street | ML1 4HE ML1 4HF ML1 4HG ML1 4HQ |
| Violet Place | ML1 4SQ |
| Westfield Road Industrial Estate | ML1 5TX |
| Westhill Drive | ML1 5XE |
| Wilkie Drive | ML1 4YU ML1 4YW |
| Willow Grove | ML1 4SR |
| Willowburn Avenue | ML1 4ZG |
| Windsor Road | ML1 4NW ML1 4QN ML1 4QR ML1 4QT |
| Wood View | ML1 4PU ML1 4PX |
| Woodhall | ML1 4YT |
| Woodhall Avenue | ML1 4TB |
| Woodlands Drive | ML1 4XU |
| Woodrow | ML1 4YQ |
| Woodside | ML1 4XL |
| ML1 4AX ML1 4PA ML1 4PF ML1 4PR ML1 4PY ML1 4QL ML1 4QS ML1 4RA ML1 4RB ML1 4RT ML1 4SZ ML1 4UB ML1 4XP ML1 4XQ ML1 4XR ML1 4XS ML1 4XW |
Transport near Mossend and Holytown
-
Holytown Station
-
Carfin Station
-
Bellshill Station
-
Motherwell Station
-
Cleland Station
-
Airbles Station
-
Whifflet Station
- FAQ
- Price Paid By Year
Frequently asked questions about Mossend and Holytown
What is the average price for a property for sale in Mossend and Holytown?
The average price for a property for sale in Mossend and Holytown is £192,845. This amount is 23% higher than the average price in Motherwell. There are 1,533 property listings for sale in Mossend and Holytown.
Which train stations are available in or near Mossend and Holytown?
Some of the train stations available in or near Mossend and Holytown are Holytown, Carfin and Bellshill.
Property Price Paid in Mossend and Holytown by Year
The average sold property price by year was:
| Year | Average Sold Price | Price Change |
Sold Properties
|
|---|---|---|---|
| 2023 | £212,391 | 11% |
28 Properties |
| 2022 | £188,127 | 10% |
116 Properties |
| 2021 | £168,673 | 9% |
132 Properties |
| 2020 | £153,903 | -16% |
121 Properties |
| 2019 | £178,597 | -3% |
149 Properties |
| 2018 | £183,750 | 10% |
153 Properties |
| 2017 | £165,300 | 3% |
172 Properties |
| 2016 | £160,251 | 16% |
186 Properties |
| 2015 | £135,043 | 5% |
138 Properties |
| 2014 | £128,113 | 2% |
102 Properties |
| 2013 | £125,665 | 18% |
73 Properties |
| 2012 | £103,045 | 12% |
75 Properties |
| 2011 | £90,198 | 25% |
47 Properties |
| 2010 | £67,199 | -942% |
38 Properties |
| 2009 | £699,965 | 90% |
44 Properties |
| 2008 | £68,530 | -80% |
67 Properties |
| 2007 | £123,276 | 36% |
92 Properties |
| 2006 | £79,250 | -197% |
117 Properties |
| 2005 | £235,055 | 79% |
94 Properties |
| 2004 | £49,941 | 6% |
97 Properties |
| 2003 | £47,073 | 16% |
95 Properties |
| 2002 | £39,659 | 23% |
124 Properties |
| 2001 | £30,429 | - |
7 Properties |

