
Houses for sale & to rent in Motherwell, North Lanarkshire
House Prices in Motherwell
Properties in Motherwell have an average house price of £150k and had 1,454 Property Transactions within the last 3 years.¹
Motherwell is an area in North Lanarkshire with 23,904 households², where the most expensive property was sold for £727k.
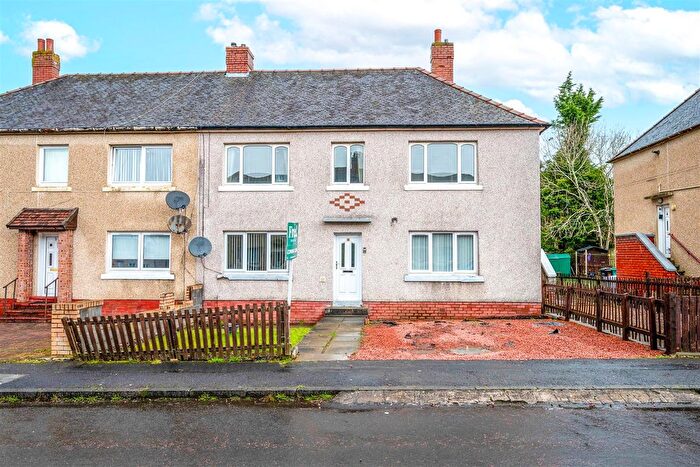
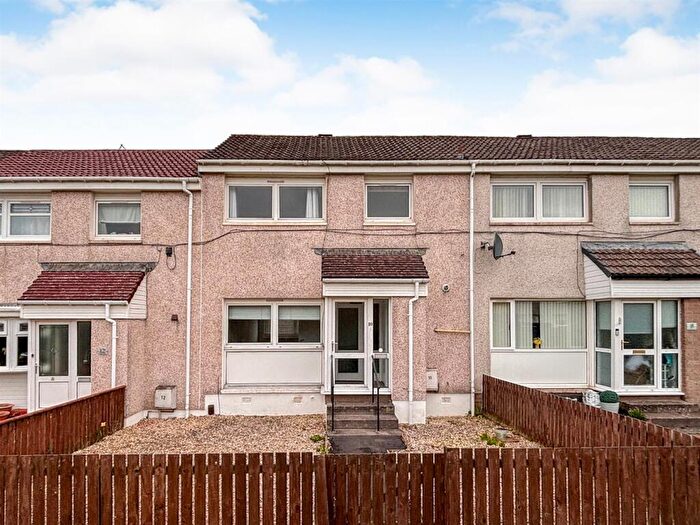
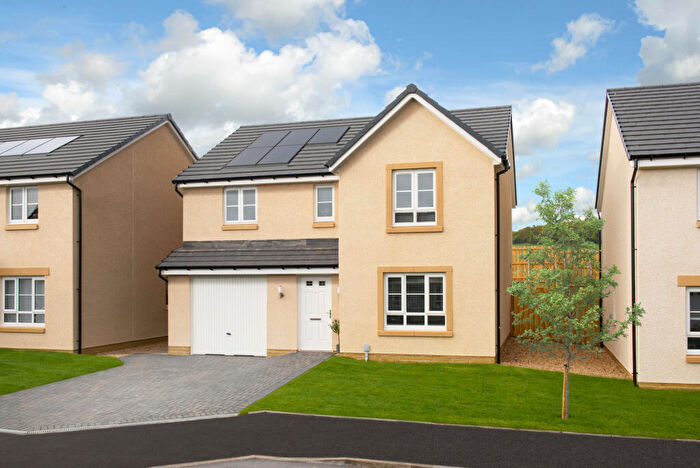
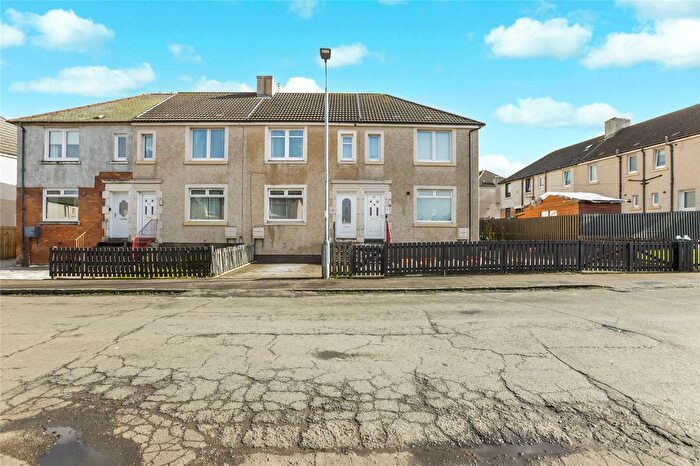
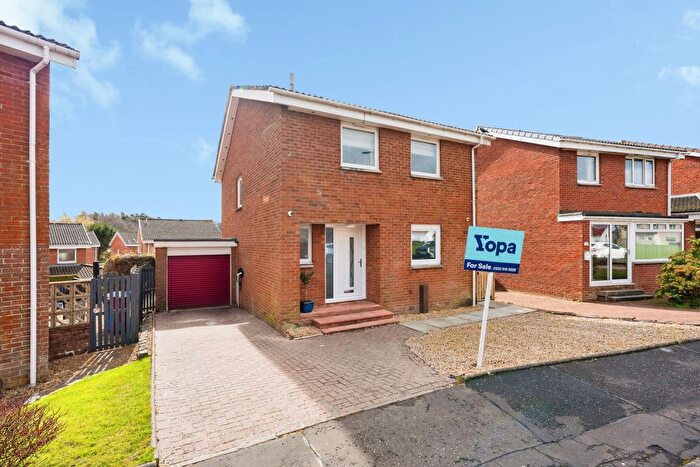
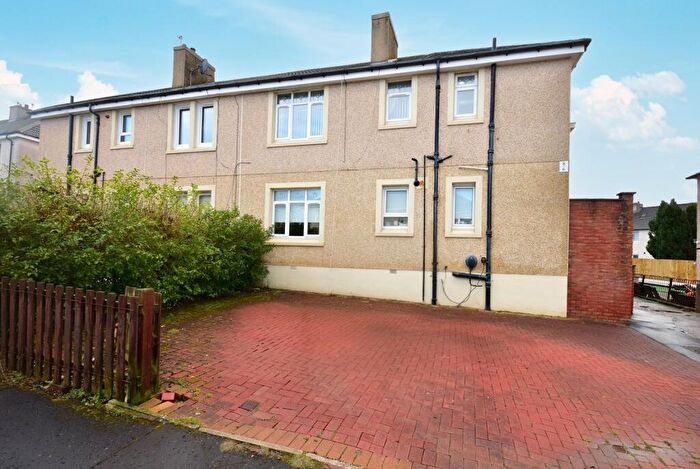
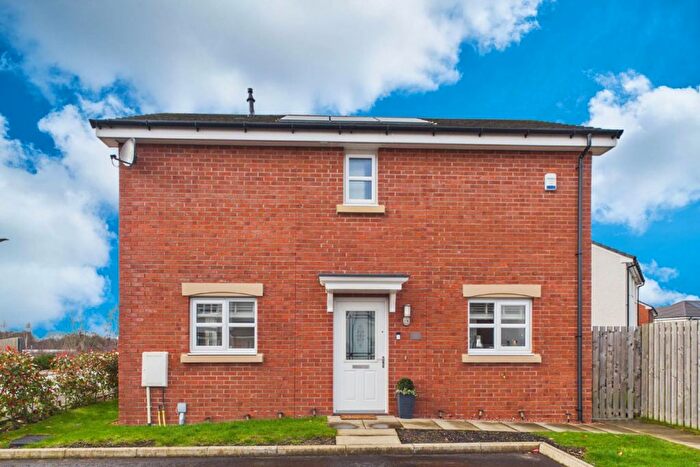
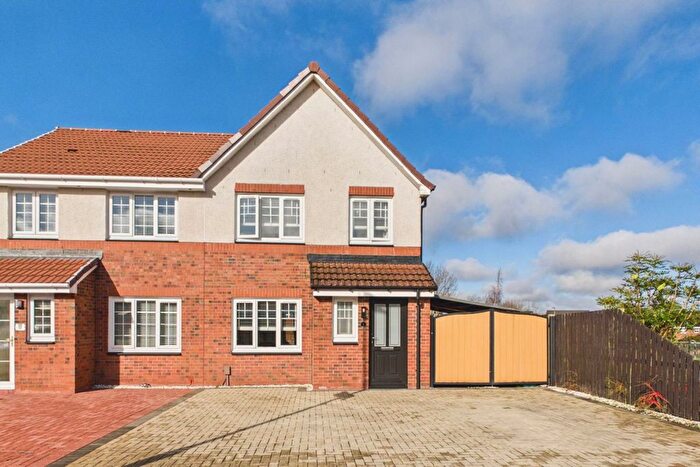
Properties for sale in Motherwell
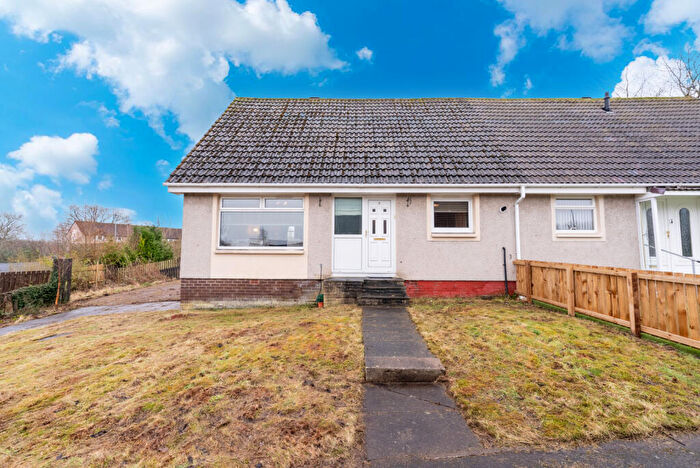

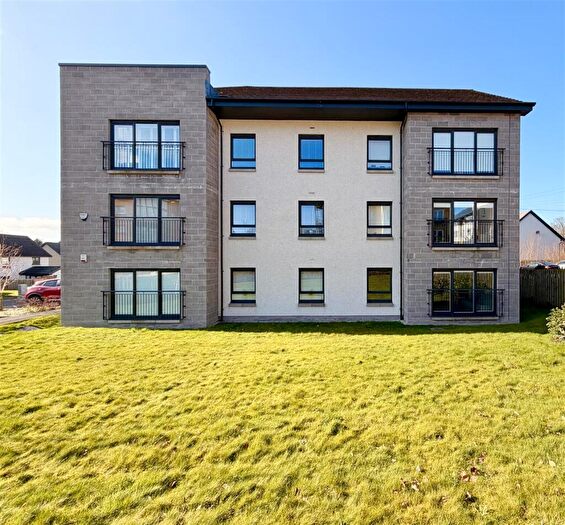
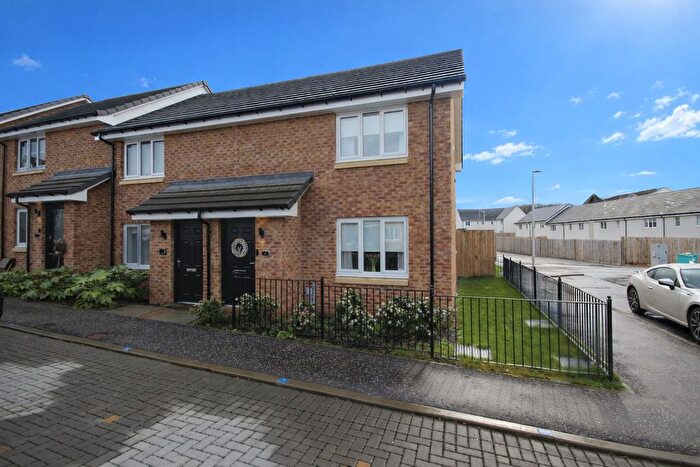
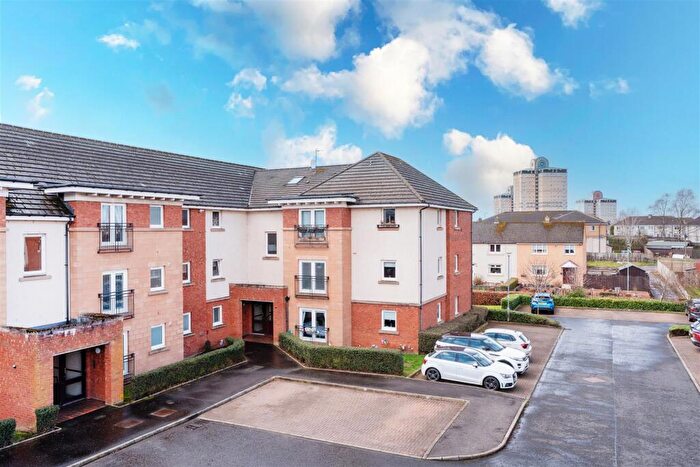
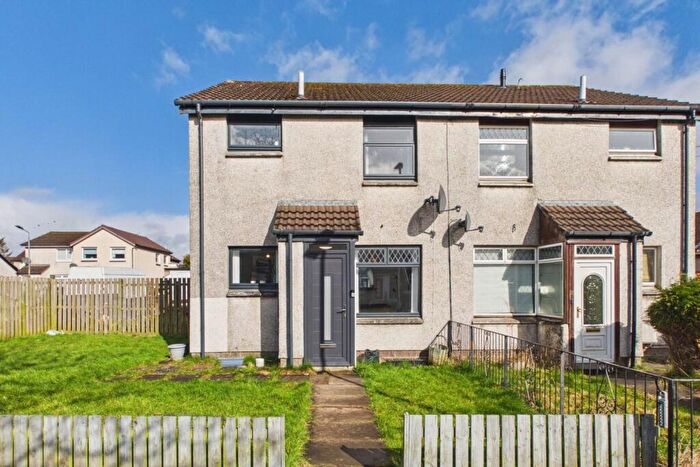
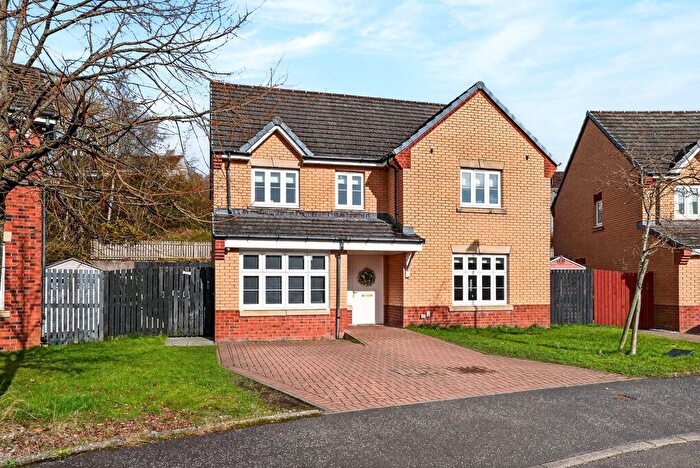
![]()
If you are looking to sell your house, let it out, or receive a property valuation, an expert can help you.
Click the button below to get started.


Neighbourhoods in Motherwell
Navigate through our locations to find the location of your next house in Motherwell, North Lanarkshire for sale or to rent.
Transport in Motherwell
Please see below transportation links in this area:
-
 Motherwell Station
 -
Carfin Station
-
Holytown Station
-
Airbles Station
-
Shieldmuir Station
-
Bellshill Station
-
Cleland Station
-
Chatelherault Station
-
Wishaw Station
- FAQ
- Price Paid By Year
Frequently asked questions about Motherwell
What is the average price for a property for sale in Motherwell?
The average price for a property for sale in Motherwell is £150,106. This amount is 0.51% higher than the average price in North Lanarkshire. There are more than 10,000 property listings for sale in Motherwell.
What locations have the most expensive properties for sale in Motherwell?
The locations with the most expensive properties for sale in Motherwell are Murdostoun at an average of £204,065, Motherwell South East and Ravenscraig at an average of £173,686 and Mossend and Holytown at an average of £157,929.
What locations have the most affordable properties for sale in Motherwell?
The locations with the most affordable properties for sale in Motherwell are Motherwell North at an average of £130,632, Motherwell West at an average of £137,553 and Fortissat at an average of £153,666.
Which train stations are available in or near Motherwell?
Some of the train stations available in or near Motherwell are Motherwell, Carfin and Holytown.
Property Price Paid in Motherwell by Year
The average sold property price by year was:
| Year | Average Sold Price | Price Change |
Sold Properties
|
|---|---|---|---|
| 2025 | £162,043 | 11% |
401 Properties |
| 2024 | £144,626 | -1% |
497 Properties |
| 2023 | £146,395 | -9% |
556 Properties |
| 2022 | £159,075 | 3% |
847 Properties |
| 2021 | £154,967 | 5% |
986 Properties |
| 2020 | £147,723 | -0,3% |
823 Properties |
| 2019 | £148,209 | -2% |
1,077 Properties |
| 2018 | £151,904 | 7% |
1,139 Properties |
| 2017 | £140,728 | 3% |
1,091 Properties |
| 2016 | £136,100 | 5% |
1,073 Properties |
| 2015 | £129,334 | 1% |
1,075 Properties |
| 2014 | £128,217 | 2% |
941 Properties |
| 2013 | £125,398 | -4% |
804 Properties |
| 2012 | £130,520 | 4% |
738 Properties |
| 2011 | £125,167 | 11% |
650 Properties |
| 2010 | £111,767 | -41% |
563 Properties |
| 2009 | £157,327 | 25% |
570 Properties |
| 2008 | £117,374 | -1% |
965 Properties |
| 2007 | £118,082 | 19% |
1,358 Properties |
| 2006 | £96,233 | -1% |
1,363 Properties |
| 2005 | £97,048 | 28% |
1,277 Properties |
| 2004 | £70,356 | 19% |
1,140 Properties |
| 2003 | £56,843 | 10% |
1,123 Properties |
| 2002 | £51,305 | 12% |
1,201 Properties |
| 2001 | £45,364 | - |
94 Properties |