
Houses for sale & to rent in Auchterarder, Perth and Kinross
House Prices in Auchterarder
Properties in Auchterarder have an average house price of £298k and had 247 Property Transactions within the last 3 years.¹
Auchterarder is an area in Perth and Kinross with 2,849 households², where the most expensive property was sold for £2.1M.
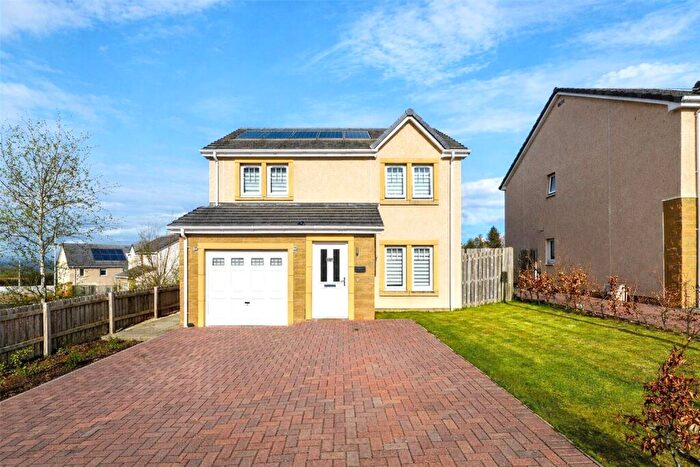
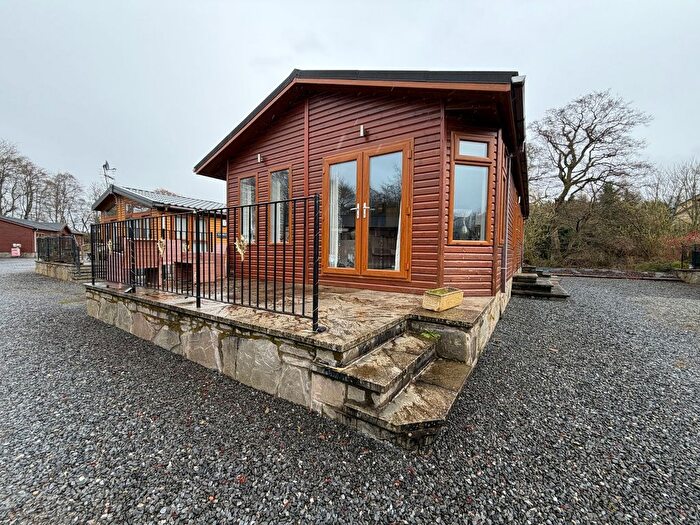
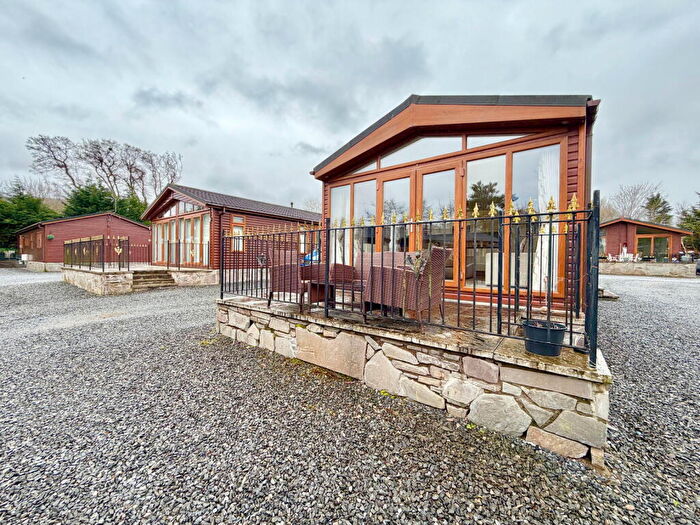
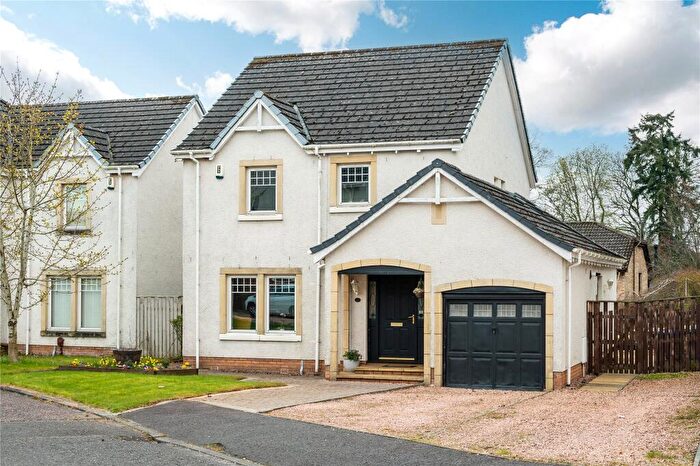
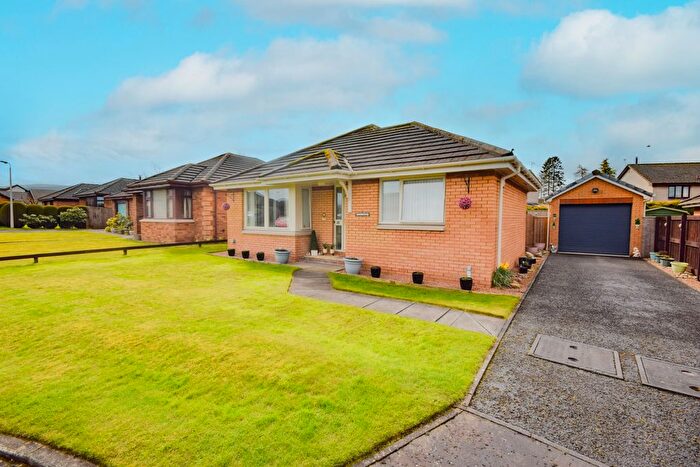
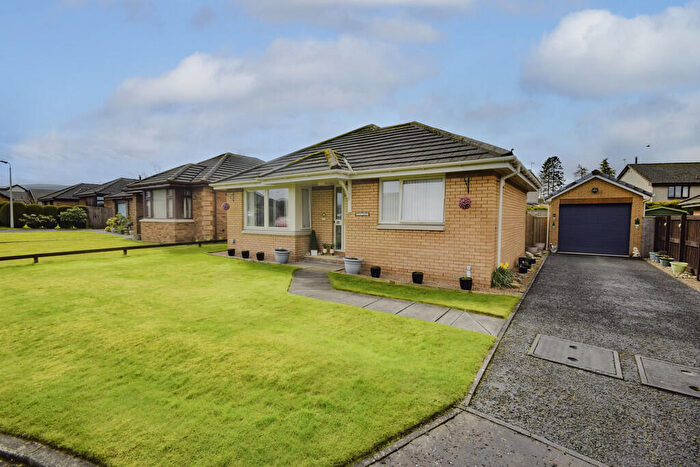
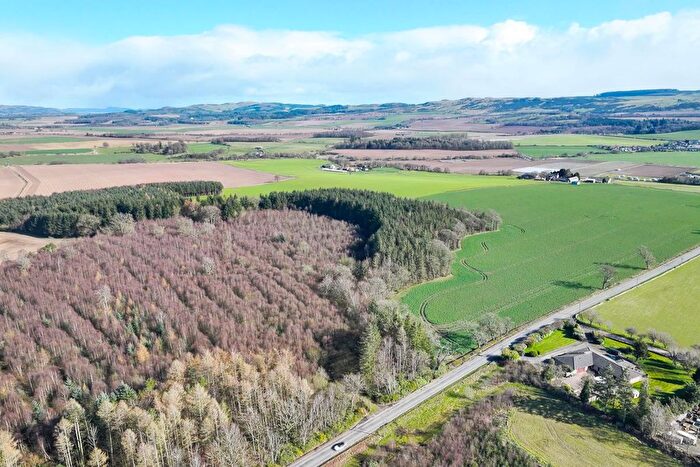
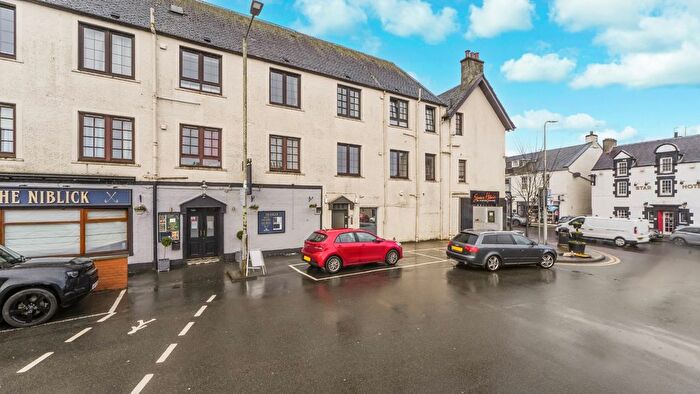
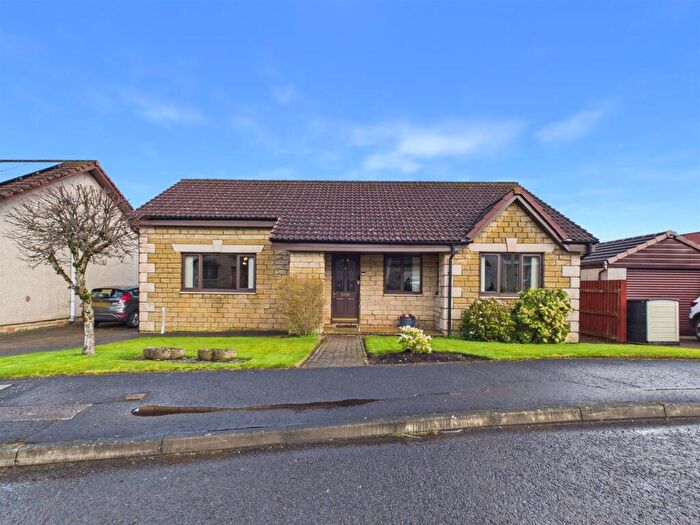
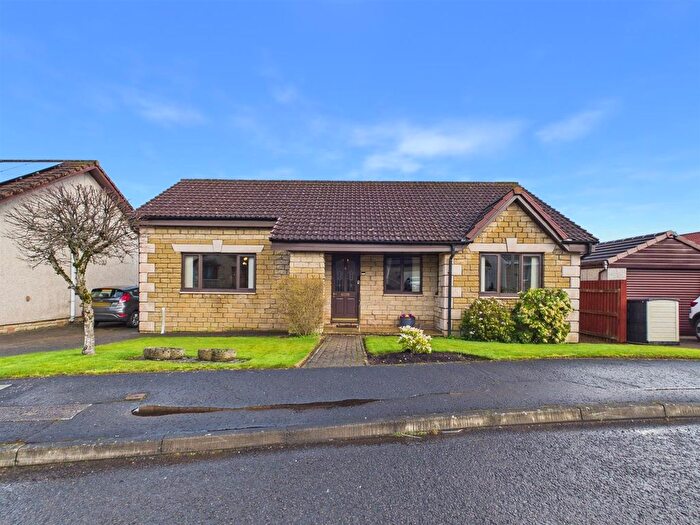
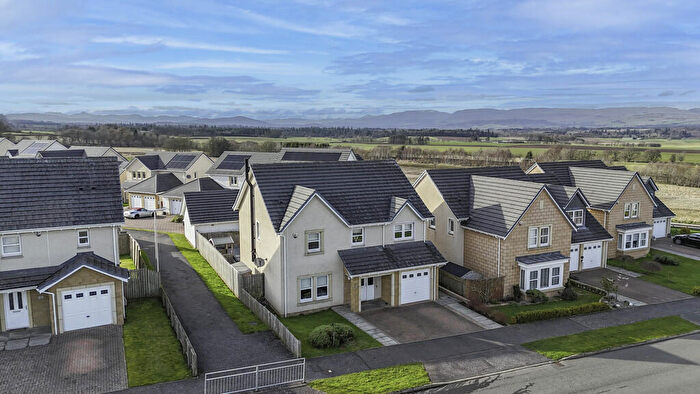
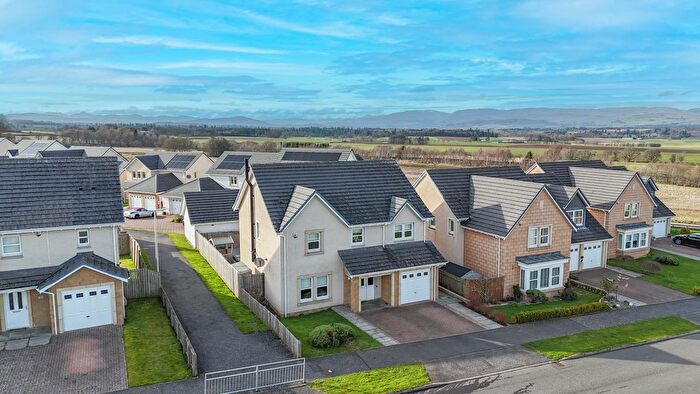
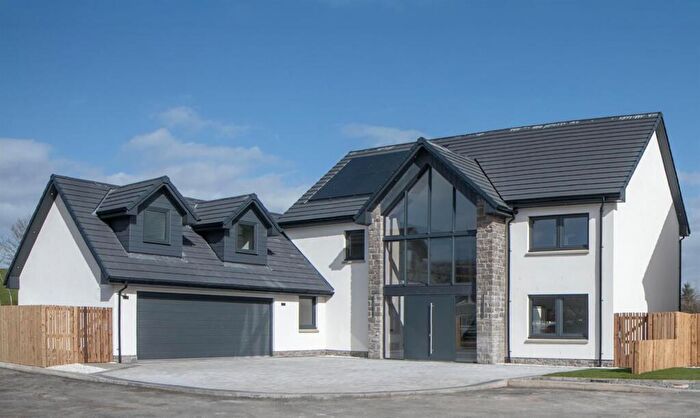
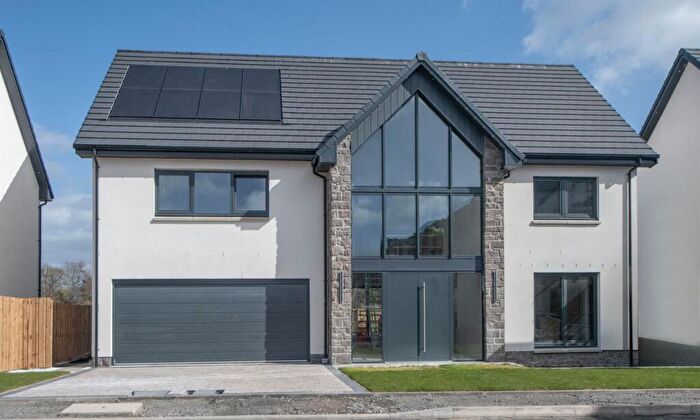
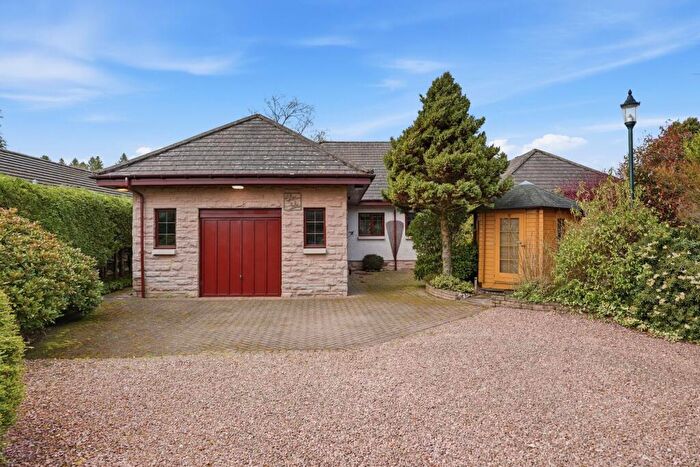
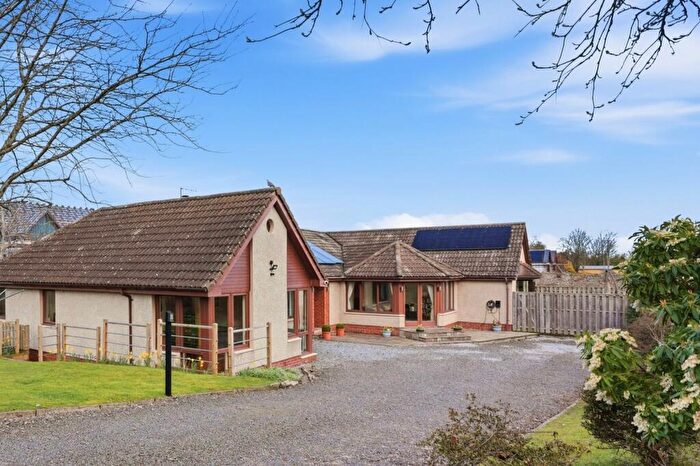
Properties for sale in Auchterarder
![]()
If you are looking to sell your house, let it out, or receive a property valuation, an expert can help you.
Click the button below to get started.


Neighbourhoods in Auchterarder
Navigate through our locations to find the location of your next house in Auchterarder, Perth and Kinross for sale or to rent.
Transport in Auchterarder
Please see below transportation links in this area:
-
 Gleneagles Station
 -
Dunblane Station
-
Perth Station
-
Alloa Station
-
Bridge Of Allan Station
-
Stirling Station
- FAQ
- Price Paid By Year
Frequently asked questions about Auchterarder
What is the average price for a property for sale in Auchterarder?
The average price for a property for sale in Auchterarder is £298,040. This amount is 35% higher than the average price in Perth and Kinross. There are 1,129 property listings for sale in Auchterarder.
Which train stations are available in or near Auchterarder?
Some of the train stations available in or near Auchterarder are Gleneagles, Dunblane and Perth.
Property Price Paid in Auchterarder by Year
The average sold property price by year was:
| Year | Average Sold Price | Price Change |
Sold Properties
|
|---|---|---|---|
| 2025 | £313,440 | -2% |
82 Properties |
| 2024 | £318,749 | 18% |
83 Properties |
| 2023 | £261,679 | -20% |
82 Properties |
| 2022 | £314,416 | 9% |
210 Properties |
| 2021 | £285,185 | 11% |
284 Properties |
| 2020 | £252,597 | -3% |
174 Properties |
| 2019 | £258,920 | 7% |
216 Properties |
| 2018 | £239,729 | -6% |
230 Properties |
| 2017 | £253,130 | -5% |
252 Properties |
| 2016 | £264,782 | 7% |
239 Properties |
| 2015 | £246,571 | 1% |
223 Properties |
| 2014 | £244,937 | 6% |
204 Properties |
| 2013 | £230,692 | 10% |
150 Properties |
| 2012 | £207,089 | -14% |
119 Properties |
| 2011 | £236,400 | -3% |
88 Properties |
| 2010 | £244,099 | 15% |
114 Properties |
| 2009 | £207,384 | -64% |
90 Properties |
| 2008 | £340,276 | 36% |
107 Properties |
| 2007 | £218,597 | -60% |
173 Properties |
| 2006 | £349,642 | 55% |
206 Properties |
| 2005 | £157,217 | -5% |
180 Properties |
| 2004 | £164,994 | 19% |
182 Properties |
| 2003 | £133,159 | 17% |
194 Properties |
| 2002 | £110,121 | -12% |
241 Properties |
| 2001 | £123,092 | - |
19 Properties |