
Houses for sale in Perth and Kinross, Scotland
House Prices in Perth and Kinross
Properties in Perth and Kinross have
an average house price of
£221k
and had 4,173 Property Transactions
within the last 3 years.¹
Perth and Kinross is a location in
Scotland with
64,582 households², where the most expensive property was sold for £2.1M.
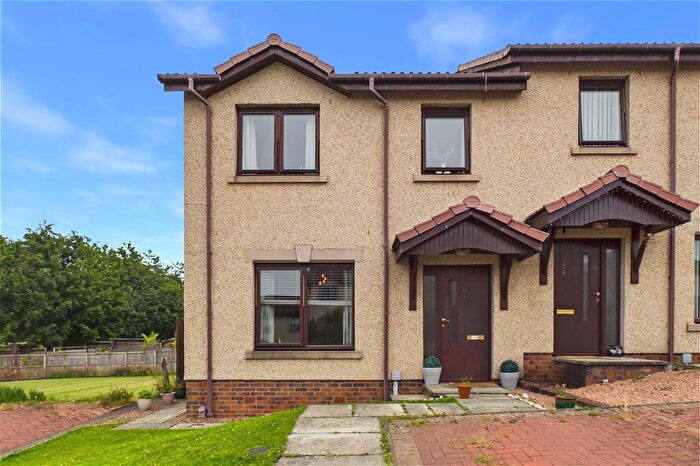
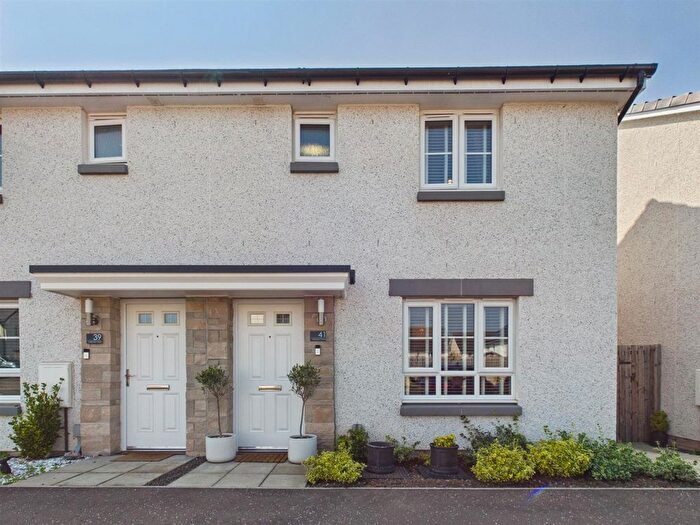
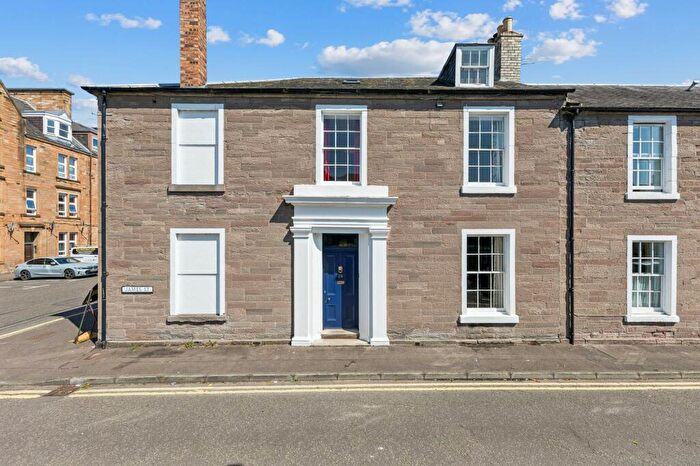
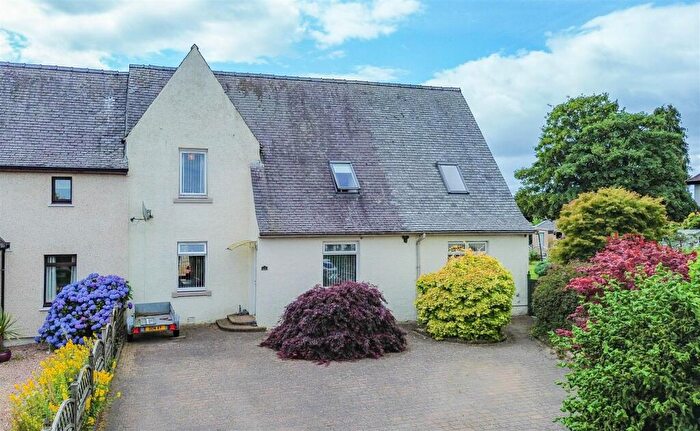
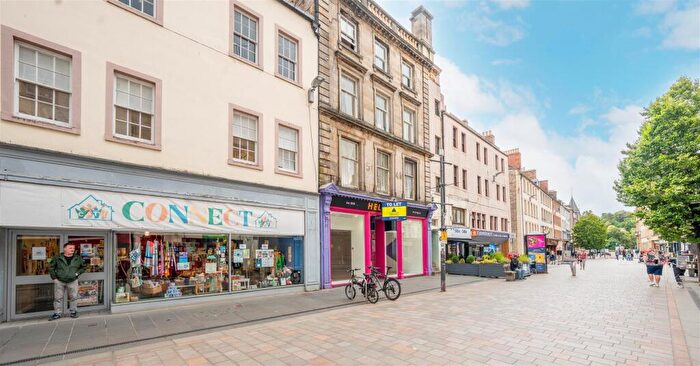
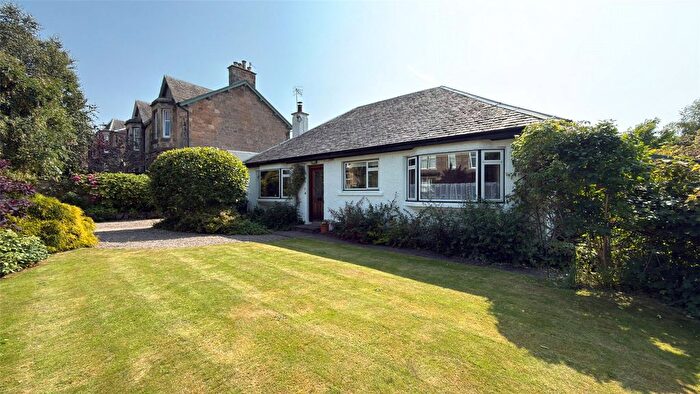
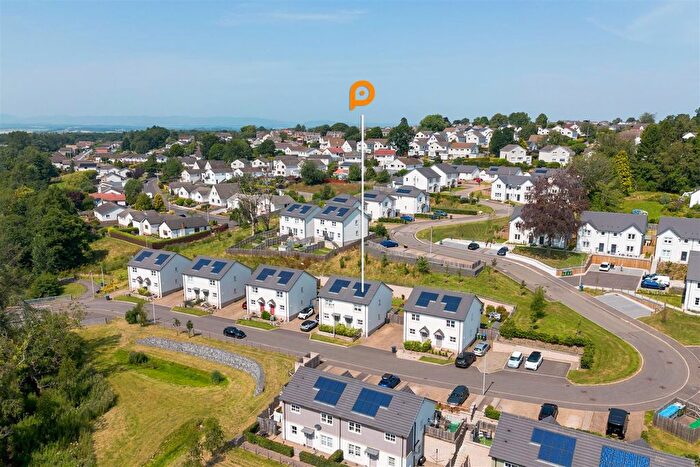
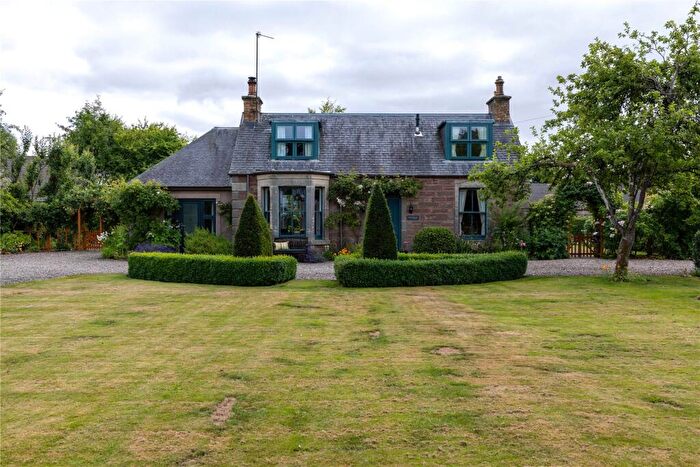
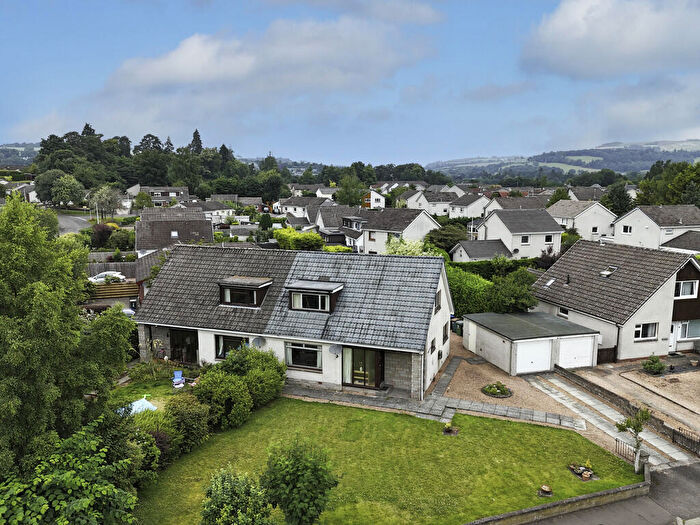
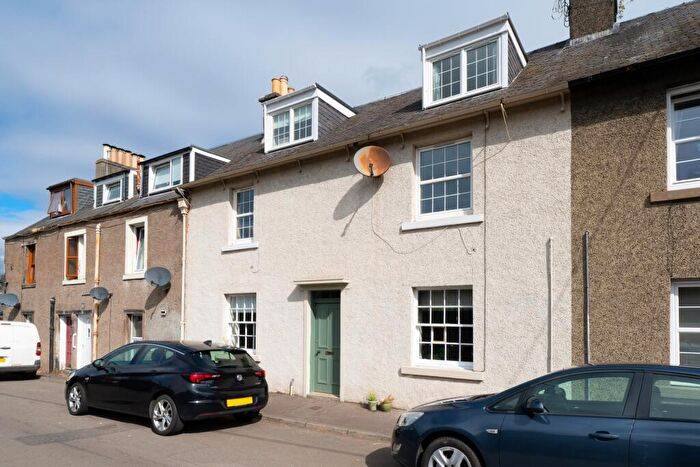
Properties for sale in Perth and Kinross
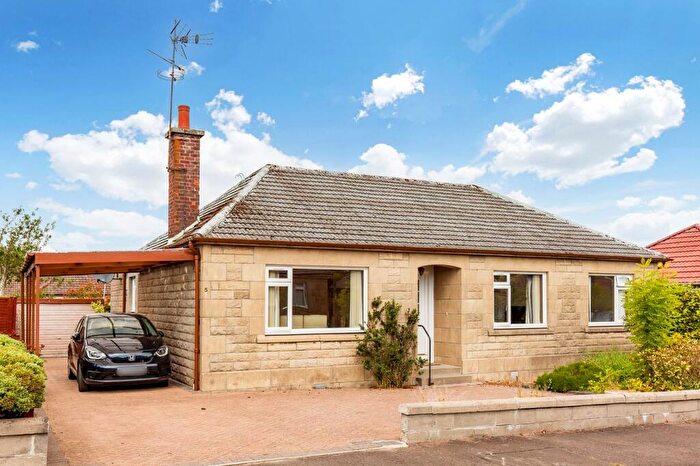
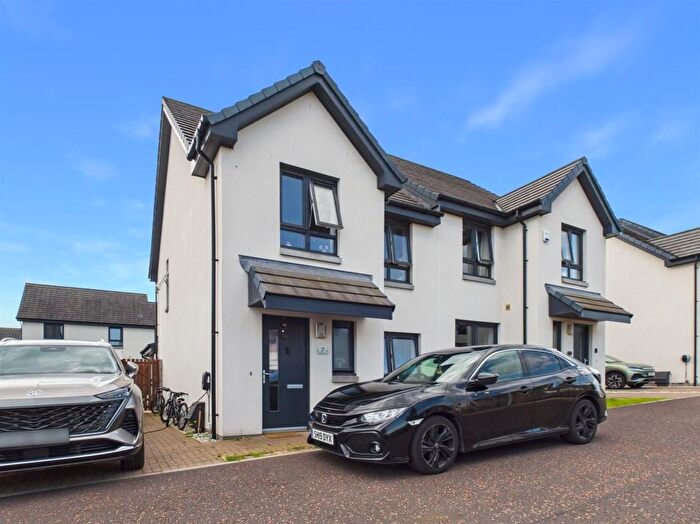

![]()
If you are looking to sell your house, let it out, or receive a property valuation, an expert can help you.
Click the button below to get started.


Towns in Perth and Kinross
Navigate through our locations to find the location of your next house in Perth and Kinross, Scotland for sale or to rent.
Property price trends in Perth and Kinross
According to the latest Registers of Scotland data, the average home in Perth and Kinross sold for £216,896 in 2026. That figure comes from a substantial record of 68,578 sales logged over the past 25 years.
Prices have softened over the last three years. Compared with 2023, when the typical sale came in around £222,895, that's a fall of roughly 2.7%.
Looking back five years, average prices are down about 5.4% since 2021, a drop of around £12,380 in cash terms.
Zoom out to the past decade for the fuller picture. Back in 2016, homes here averaged £188,486, so the typical sold price has climbed about 15.1% since then, roughly 1.4% a year. Stretch the view to fifteen years and that annual pace holds at about 1.2%.
Frequently asked questions about Perth and Kinross
What is the average price for a property for sale in Perth and Kinross?
The average price for a property for sale in Perth and Kinross is £220,755. This amount is 10% higher than the average price in Scotland. There are more than 10,000 property listings for sale in Perth and Kinross.
What locations have the most expensive properties for sale in Perth and Kinross?
The locations with the most expensive properties for sale in Perth and Kinross are Cowdenbeath at an average of £478,000, Dollar at an average of £382,950 and Glenrothes at an average of £358,750.
What locations have the most affordable properties for sale in Perth and Kinross?
The locations with the most affordable properties for sale in Perth and Kinross are Blairgowrie at an average of £196,787, Dundee at an average of £199,578 and Perth at an average of £201,554.
Which train stations are available in or near Perth and Kinross?
Some of the train stations available in or near Perth and Kinross are Perth, Dunkeld and Birnam and Gleneagles.
Property Price Paid in Perth and Kinross by Year
The average sold property price by year was:
| Year | Average Sold Price | Price Change |
Sold Properties
|
|---|---|---|---|
| 2026 | £216,896 | -1% |
263 Properties |
| 2025 | £219,561 | -0,4% |
1,246 Properties |
| 2024 | £220,353 | -1% |
1,259 Properties |
| 2023 | £222,895 | -10% |
1,405 Properties |
| 2022 | £245,202 | 6% |
2,978 Properties |
| 2021 | £229,276 | 4% |
3,702 Properties |
| 2020 | £219,216 | 7% |
2,624 Properties |
| 2019 | £203,841 | 4% |
3,111 Properties |
| 2018 | £195,677 | -1% |
3,138 Properties |
| 2017 | £197,127 | 4% |
3,084 Properties |
Transport in Perth and Kinross
Please see below transportation links in this area:
