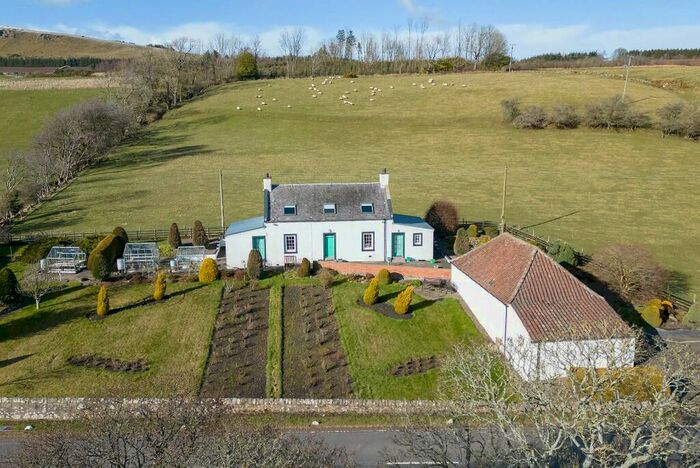
Houses for sale & to rent in Kinross-shire, Glenrothes
House Prices in Kinross-shire
Properties in Kinross-shire have no sales history available within the last 3 years.
Kinross-shire is an area in Glenrothes, Perth and Kinross with 33 households².
Previously listed properties in Kinross-shire
Roads and Postcodes in Kinross-shire
Navigate through our locations to find the location of your next house in Kinross-shire, Glenrothes for sale or to rent.
Transport near Kinross-shire
-
Cardenden Station
-
Lochgelly Station
-
Markinch Station
-
Glenrothes with Thornton Station
-
Cowdenbeath Station
-
Kirkcaldy Station
-
Ladybank Station
-
Dunfermline Station
-
Kinghorn Station
- FAQ
- Price Paid By Year
Frequently asked questions about Kinross-shire
Which train stations are available in or near Kinross-shire?
Some of the train stations available in or near Kinross-shire are Cardenden, Lochgelly and Markinch.
Property Price Paid in Kinross-shire by Year
The average sold property price by year was:
| Year | Average Sold Price | Price Change |
Sold Properties
|
|---|---|---|---|
| 2022 | £420,000 | -9% |
1 Property |
| 2021 | £456,166 | 25% |
3 Properties |
| 2020 | £340,000 | -23% |
2 Properties |
| 2019 | £418,000 | 12% |
1 Property |
| 2017 | £368,500 | 9% |
1 Property |
| 2016 | £337,000 | -4% |
1 Property |
| 2015 | £352,000 | -79% |
1 Property |
| 2014 | £630,833 | 54% |
3 Properties |
| 2013 | £288,875 | -16% |
4 Properties |
| 2012 | £334,500 | 25% |
2 Properties |
| 2010 | £251,500 | -168% |
2 Properties |
| 2009 | £674,175 | 56% |
2 Properties |
| 2008 | £293,333 | 25% |
3 Properties |
| 2005 | £219,000 | 6% |
2 Properties |
| 2004 | £205,000 | 22% |
1 Property |
| 2003 | £160,000 | -88% |
1 Property |
| 2002 | £300,000 | - |
1 Property |


