
Houses for sale & to rent in Hawick and Hermitage, Canonbie
House Prices in Hawick and Hermitage
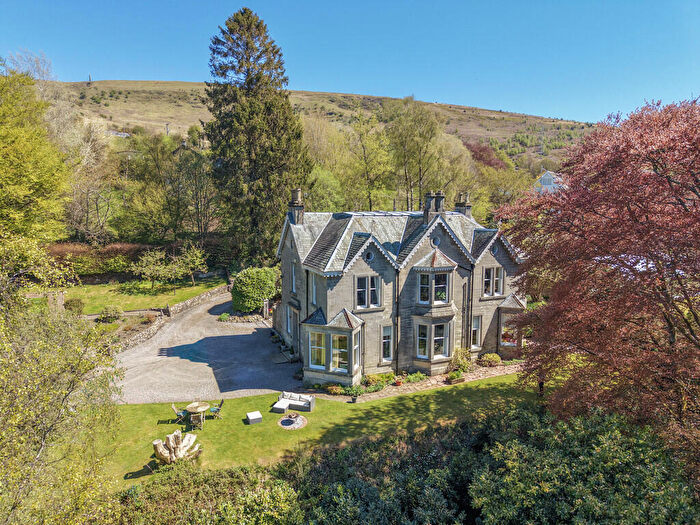
Properties in Hawick and Hermitage have an average house price of £110k and had 107 Property Transactions within the last 3 years¹.
Hawick and Hermitage is an area in Canonbie, Scottish Borders with 2,175 households², where the most expensive property was sold for £560k.
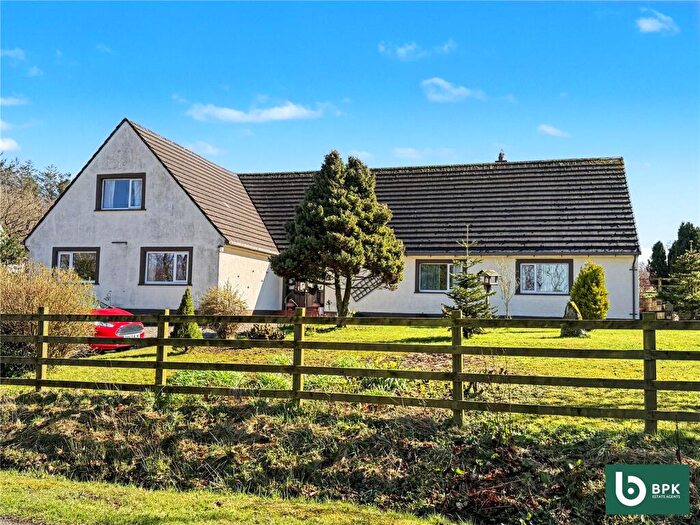
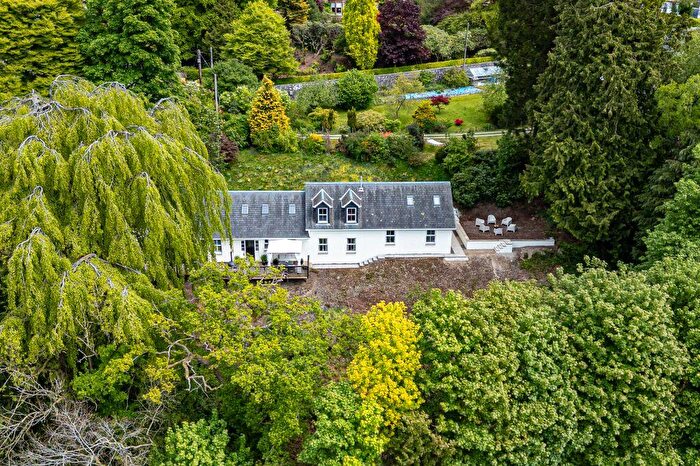
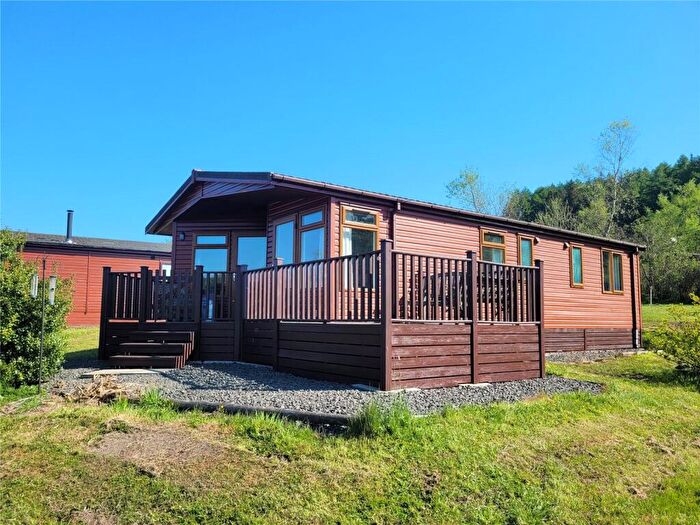
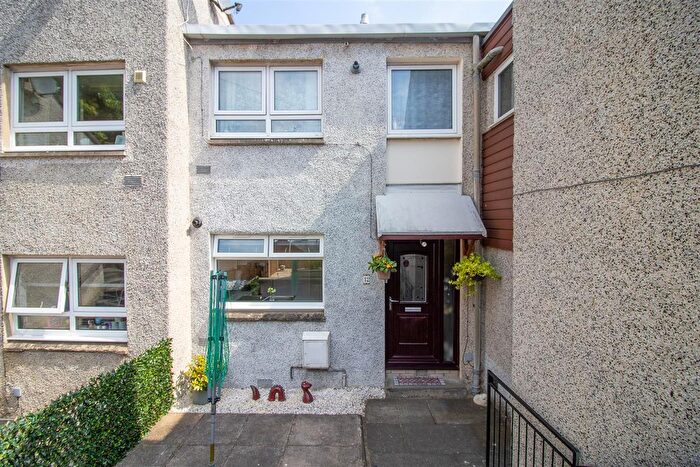
Properties for sale in Hawick and Hermitage
![]()
If you are looking to sell your house, let it out, or receive a property valuation, an expert can help you.
Click the button below to get started.

Previously listed properties in Hawick and Hermitage
Roads and Postcodes in Hawick and Hermitage
Navigate through our locations to find the location of your next house in Hawick and Hermitage, Canonbie for sale or to rent.
Transport near Hawick and Hermitage
-
 Tweedbank Station
 -
Galashiels Station
-
Gretna Green Station
-
Stow Station
-
Lockerbie Station
-
Brampton (Cumbria) Station
-
Haltwhistle Station
-
Annan Station
- FAQ
- Price Paid By Year
Frequently asked questions about Hawick and Hermitage
What is the average price for a property for sale in Hawick and Hermitage?
The average price for a property for sale in Hawick and Hermitage is £109,629. There are 883 property listings for sale in Hawick and Hermitage.
What streets have the most expensive properties for sale in Hawick and Hermitage?
The streets with the most expensive properties for sale in Hawick and Hermitage are Paterson Gardens at an average of £320,833, Liddesdale Crescent at an average of £280,000 and Oliver Place at an average of £162,500.
What streets have the most affordable properties for sale in Hawick and Hermitage?
The streets with the most affordable properties for sale in Hawick and Hermitage are Drumlanrig Square at an average of £38,000, Gladstone Street at an average of £50,500 and Longcroft Road at an average of £65,750.
Which train stations are available in or near Hawick and Hermitage?
Some of the train stations available in or near Hawick and Hermitage are Tweedbank, Galashiels and Gretna Green.
Property Price Paid in Hawick and Hermitage by Year
The average sold property price by year was:
| Year | Average Sold Price | Price Change |
Sold Properties
|
|---|---|---|---|
| 2025 | £111,567 | 10% |
31 Properties |
| 2024 | £100,599 | -14% |
30 Properties |
| 2023 | £114,211 | -10% |
46 Properties |
| 2022 | £126,060 | -18% |
89 Properties |
| 2021 | £148,825 | 17% |
105 Properties |
| 2020 | £123,808 | -8% |
72 Properties |
| 2019 | £134,162 | 9% |
94 Properties |
| 2018 | £122,748 | 5% |
71 Properties |
| 2017 | £116,764 | -12% |
77 Properties |
| 2016 | £130,512 | 10% |
75 Properties |
| 2015 | £117,971 | 7% |
69 Properties |
| 2014 | £109,939 | 6% |
60 Properties |
| 2013 | £103,664 | -6% |
68 Properties |
| 2012 | £110,322 | -46% |
50 Properties |
| 2011 | £161,538 | 32% |
44 Properties |
| 2010 | £109,543 | 7% |
51 Properties |
| 2009 | £101,685 | 3% |
52 Properties |
| 2008 | £98,268 | -32% |
72 Properties |
| 2007 | £129,758 | 23% |
105 Properties |
| 2006 | £100,190 | 37% |
105 Properties |
| 2005 | £62,837 | -40% |
77 Properties |
| 2004 | £87,959 | 19% |
138 Properties |
| 2003 | £70,970 | 41% |
117 Properties |
| 2002 | £41,837 | -0,5% |
148 Properties |
| 2001 | £42,040 | - |
13 Properties |