
Houses for sale in Scottish Borders, Scotland
House Prices in Scottish Borders
Properties in Scottish Borders have
an average house price of
£197k
and had 2,640 Property Transactions
within the last 3 years.¹
Scottish Borders is a location in
Scotland with
52,342 households², where the most expensive property was sold for £1.45M.
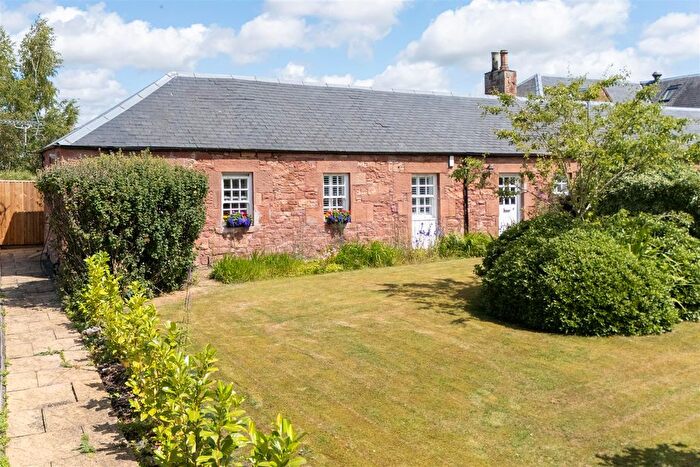
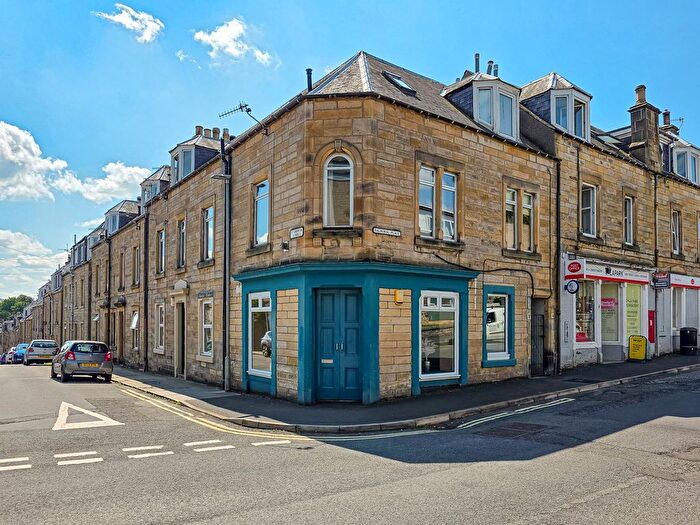
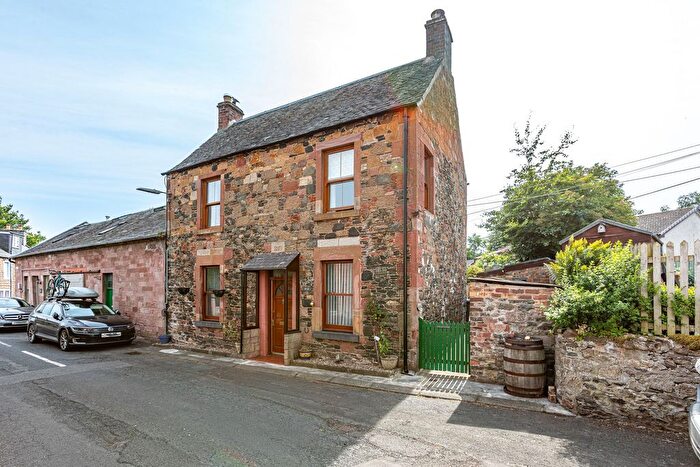
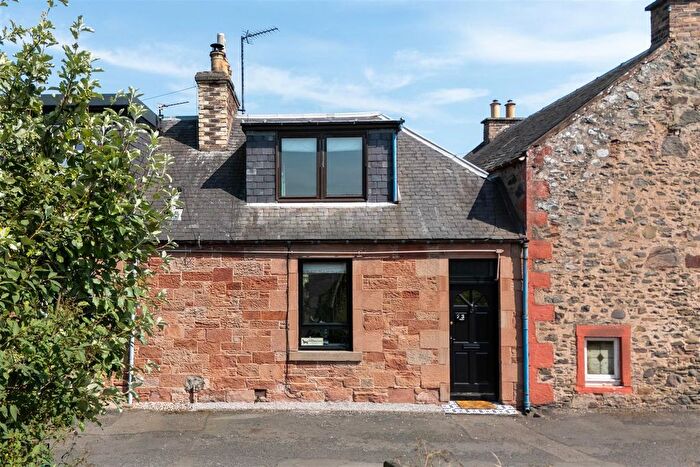
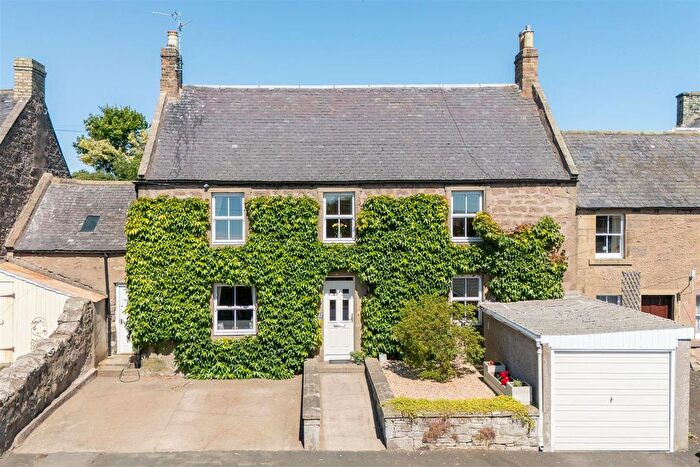
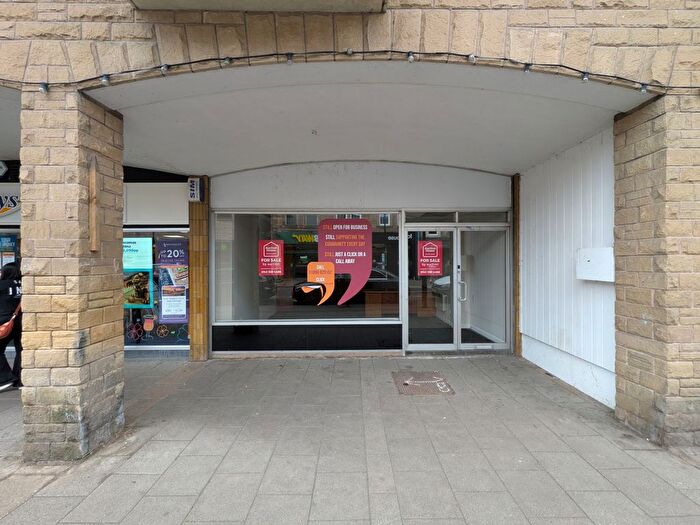
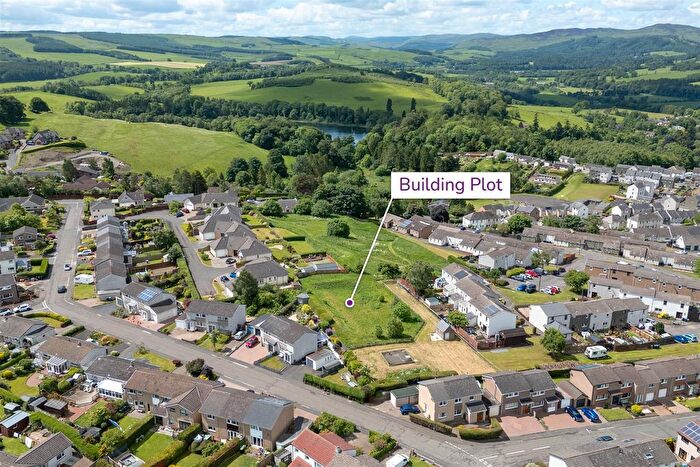
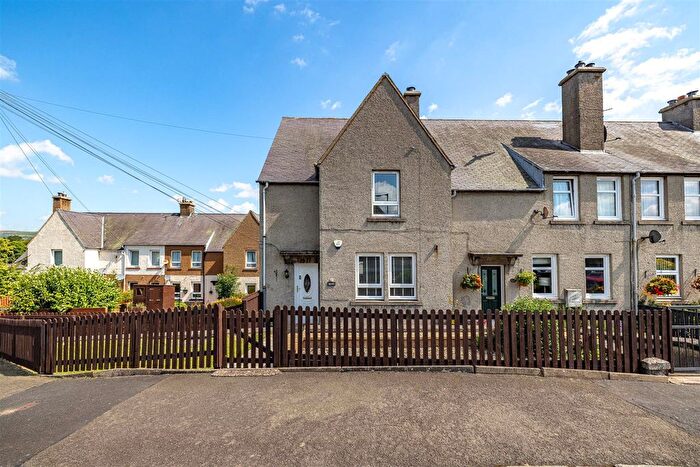
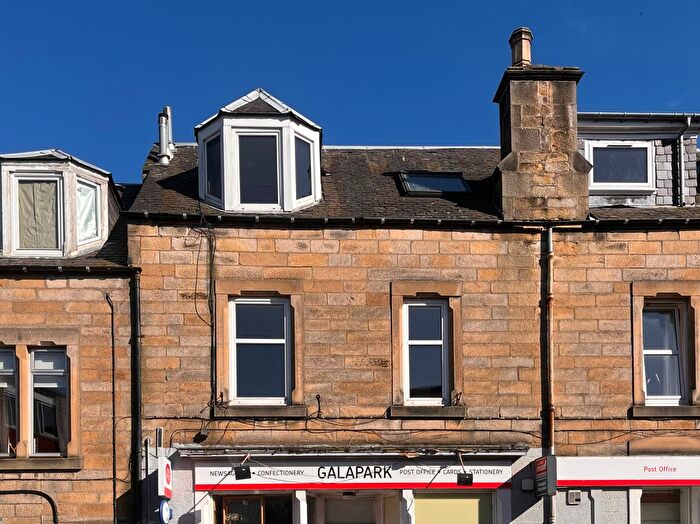
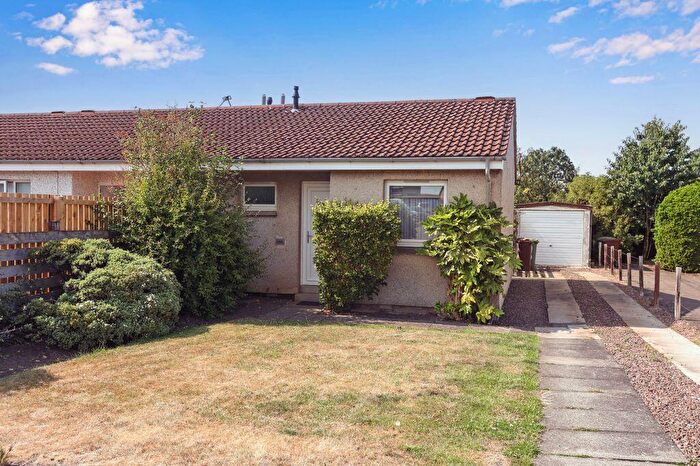
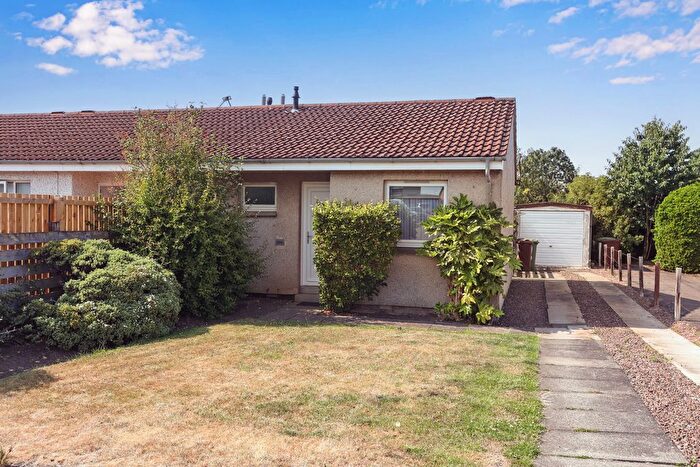
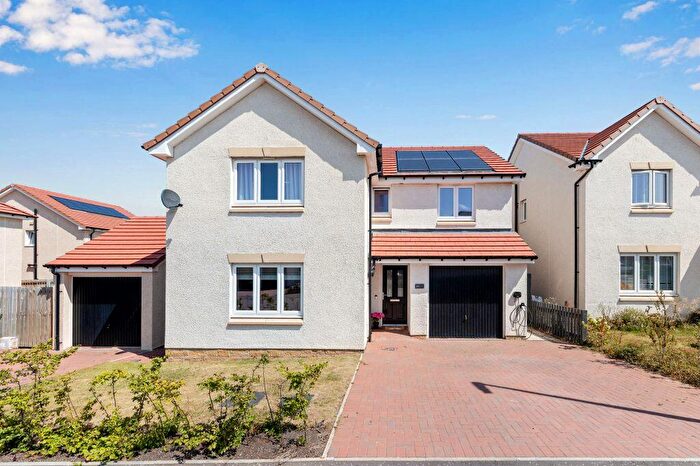
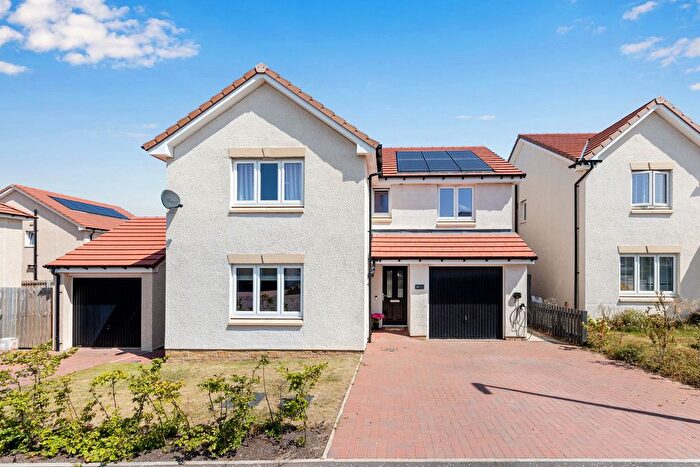
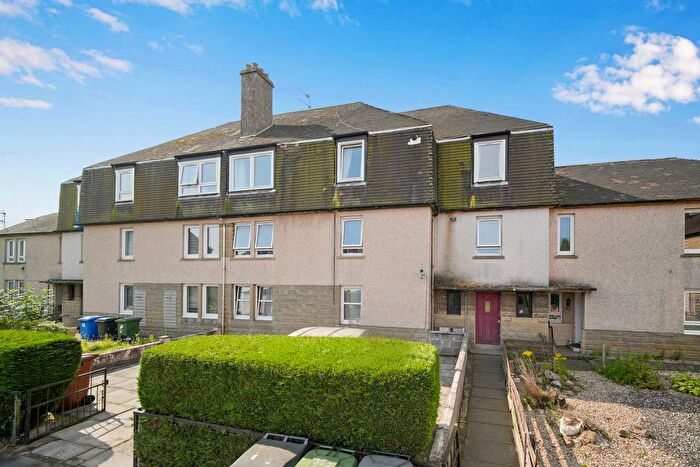
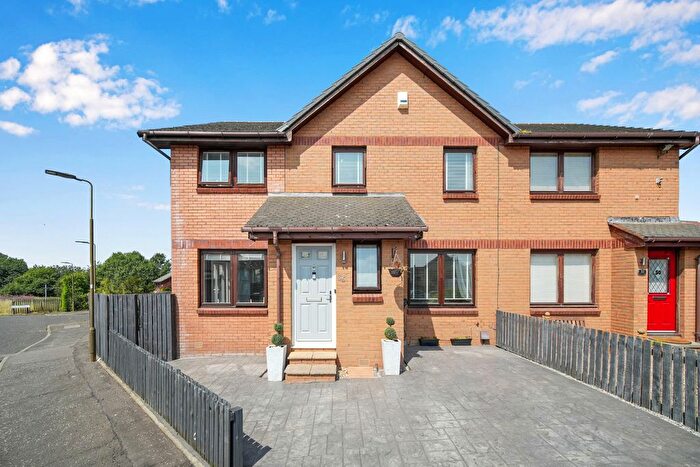
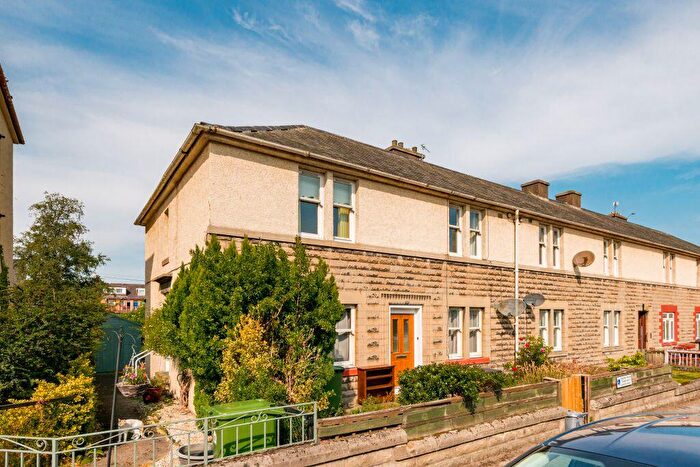
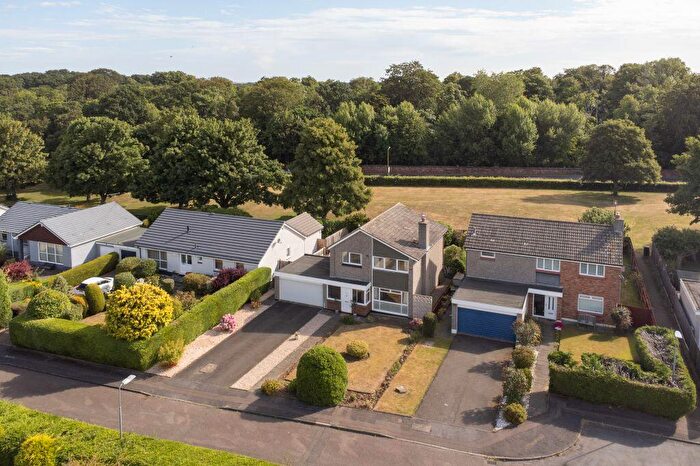
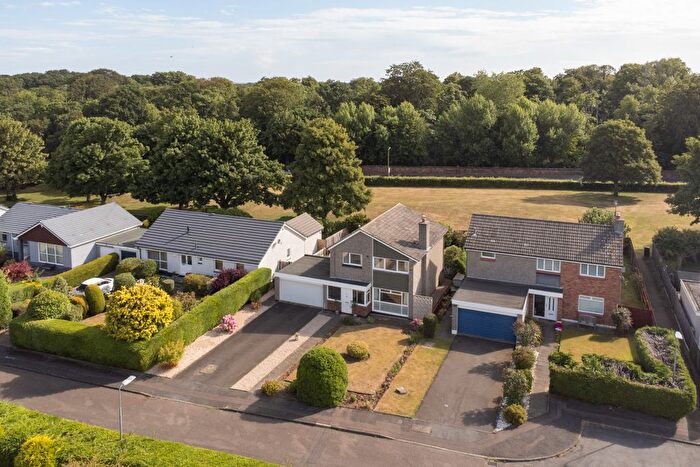
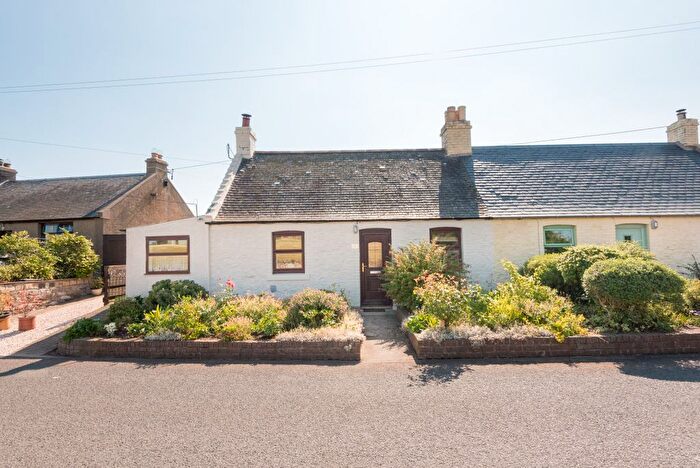
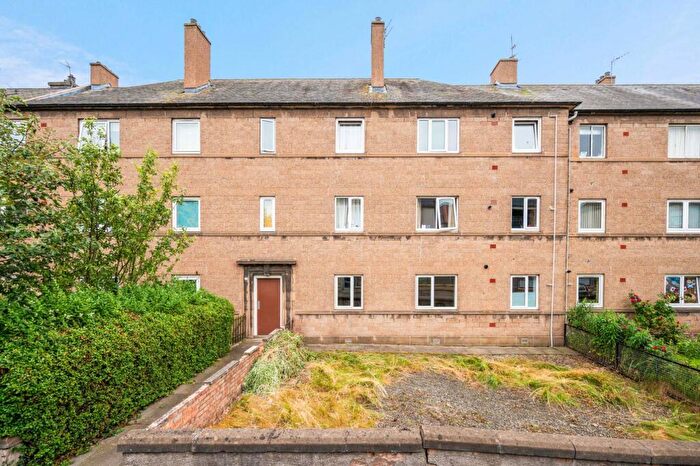
Properties for sale in Scottish Borders
![]()
If you are looking to sell your house, let it out, or receive a property valuation, an expert can help you.
Click the button below to get started.


Towns in Scottish Borders
Navigate through our locations to find the location of your next house in Scottish Borders, Scotland for sale or to rent.
Property price trends in Scottish Borders
According to the latest Registers of Scotland data, the average home in Scottish Borders sold for £209,014 in 2026. That figure comes from a substantial record of 47,661 sales logged over the past 29 years.
Prices have moved up over the last three years. Compared with 2023, when the typical sale came in around £199,161, that's a rise of roughly 4.9%.
Looking back five years, average prices are up about 0.7% since 2021, a gain of around £1,364 in cash terms.
Zoom out to the past decade for the fuller picture. Back in 2016, homes here averaged £173,179, so the typical sold price has climbed about 20.7% since then, roughly 1.9% a year. Stretch the view to fifteen years and that annual pace eases back to about 1.1%.
Frequently asked questions about Scottish Borders
What is the average price for a property for sale in Scottish Borders?
The average price for a property for sale in Scottish Borders is £197,260. This amount is 2% lower than the average price in Scotland. There are more than 10,000 property listings for sale in Scottish Borders.
What locations have the most expensive properties for sale in Scottish Borders?
The locations with the most expensive properties for sale in Scottish Borders are West Linton at an average of £402,331, Heriot at an average of £400,166 and Lauder at an average of £292,957.
What locations have the most affordable properties for sale in Scottish Borders?
The locations with the most affordable properties for sale in Scottish Borders are Canonbie at an average of £109,629, Selkirk at an average of £129,053 and Hawick at an average of £129,342.
Which train stations are available in or near Scottish Borders?
Some of the train stations available in or near Scottish Borders are Tweedbank, Galashiels and Stow.
Property Price Paid in Scottish Borders by Year
The average sold property price by year was:
| Year | Average Sold Price | Price Change |
Sold Properties
|
|---|---|---|---|
| 2026 | £209,014 | 6% |
156 Properties |
| 2025 | £197,215 | 2% |
804 Properties |
| 2024 | £192,416 | -4% |
740 Properties |
| 2023 | £199,161 | -11% |
940 Properties |
| 2022 | £220,446 | 6% |
2,116 Properties |
| 2021 | £207,650 | 6% |
2,440 Properties |
| 2020 | £194,606 | 11% |
1,945 Properties |
| 2019 | £173,977 | -4% |
2,027 Properties |
| 2018 | £181,346 | 1% |
2,245 Properties |
| 2017 | £179,258 | 3% |
2,197 Properties |
Transport in Scottish Borders
Please see below transportation links in this area:
