
Houses for sale & to rent in EH45 9ED, South Parks Industrial Estate, Tweeddale East, Peebles
House Prices in EH45 9ED, South Parks Industrial Estate, Tweeddale East
Properties in EH45 9ED have no sales history available within the last 3 years. EH45 9ED is a postcode in South Parks Industrial Estate located in Tweeddale East, an area in Peebles, Scottish Borders, with 0 household².
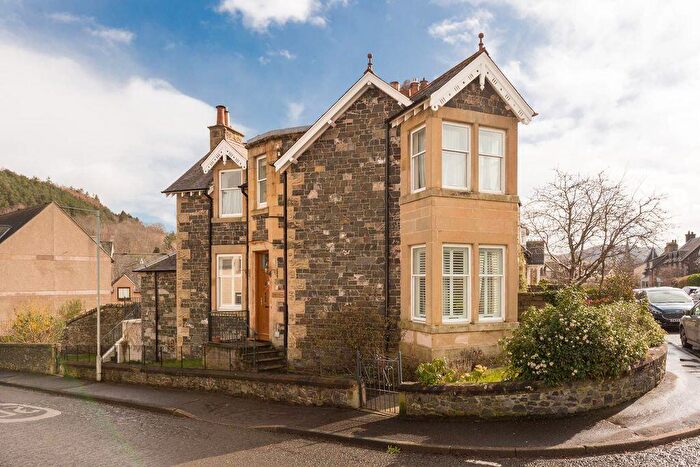
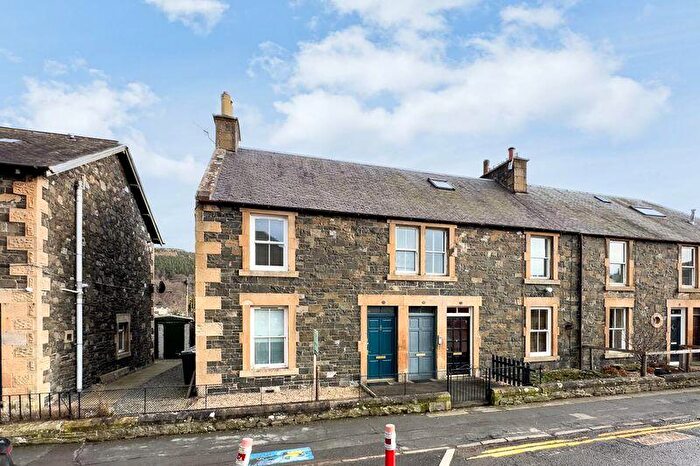
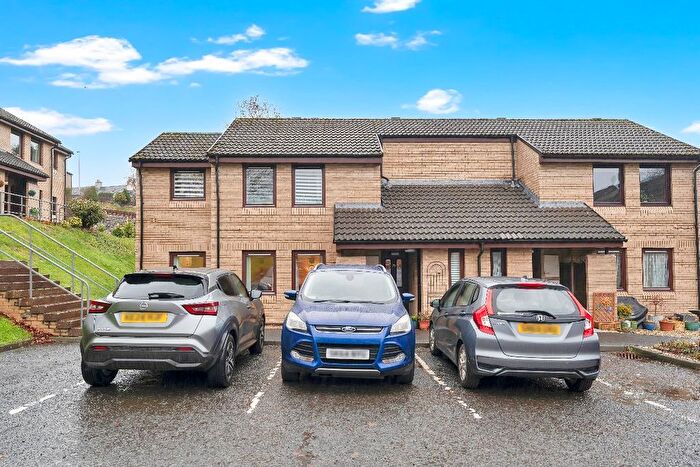
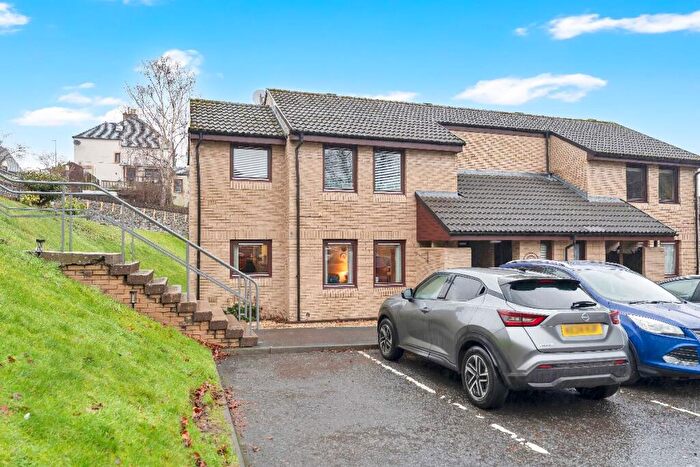
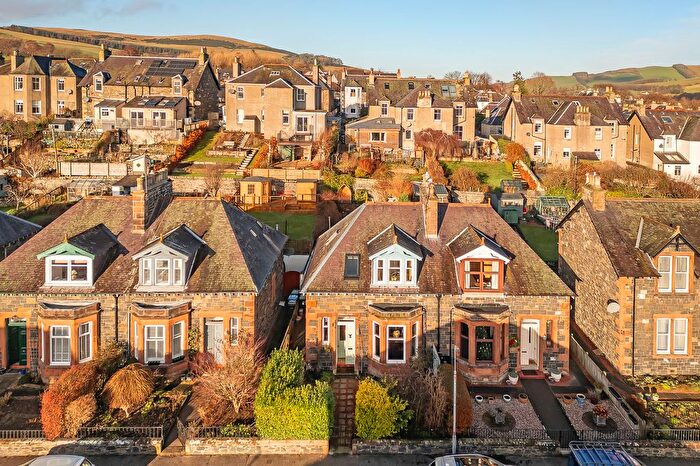
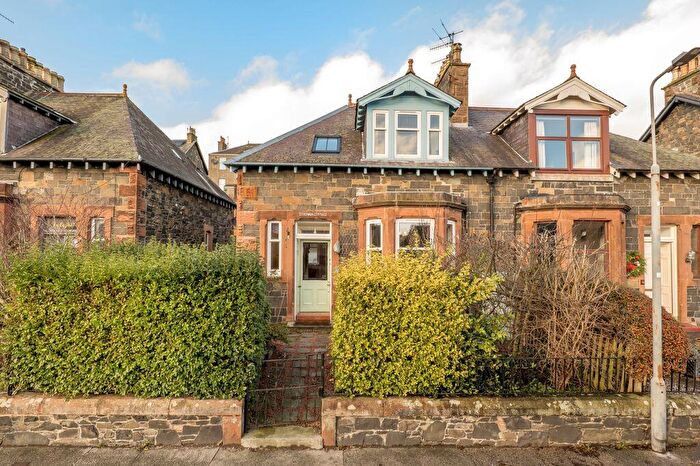
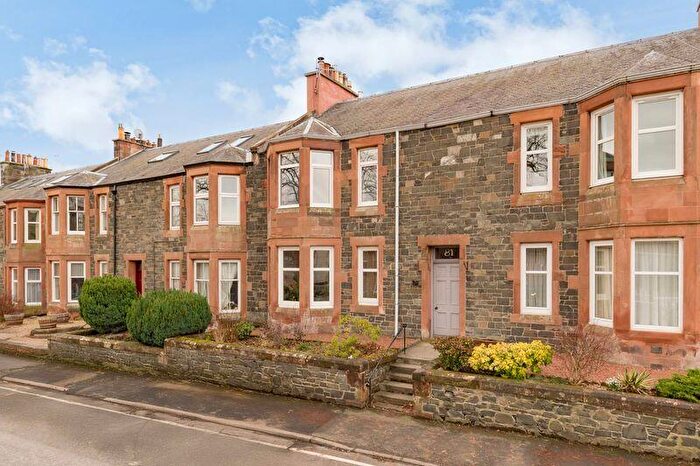
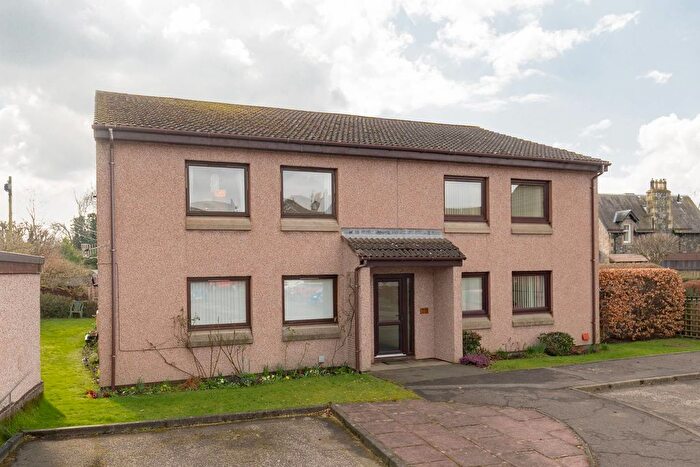
Properties for sale near EH45 9ED, South Parks Industrial Estate

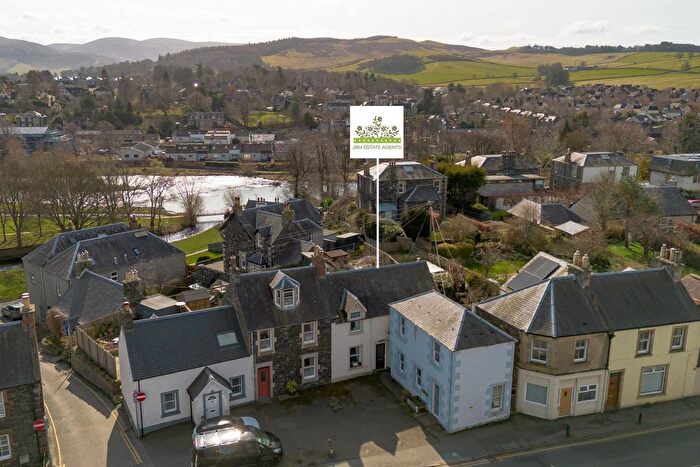
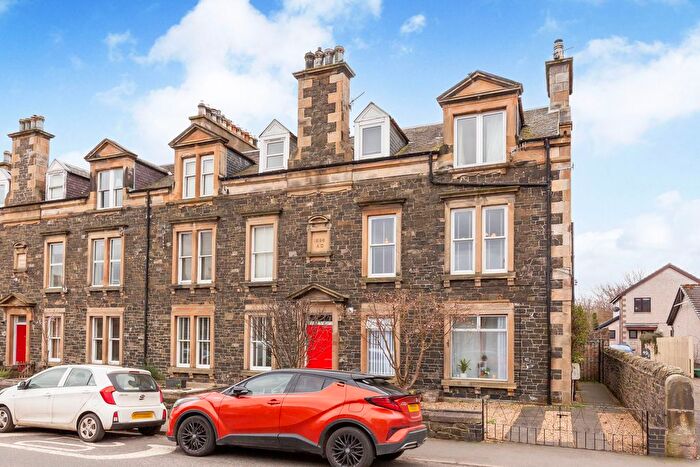
![]()
If you are looking to sell your house, let it out, or receive a property valuation, an expert can help you.
Click the button below to get started.
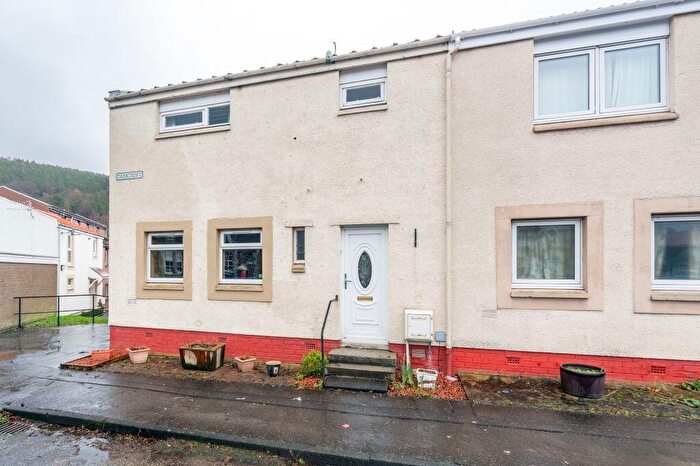
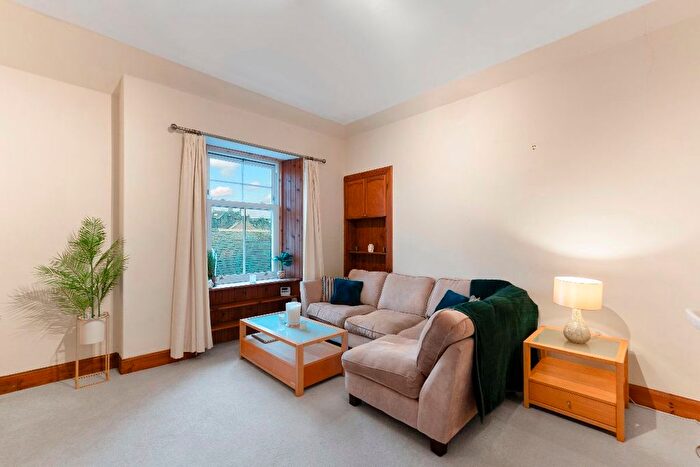
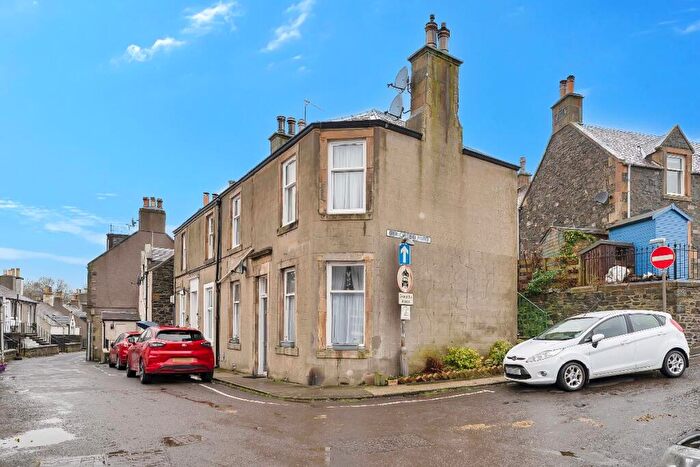
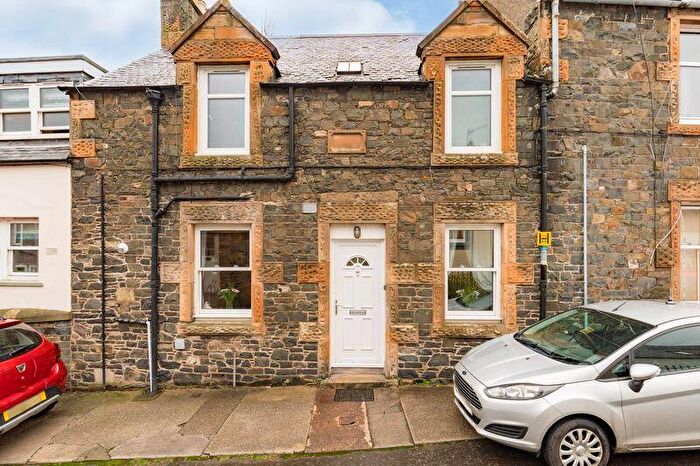
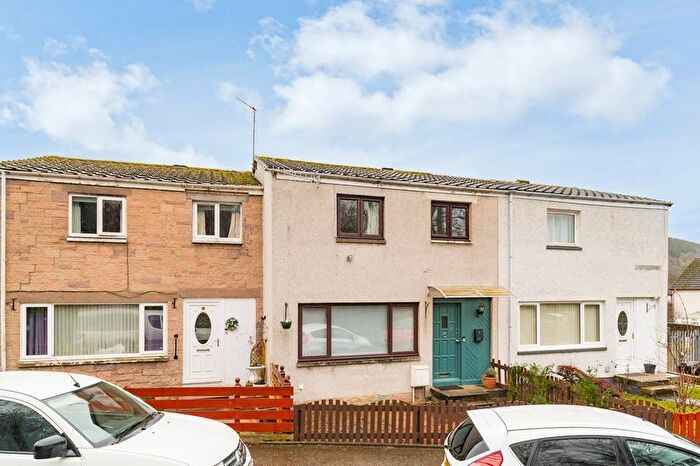

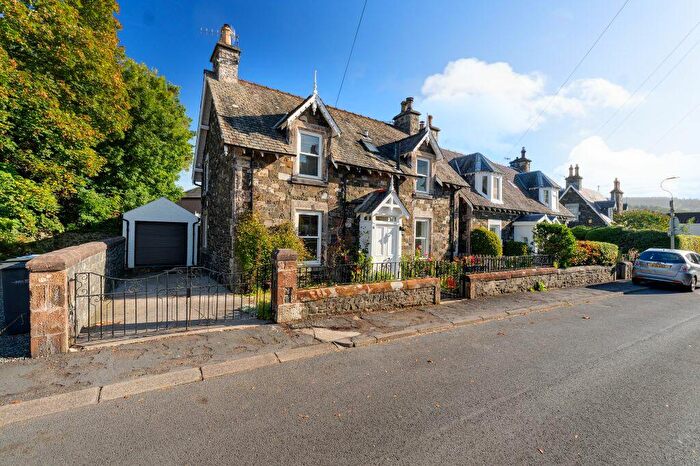
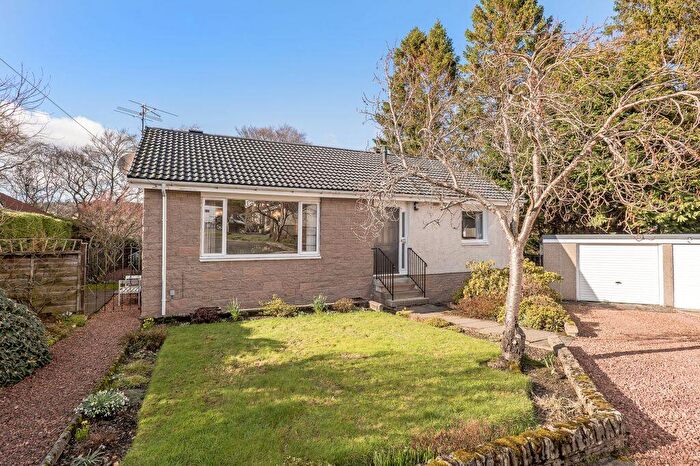
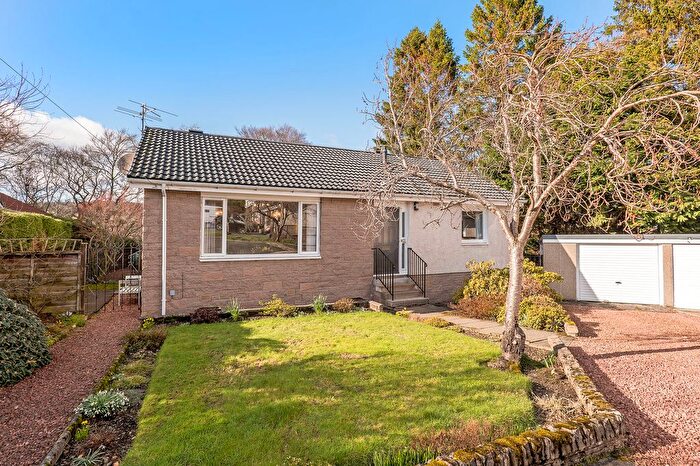
Previously listed properties near EH45 9ED, South Parks Industrial Estate
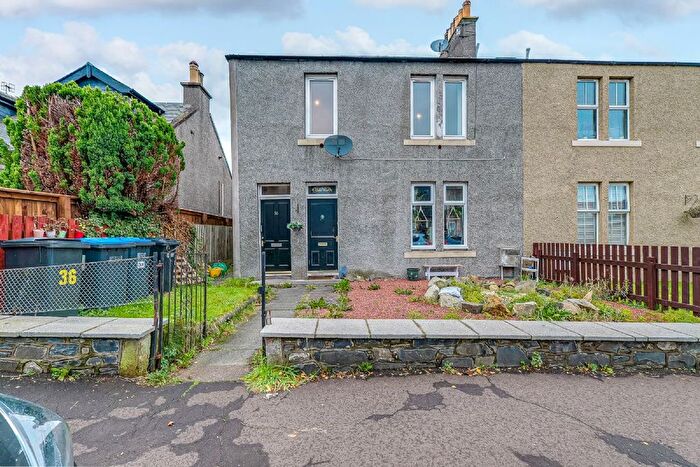
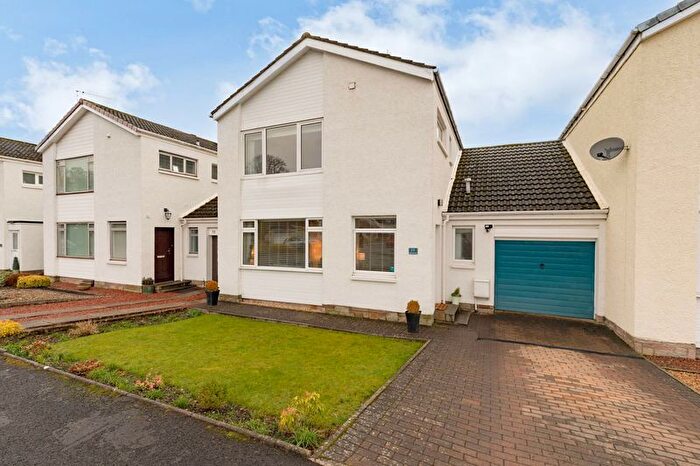
![]()
If you are looking to sell your house, let it out, or receive a property valuation, an expert can help you.
Click the button below to get started.
Price Paid in South Parks Industrial Estate, EH45 9ED, Tweeddale East
Unit 7 South Parks Industrial Estate, EH45 9ED, Tweeddale East Peebles
Property Unit 7 has been sold 1 time. The last time it was sold was in 18/01/2010 and the sold price was £109,250.00.
This is a Property which was sold as an Established Building in 18/01/2010
| Date | Price | Classification |
|---|---|---|
| 18/01/2010 | £109,250.00 | Established Building |
Unit 1 South Parks Industrial Estate, EH45 9ED, Tweeddale East Peebles
Property Unit 1 has been sold 5 times. The last time it was sold was in 14/09/2005 and the sold price was £550,000.00.
This is a Property which was sold as an Established Building in 14/09/2005
| Date | Price | Classification |
|---|---|---|
| 14/09/2005 | £550,000.00 | Established Building |
| 02/12/2004 | £120,000.00 | Established Building |
| 13/07/2004 | £120,000.00 | Established Building |
| 03/01/2003 | £175,000.00 | Established Building |
| 24/07/2002 | £100,000.00 | Established Building |
Transport near EH45 9ED, South Parks Industrial Estate
-
 Stow Station
 -
Gorebridge Station
-
Galashiels Station
-
Newtongrange Station
-
Eskbank Station
-
Tweedbank Station
-
Curriehill Station
-
Carstairs Station
-
Wester Hailes Station
-
Kirknewton Station
House price paid reports for EH45 9ED, South Parks Industrial Estate
Click on the buttons below to see price paid reports by year or property price:
- Price Paid By Year
Property Price Paid in EH45 9ED, South Parks Industrial Estate by Year
The average sold property price by year was:
| Year | Average Sold Price | Price Change |
Sold Properties
|
|---|---|---|---|
| 2010 | £109,250 | -403% |
1 Property |
| 2005 | £550,000 | 78% |
1 Property |
| 2004 | £120,000 | -46% |
2 Properties |
| 2003 | £175,000 | 43% |
1 Property |
| 2002 | £100,000 | - |
1 Property |