
Houses for sale & to rent in West Linton, Scottish Borders
House Prices in West Linton
Properties in West Linton have an average house price of £402k and had 40 Property Transactions within the last 3 years.¹
West Linton is an area in Scottish Borders with 1,200 households², where the most expensive property was sold for £954k.
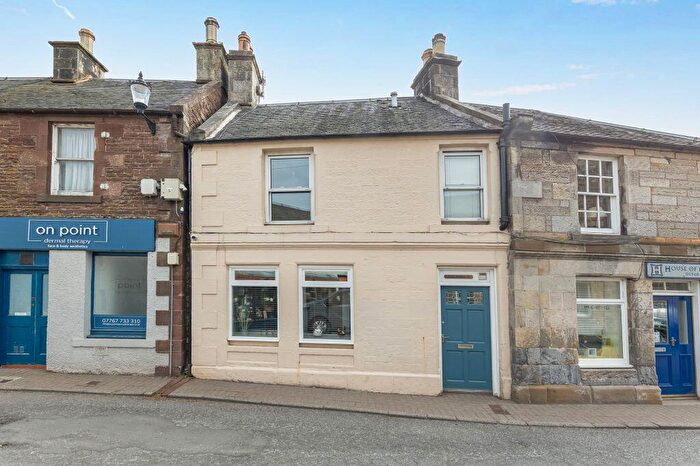
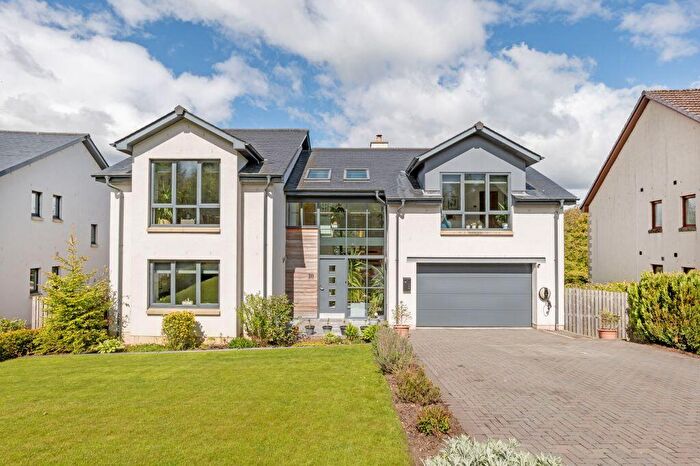
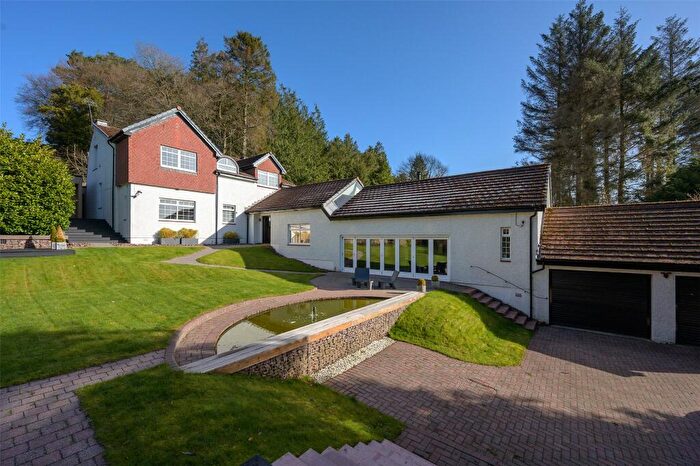
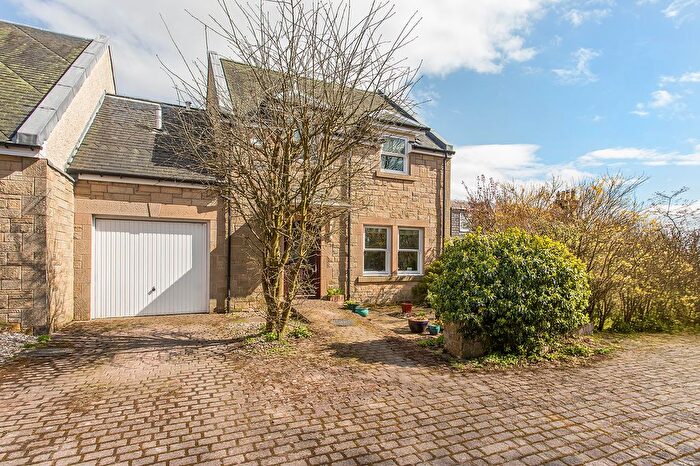
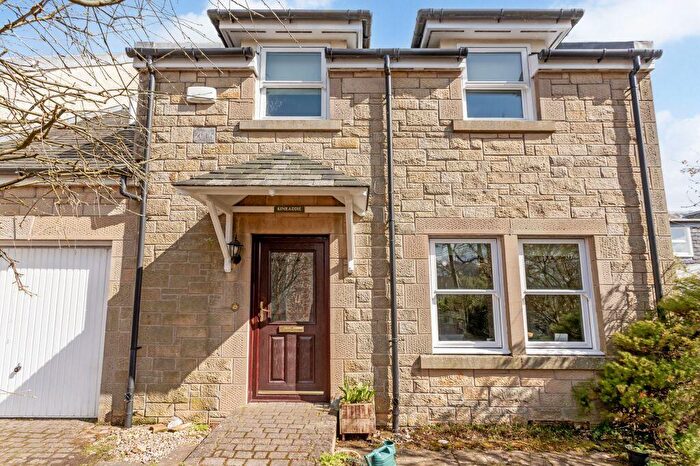
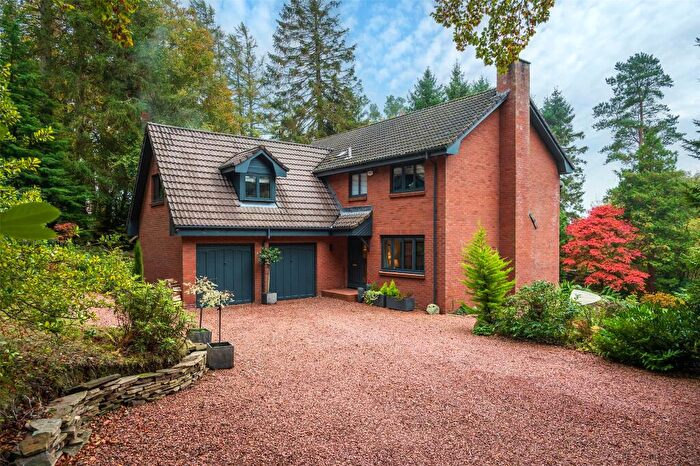
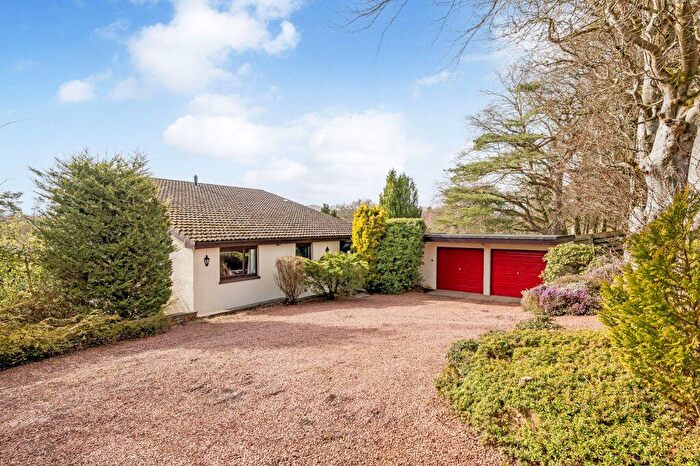
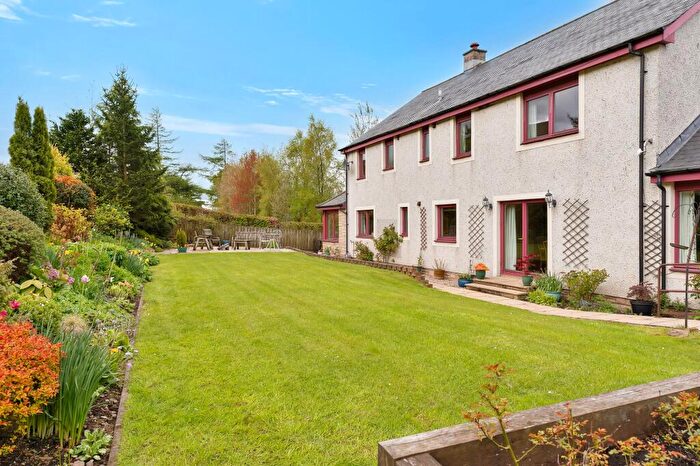
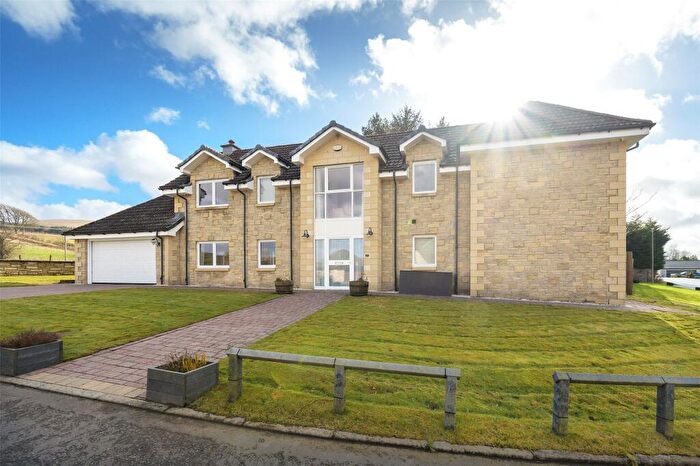
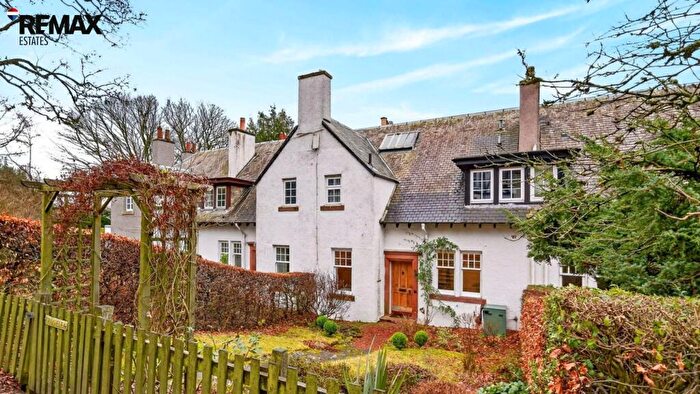
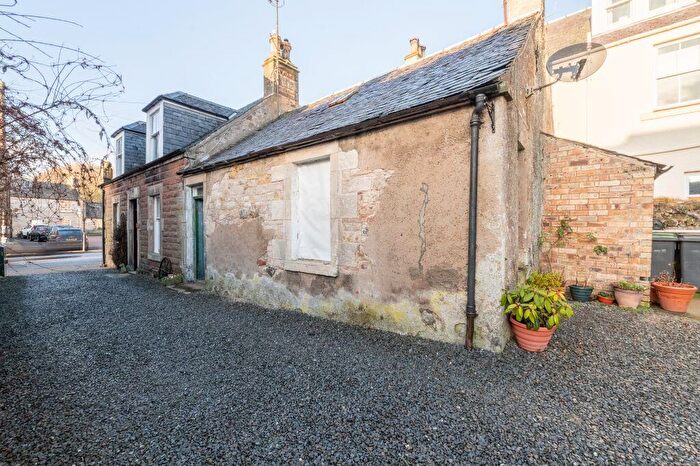
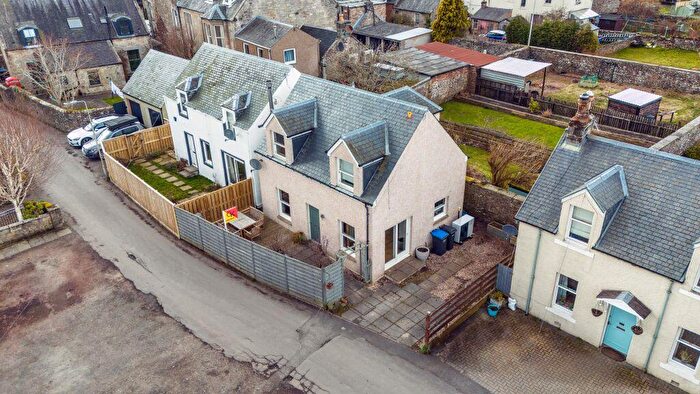
Properties for sale in West Linton
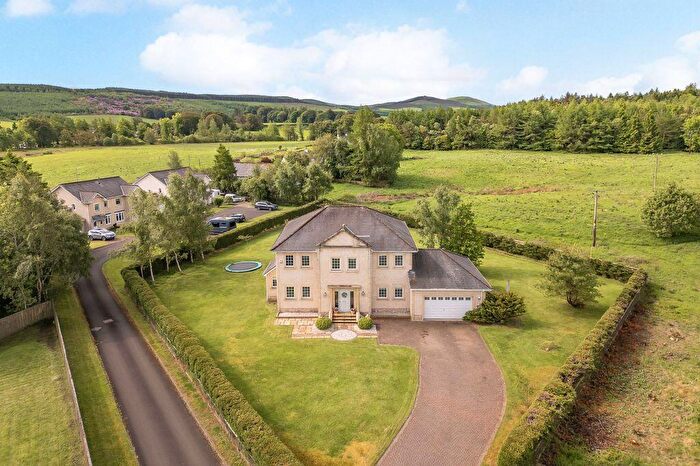

![]()
If you are looking to sell your house, let it out, or receive a property valuation, an expert can help you.
Click the button below to get started.
Neighbourhoods in West Linton
Navigate through our locations to find the location of your next house in West Linton, Scottish Borders for sale or to rent.
Transport in West Linton
Please see below transportation links in this area:
-
 Kirknewton Station
 -
Livingston South Station
-
Curriehill Station
-
West Calder Station
-
Wester Hailes Station
-
Addiewell Station
-
Kingsknowe Station
-
Edinburgh Park Station
-
Carstairs Station
-
Livingston North Station
- FAQ
- Price Paid By Year
Frequently asked questions about West Linton
What is the average price for a property for sale in West Linton?
The average price for a property for sale in West Linton is £402,331. This amount is 104% higher than the average price in Scottish Borders. There are 145 property listings for sale in West Linton.
Which train stations are available in or near West Linton?
Some of the train stations available in or near West Linton are Kirknewton, Livingston South and Curriehill.
Property Price Paid in West Linton by Year
The average sold property price by year was:
| Year | Average Sold Price | Price Change |
Sold Properties
|
|---|---|---|---|
| 2025 | £469,000 | 15% |
10 Properties |
| 2024 | £397,027 | 12% |
19 Properties |
| 2023 | £350,885 | -6% |
11 Properties |
| 2022 | £372,942 | 6% |
42 Properties |
| 2021 | £348,846 | -9% |
75 Properties |
| 2020 | £379,857 | 27% |
50 Properties |
| 2019 | £279,167 | -3% |
45 Properties |
| 2018 | £287,568 | -7% |
55 Properties |
| 2017 | £306,965 | 1% |
88 Properties |
| 2016 | £302,560 | 13% |
64 Properties |
| 2015 | £263,840 | -4% |
69 Properties |
| 2014 | £274,727 | -7% |
34 Properties |
| 2013 | £294,466 | -10% |
42 Properties |
| 2012 | £322,575 | 13% |
48 Properties |
| 2011 | £281,461 | -8% |
31 Properties |
| 2010 | £304,160 | 16% |
41 Properties |
| 2009 | £254,755 | -17% |
29 Properties |
| 2008 | £297,353 | -16% |
37 Properties |
| 2007 | £343,570 | 18% |
64 Properties |
| 2006 | £283,321 | 27% |
52 Properties |
| 2005 | £205,884 | -4% |
57 Properties |
| 2004 | £213,557 | 15% |
51 Properties |
| 2003 | £181,697 | 8% |
76 Properties |
| 2002 | £166,846 | 4% |
72 Properties |
| 2001 | £160,000 | - |
1 Property |