
Houses for sale & to rent in Kyle, Mauchline
House Prices in Kyle
Properties in Kyle have an average house price of £108k and had 51 Property Transactions within the last 3 years¹.
Kyle is an area in Mauchline, South Ayrshire with 935 households², where the most expensive property was sold for £275k.
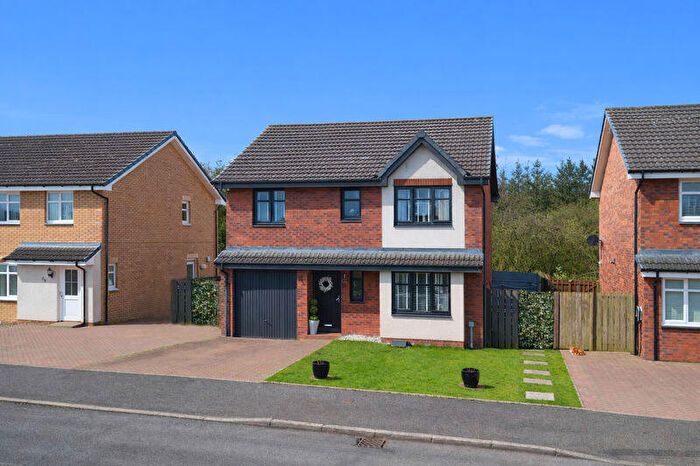
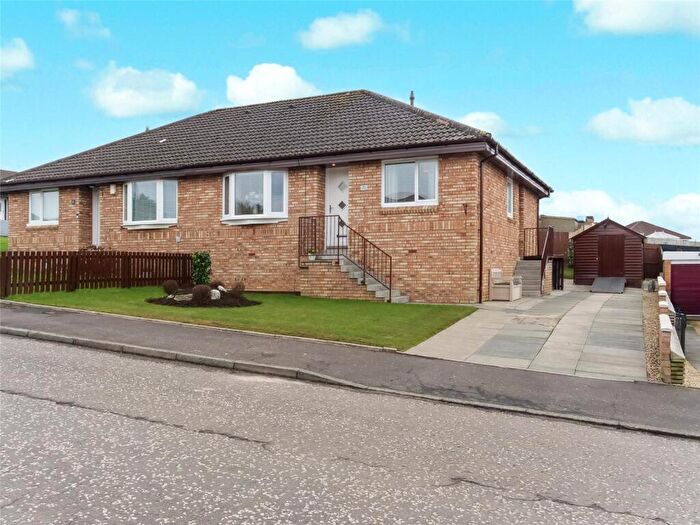
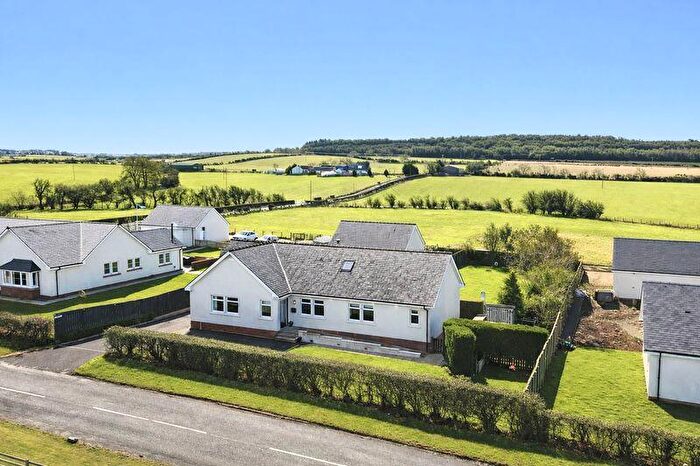
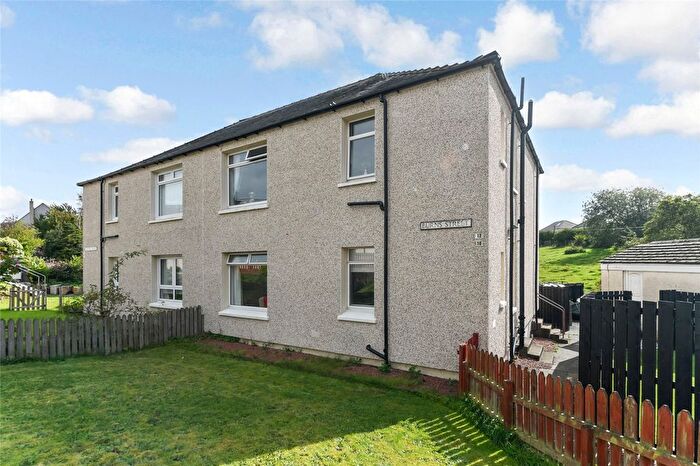
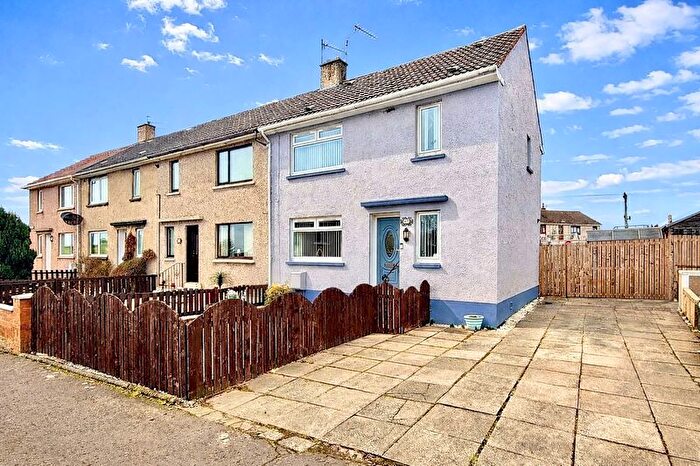
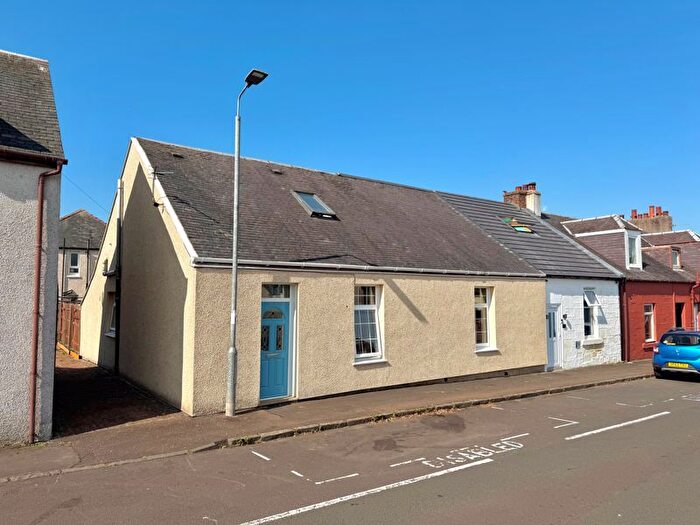
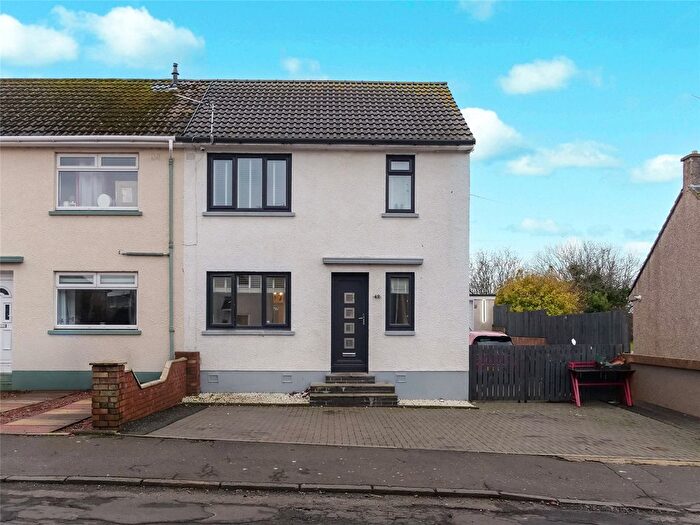
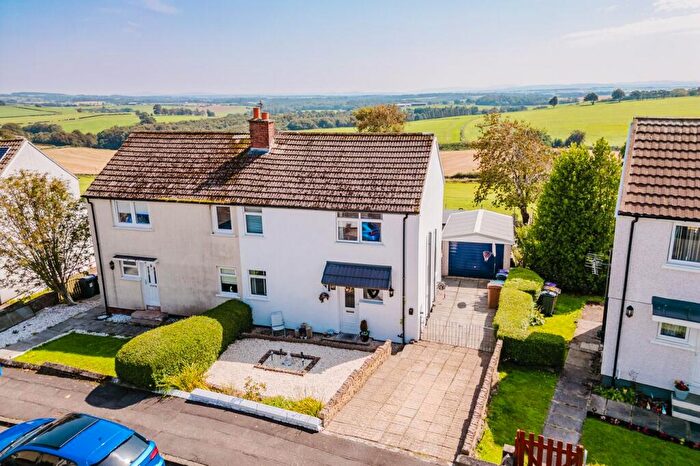
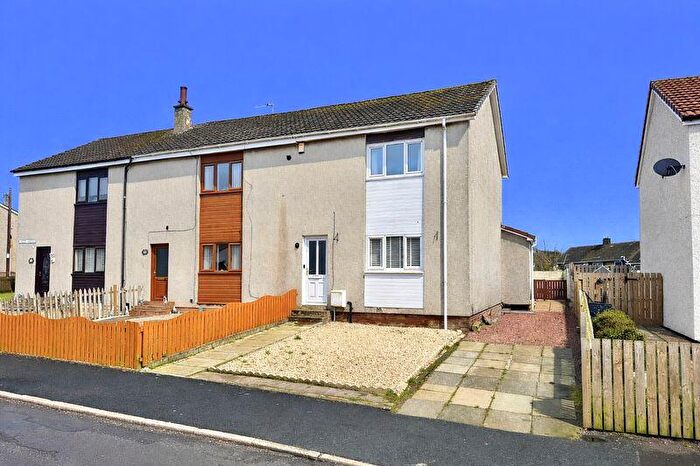
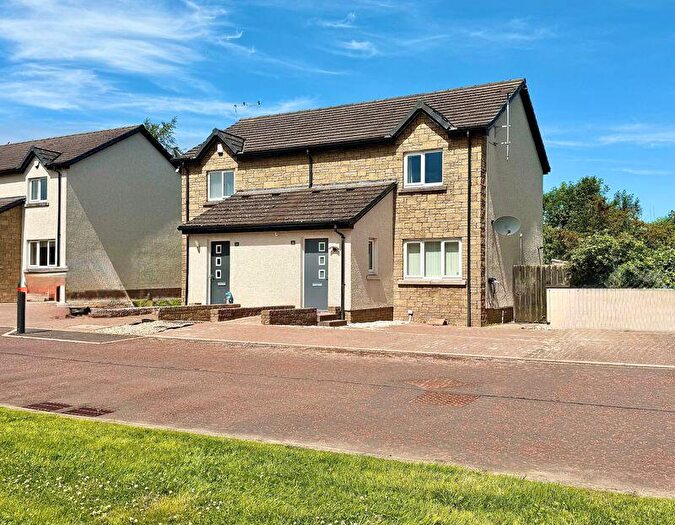
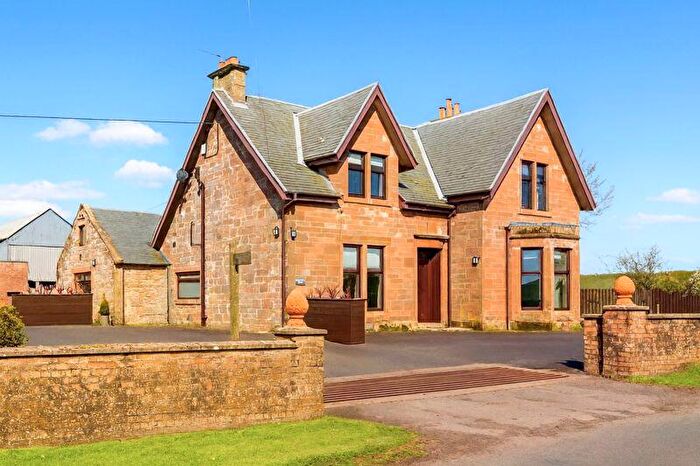
Properties for sale in Kyle
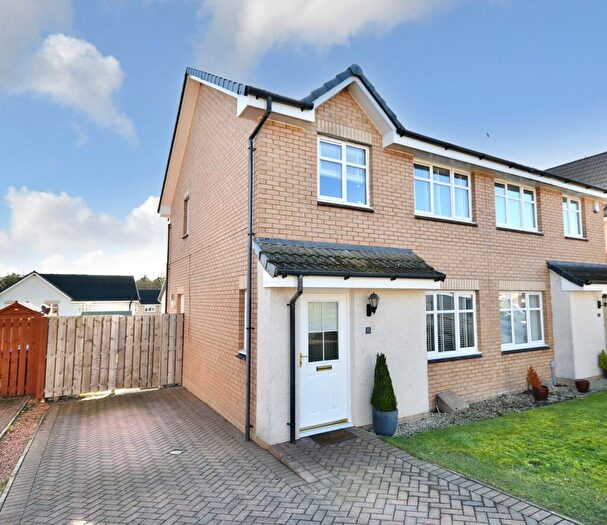
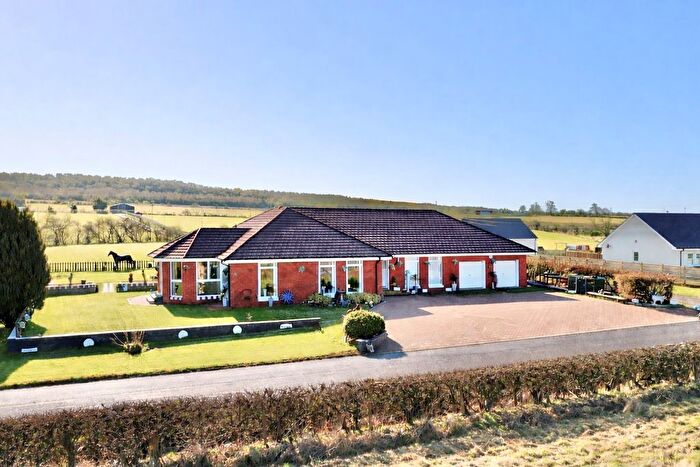
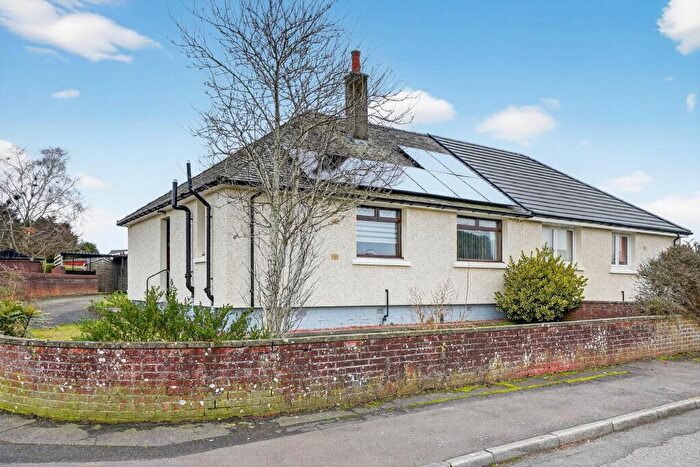
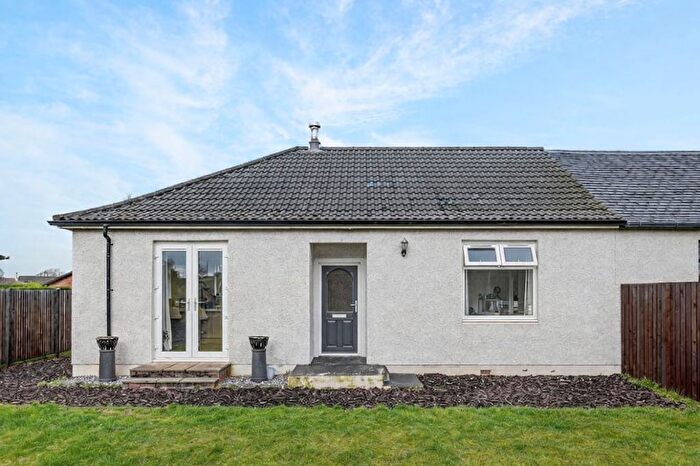
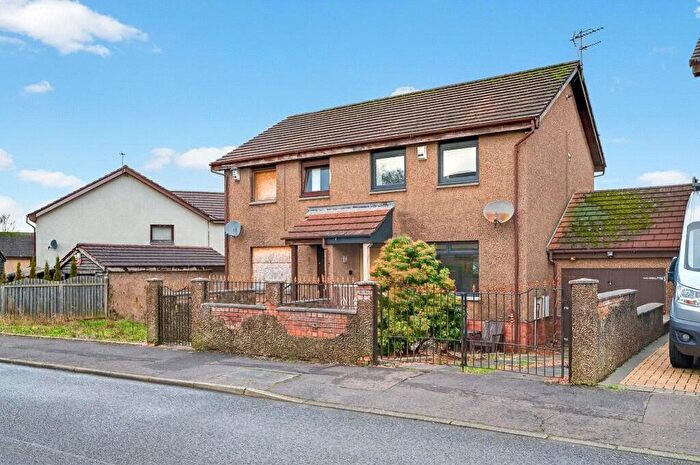
Previously listed properties in Kyle

![]()
If you are looking to sell your house, let it out, or receive a property valuation, an expert can help you.
Click the button below to get started.


Roads and Postcodes in Kyle
Navigate through our locations to find the location of your next house in Kyle, Mauchline for sale or to rent.
Transport near Kyle
-
 Prestwick Internat'nl Airport Station
 -
Prestwick Station
-
Newton-On-Ayr Station
-
Kilmarnock Station
-
Ayr Station
-
Troon Station
-
Barassie Station
-
Auchinleck Station
-
Kilmaurs Station
- FAQ
- Price Paid By Year
Frequently asked questions about Kyle
What is the average price for a property for sale in Kyle?
The average price for a property for sale in Kyle is £108,286. There are 381 property listings for sale in Kyle.
What streets have the most expensive properties for sale in Kyle?
The streets with the most expensive properties for sale in Kyle are Back Street at an average of £195,000, Westport at an average of £187,000 and Red Rose Way at an average of £158,190.
What streets have the most affordable properties for sale in Kyle?
The streets with the most affordable properties for sale in Kyle are Croft Street at an average of £50,165, Smithfield Crescent at an average of £53,333 and James Street at an average of £58,000.
Which train stations are available in or near Kyle?
Some of the train stations available in or near Kyle are Prestwick Internat'nl Airport, Prestwick and Newton-On-Ayr.
Property Price Paid in Kyle by Year
The average sold property price by year was:
| Year | Average Sold Price | Price Change |
Sold Properties
|
|---|---|---|---|
| 2025 | £93,058 | -24% |
11 Properties |
| 2024 | £115,606 | 4% |
14 Properties |
| 2023 | £110,788 | -41% |
26 Properties |
| 2022 | £156,305 | 9% |
26 Properties |
| 2021 | £141,765 | 32% |
24 Properties |
| 2020 | £96,766 | 4% |
26 Properties |
| 2019 | £92,614 | -15% |
28 Properties |
| 2018 | £106,694 | 14% |
27 Properties |
| 2017 | £91,547 | -1% |
38 Properties |
| 2016 | £92,691 | -24% |
35 Properties |
| 2015 | £114,951 | 17% |
41 Properties |
| 2014 | £95,104 | 12% |
36 Properties |
| 2013 | £83,382 | -15% |
17 Properties |
| 2012 | £95,749 | -11% |
31 Properties |
| 2011 | £106,184 | -9% |
38 Properties |
| 2010 | £115,577 | 24% |
48 Properties |
| 2009 | £88,103 | 2% |
14 Properties |
| 2008 | £86,560 | -39% |
31 Properties |
| 2007 | £120,440 | 22% |
37 Properties |
| 2006 | £94,462 | -35% |
40 Properties |
| 2005 | £127,964 | 21% |
29 Properties |
| 2004 | £100,455 | 56% |
36 Properties |
| 2003 | £44,121 | -37% |
47 Properties |
| 2002 | £60,498 | - |
39 Properties |