
Houses for sale in South Ayrshire, Scotland
House Prices in South Ayrshire
Properties in South Ayrshire have
an average house price of
£185k
and had 3,852 Property Transactions
within the last 3 years.¹
South Ayrshire is a location in
Scotland with
51,171 households², where the most expensive property was sold for £3.1M.
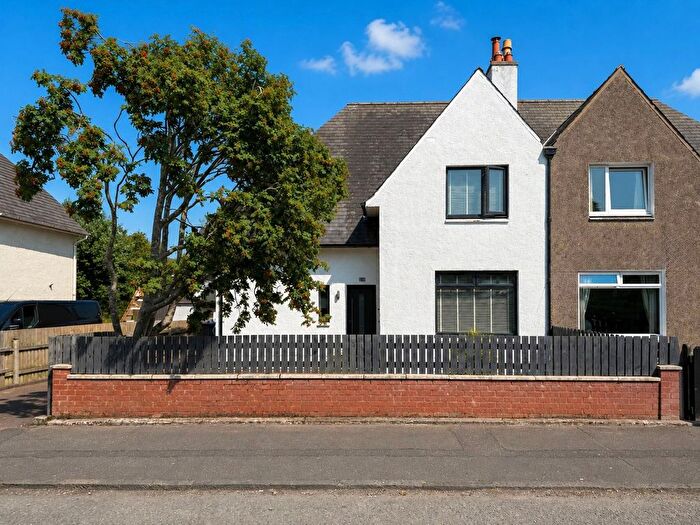
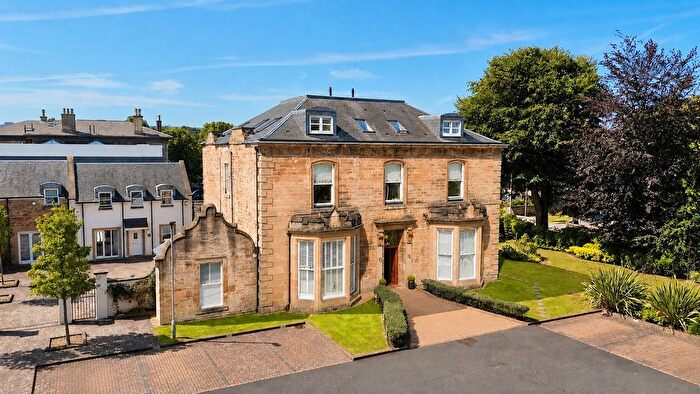
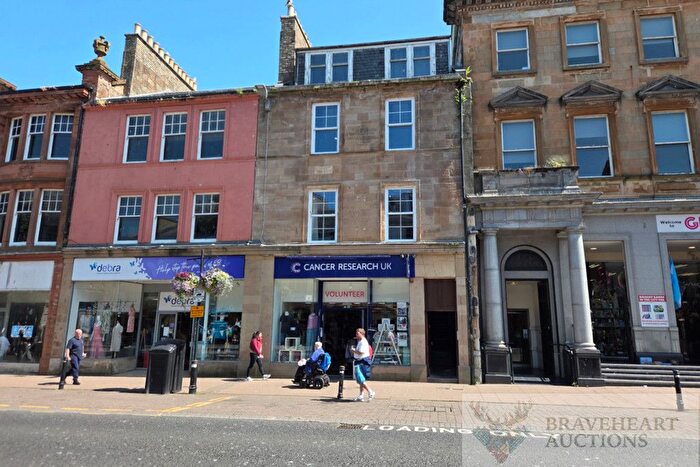
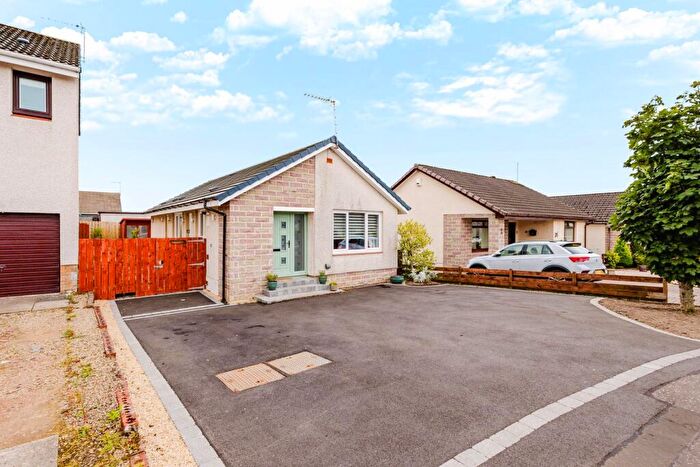
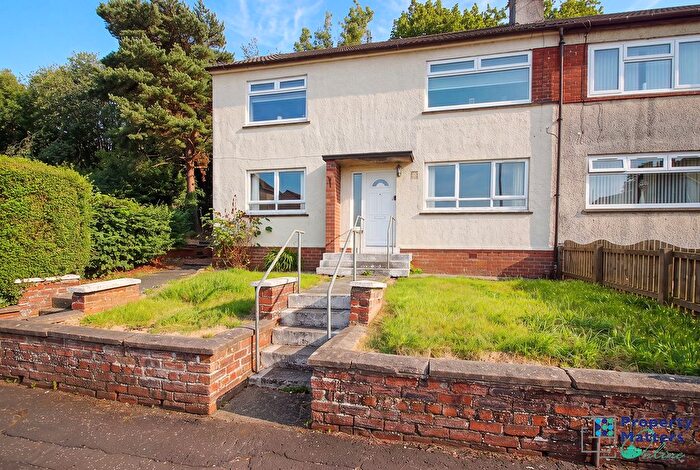
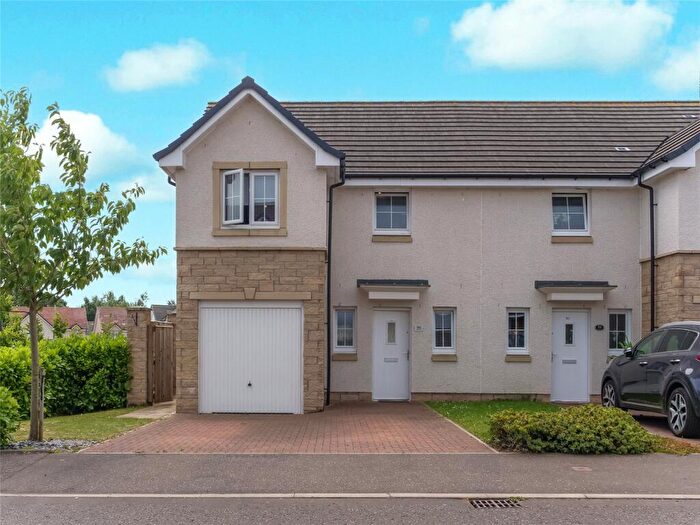
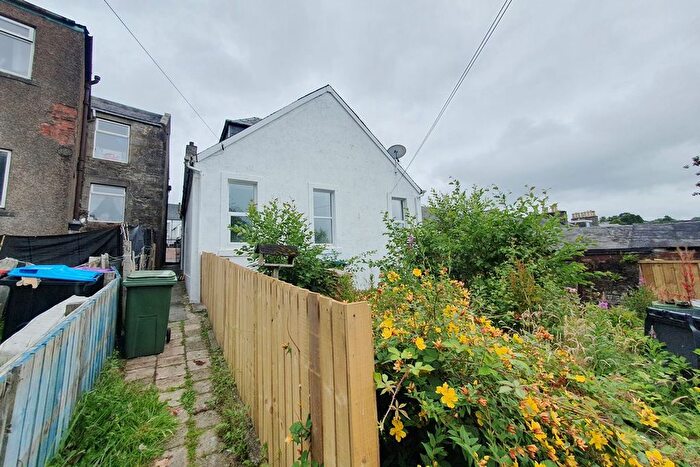
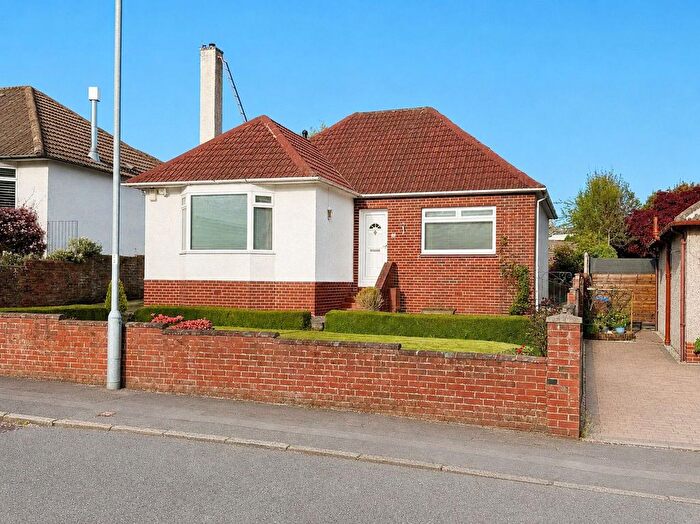
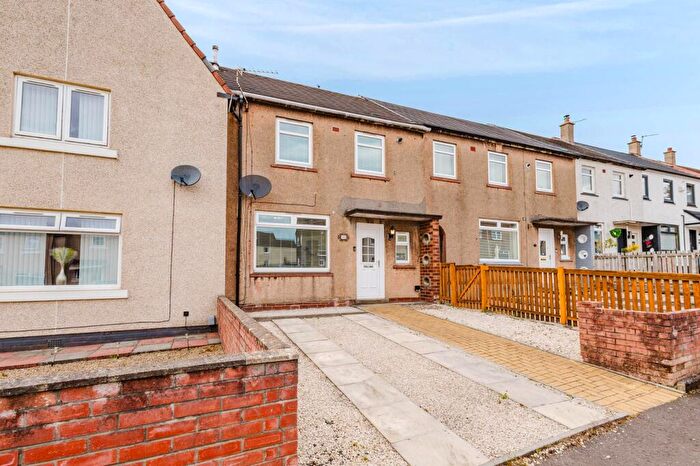
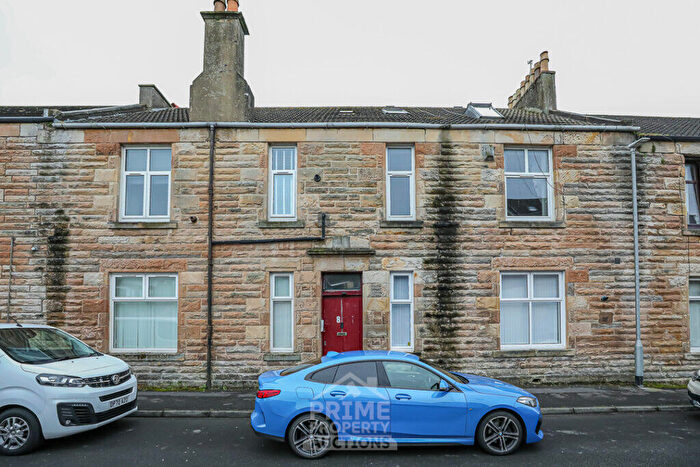
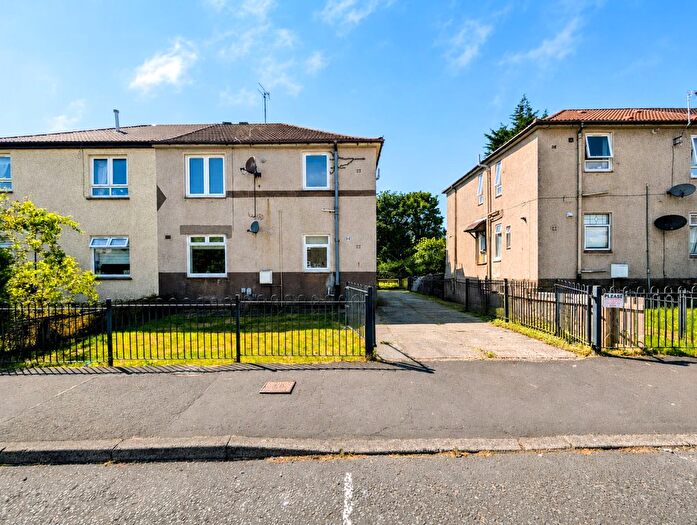
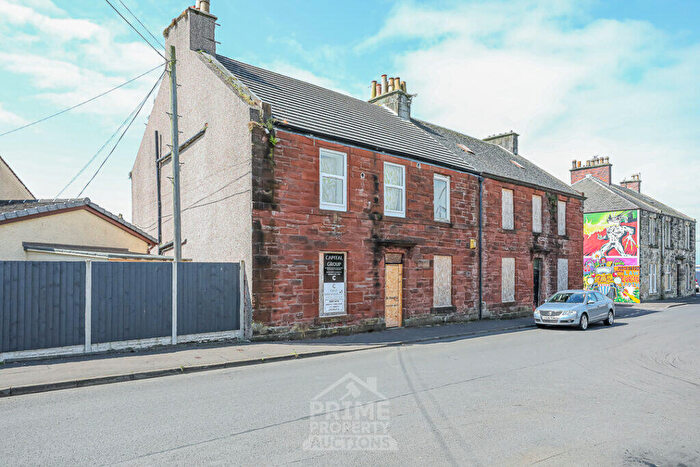
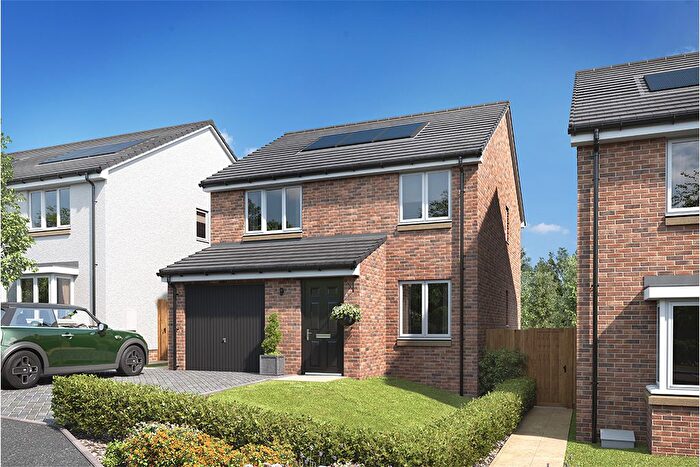
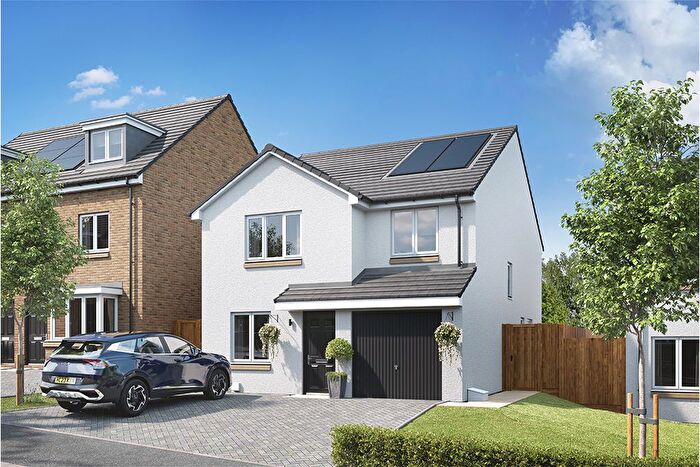
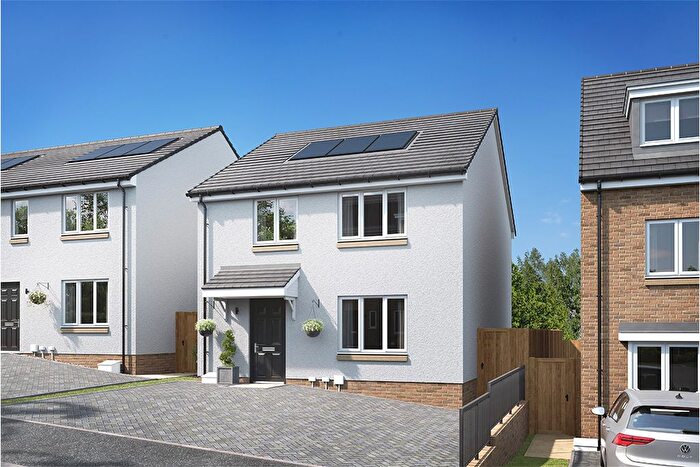
Properties for sale in South Ayrshire
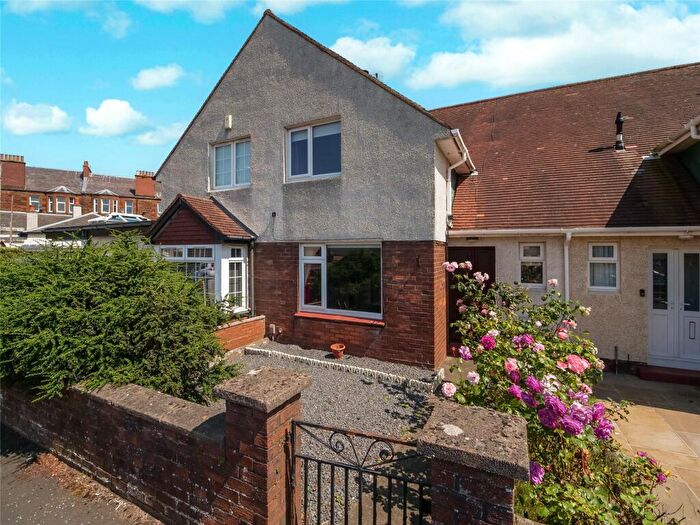
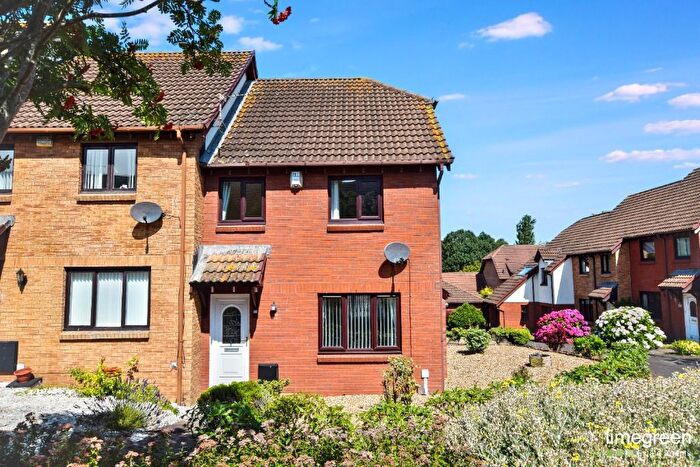
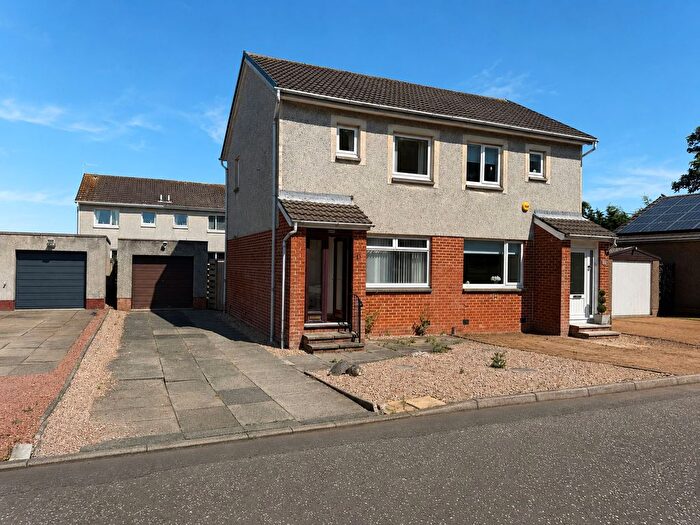
![]()
If you are looking to sell your house, let it out, or receive a property valuation, an expert can help you.
Click the button below to get started.


Towns in South Ayrshire
Navigate through our locations to find the location of your next house in South Ayrshire, Scotland for sale or to rent.
Property price trends in South Ayrshire
According to the latest Registers of Scotland data, the average home in South Ayrshire sold for £171,875 in 2026. That figure comes from a substantial record of 53,776 sales logged over the past 29 years.
Prices have fallen back over the last three years. Compared with 2023, when the typical sale came in around £186,027, that's a fall of roughly 7.6%.
Looking back five years, average prices are down about 7.3% since 2021, a drop of around £13,580 in cash terms.
Zoom out to the past decade for the fuller picture. Back in 2016, homes here averaged £155,121, so the typical sold price has climbed about 10.8% since then, roughly 1% a year. Stretch the view to fifteen years and that annual pace eases back to about 0.8%.
Frequently asked questions about South Ayrshire
What is the average price for a property for sale in South Ayrshire?
The average price for a property for sale in South Ayrshire is £184,648. This amount is 8% lower than the average price in Scotland. There are more than 10,000 property listings for sale in South Ayrshire.
What locations have the most expensive properties for sale in South Ayrshire?
The locations with the most expensive properties for sale in South Ayrshire are Kilmarnock at an average of £229,631, Prestwick at an average of £213,069 and Troon at an average of £201,535.
What locations have the most affordable properties for sale in South Ayrshire?
The locations with the most affordable properties for sale in South Ayrshire are Mauchline at an average of £110,755, Maybole at an average of £131,127 and Girvan at an average of £140,541.
Which train stations are available in or near South Ayrshire?
Some of the train stations available in or near South Ayrshire are Ayr, Newton-On-Ayr and Prestwick.
Property Price Paid in South Ayrshire by Year
The average sold property price by year was:
| Year | Average Sold Price | Price Change |
Sold Properties
|
|---|---|---|---|
| 2026 | £171,875 | -9% |
236 Properties |
| 2025 | £187,691 | 3% |
1,144 Properties |
| 2024 | £182,693 | -2% |
1,163 Properties |
| 2023 | £186,027 | -2% |
1,309 Properties |
| 2022 | £189,921 | 2% |
2,173 Properties |
| 2021 | £185,455 | 3% |
2,410 Properties |
| 2020 | £179,686 | 14% |
1,962 Properties |
| 2019 | £154,708 | -6% |
2,294 Properties |
| 2018 | £164,236 | 5% |
2,298 Properties |
| 2017 | £155,297 | 0,1% |
2,325 Properties |
Transport in South Ayrshire
Please see below transportation links in this area:
