
Houses for sale & to rent in ML11 7QU, Clydesdale North, Lanark
House Prices in ML11 7QU, Clydesdale North
Properties in ML11 7QU have an average house price of £55,000.00 and had 1 Property Transaction within the last 3 years.¹ ML11 7QU is a postcode in Clydesdale North, an area in Lanark, South Lanarkshire, with 15 households², where the most expensive property was sold for £55,000.00.
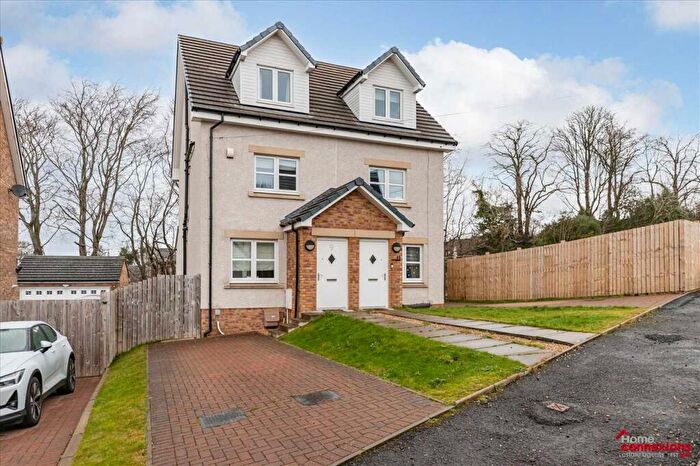
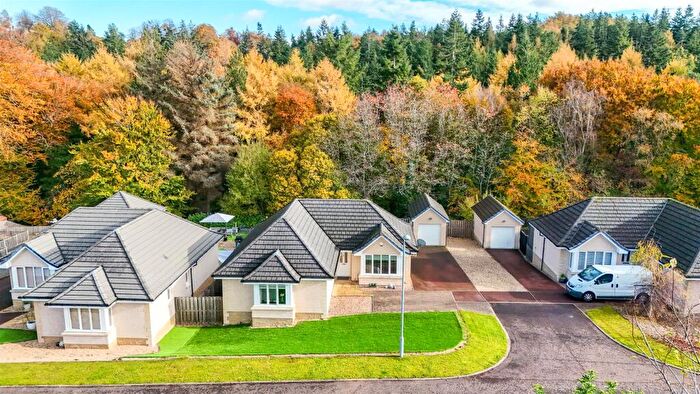
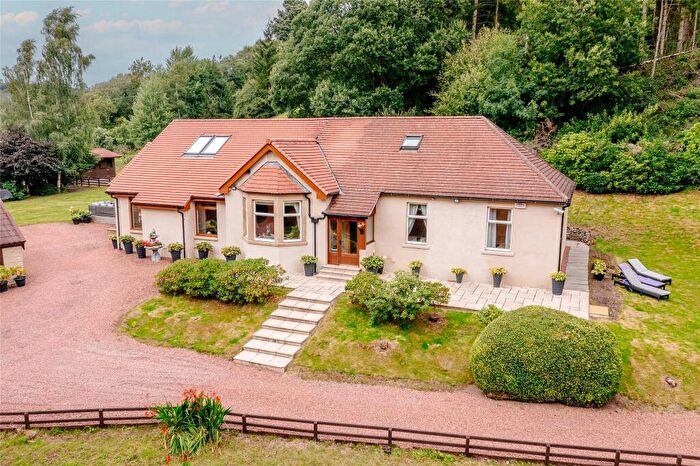
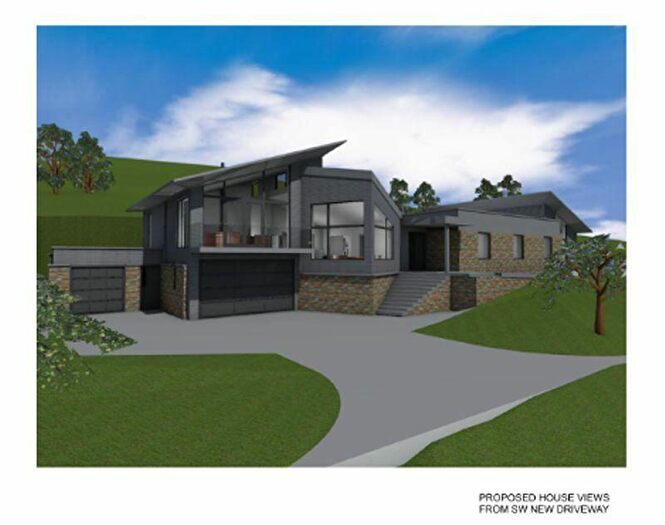
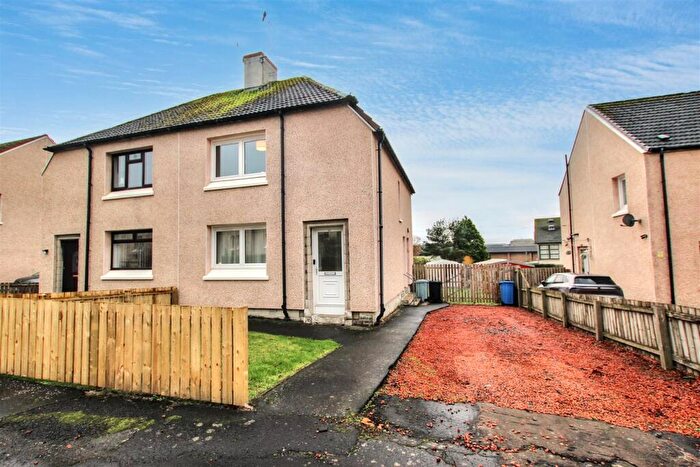
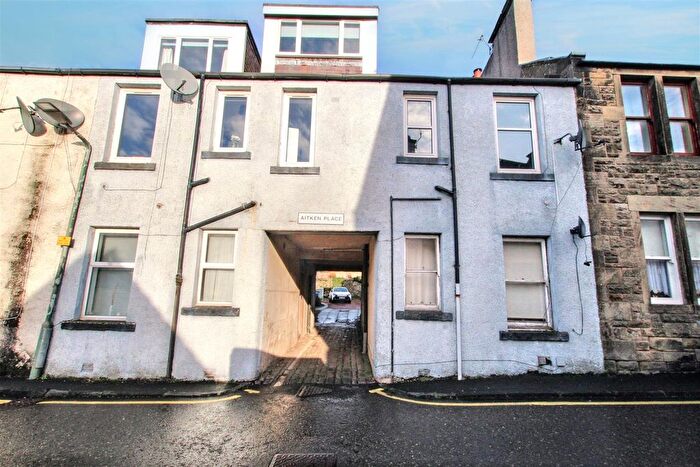
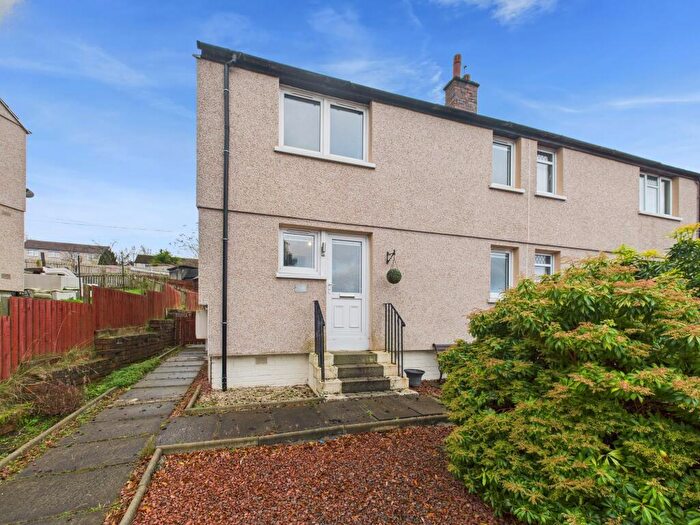
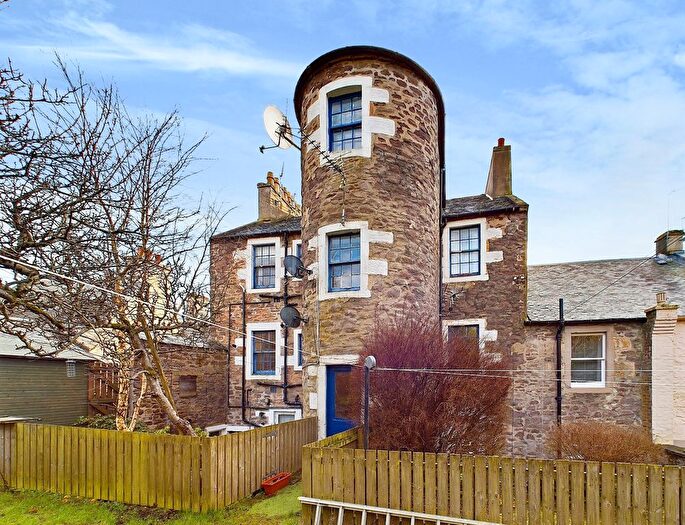
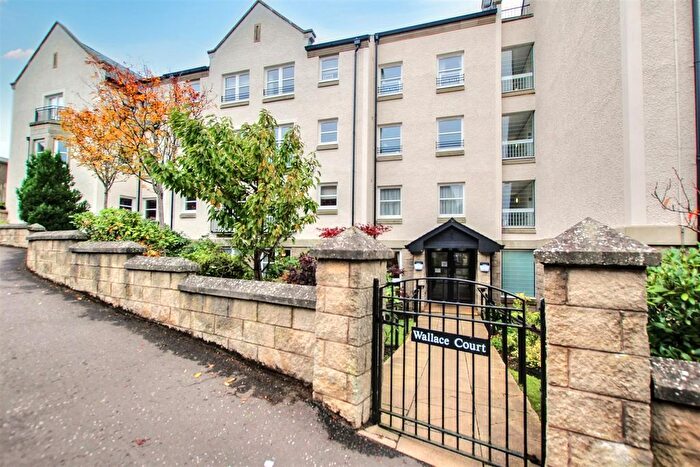
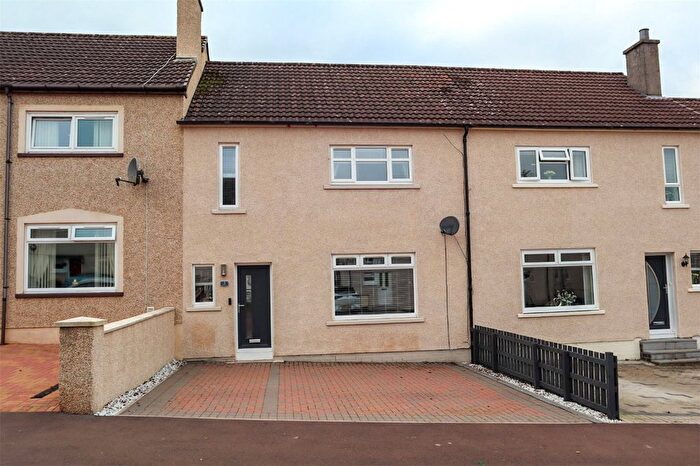
Properties for sale near ML11 7QU


![]()
If you are looking to sell your house, let it out, or receive a property valuation, an expert can help you.
Click the button below to get started.

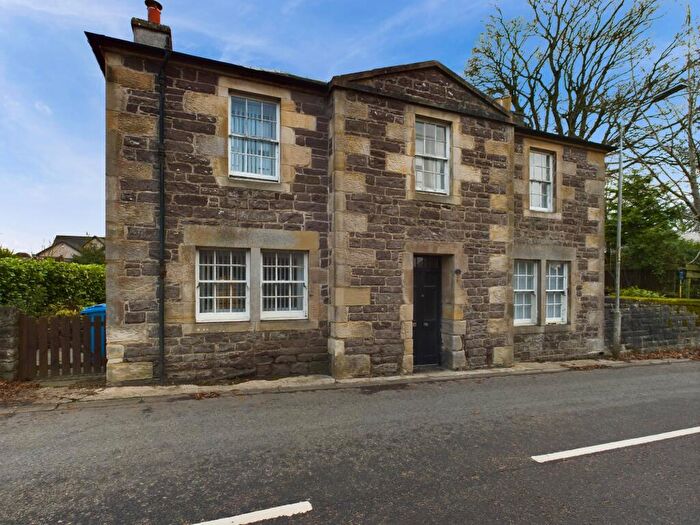
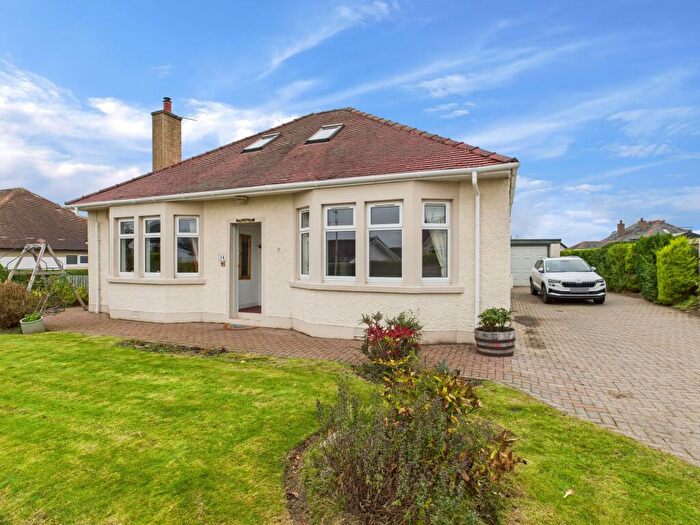
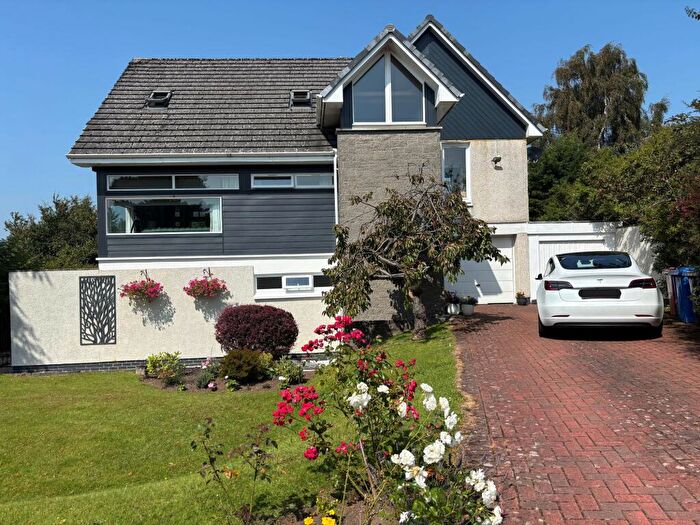
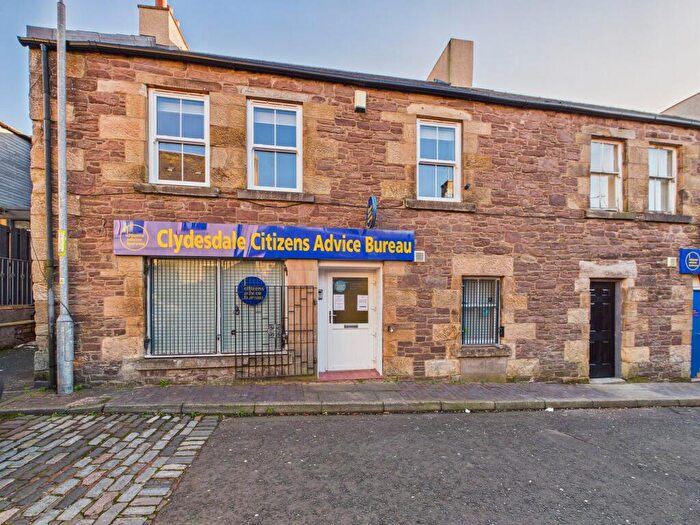
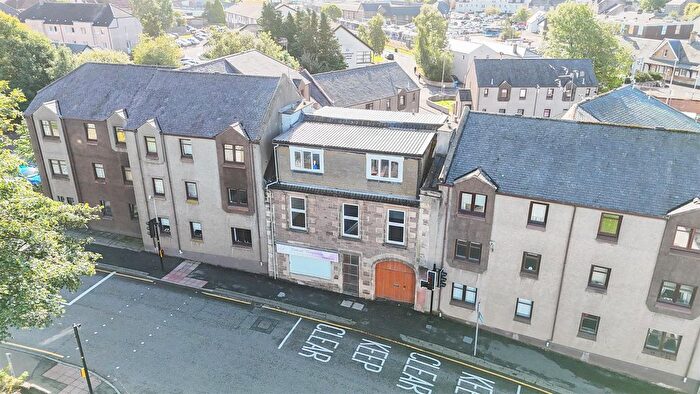
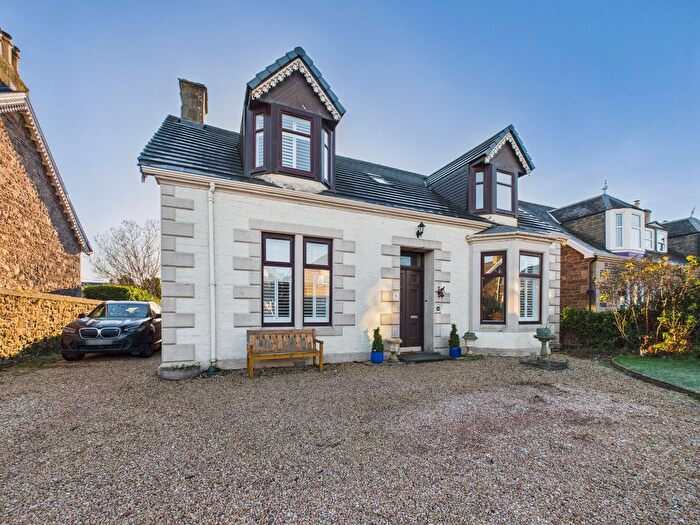
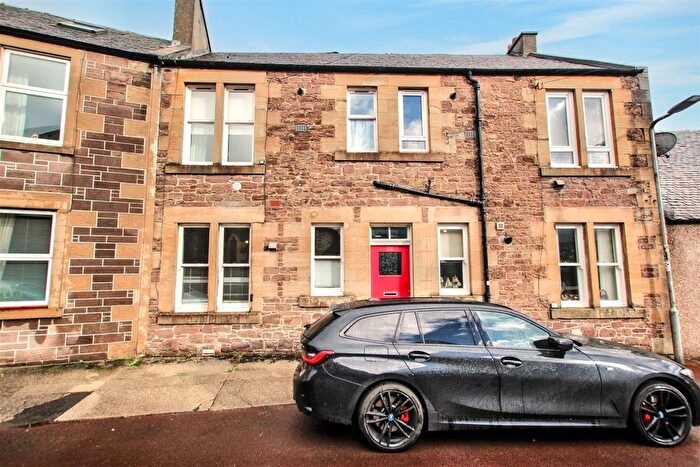
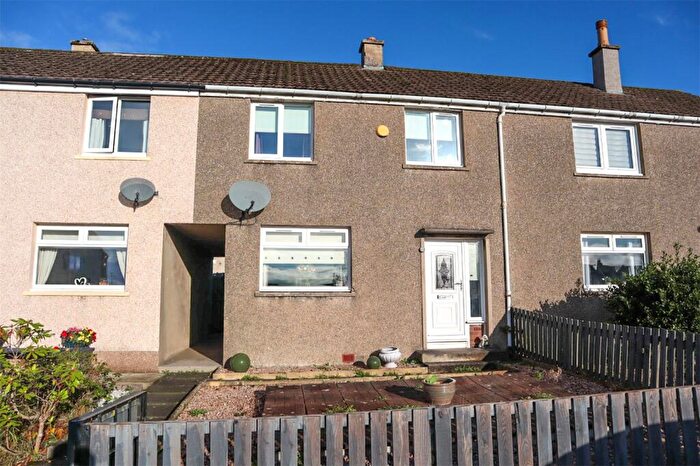
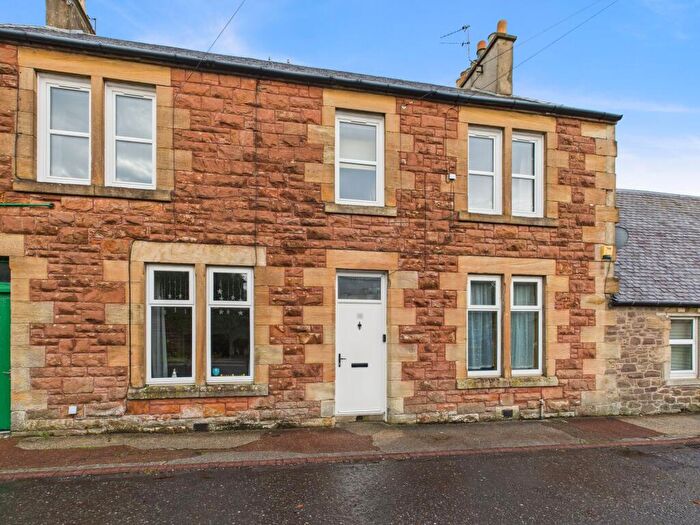
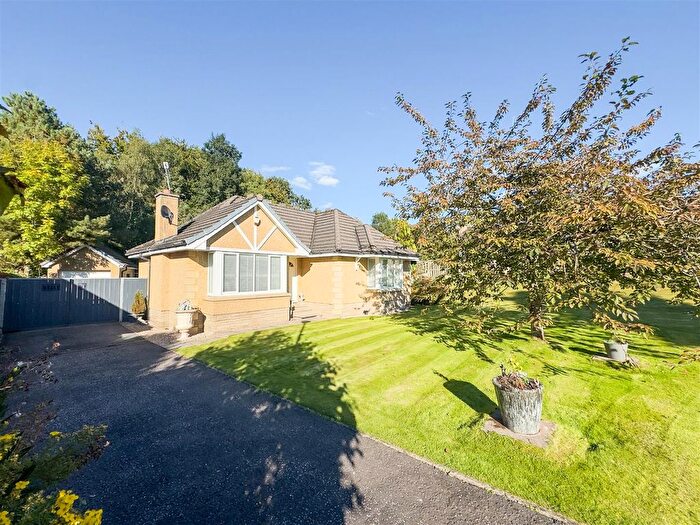
Previously listed properties near ML11 7QU
![]()
If you are looking to sell your house, let it out, or receive a property valuation, an expert can help you.
Click the button below to get started.
Price Paid in ML11 7QU, Clydesdale North
16 Greystone Bauks ML11 7QU, Clydesdale North Lanark
Property 16 Greystone Bauks has been sold 2 times. The last time it was sold was in 09/02/2023 and the sold price was £55,000.00.
This is a Property which was sold as an Established Building in 09/02/2023
| Date | Price | Classification |
|---|---|---|
| 09/02/2023 | £55,000.00 | Established Building |
| 11/09/2019 | £49,306.00 | Established Building |
12 Greystone Bauks ML11 7QU, Clydesdale North Lanark
Property 12 Greystone Bauks has been sold 2 times. The last time it was sold was in 21/12/2021 and the sold price was £49,000.00.
This is a Property which was sold as an Established Building in 21/12/2021
| Date | Price | Classification |
|---|---|---|
| 21/12/2021 | £49,000.00 | Established Building |
| 25/05/2016 | £22,940.00 | Established Building |
15 Greystone Bauks ML11 7QU, Clydesdale North Lanark
Property 15 Greystone Bauks has been sold 1 time. The last time it was sold was in 01/12/2020 and the sold price was £50,000.00.
This is a Property which was sold as an Established Building in 01/12/2020
| Date | Price | Classification |
|---|---|---|
| 01/12/2020 | £50,000.00 | Established Building |
4 Greystone Bauks ML11 7QU, Clydesdale North Lanark
Property 4 Greystone Bauks has been sold 1 time. The last time it was sold was in 26/06/2006 and the sold price was £56,000.00.
This is a Property which was sold as an Established Building in 26/06/2006
| Date | Price | Classification |
|---|---|---|
| 26/06/2006 | £56,000.00 | Established Building |
Transport near ML11 7QU

House price paid reports for ML11 7QU
Click on the buttons below to see price paid reports by year or property price:
- Price Paid By Year
Property Price Paid in ML11 7QU by Year
The average sold property price by year was:
| Year | Average Sold Price | Price Change |
Sold Properties
|
|---|---|---|---|
| 2023 | £55,000 | 11% |
1 Property |
| 2021 | £49,000 | -2% |
1 Property |
| 2020 | £50,000 | 1% |
1 Property |
| 2019 | £49,306 | 53% |
1 Property |
| 2016 | £22,940 | -144% |
1 Property |
| 2006 | £56,000 | - |
1 Property |