
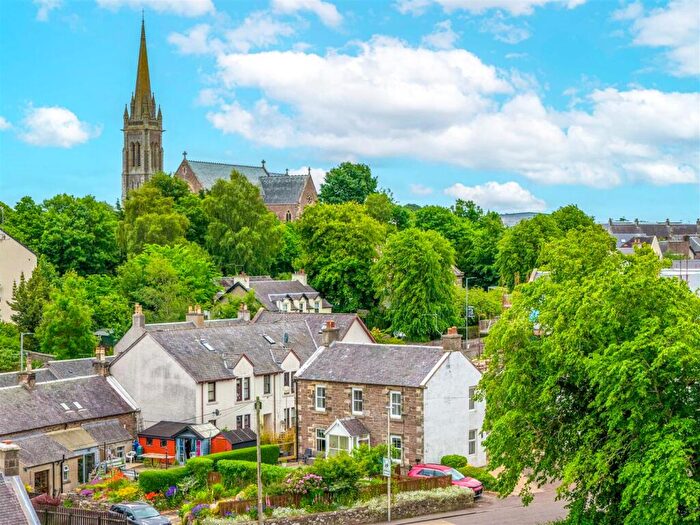
Houses for sale in Lanark, South Lanarkshire
House Prices in Lanark
Properties in Lanark have an average house price of £169k and had 850 Property Transactions within the last 3 years.¹
Lanark is an area in South Lanarkshire with 15,262 households², where the most expensive property was sold for £1.01M.
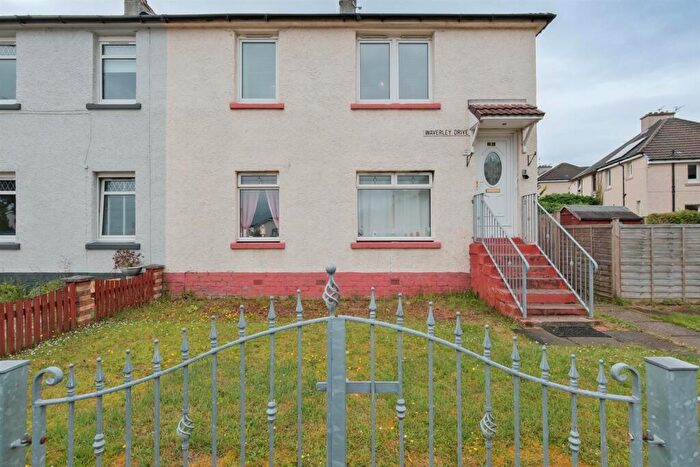
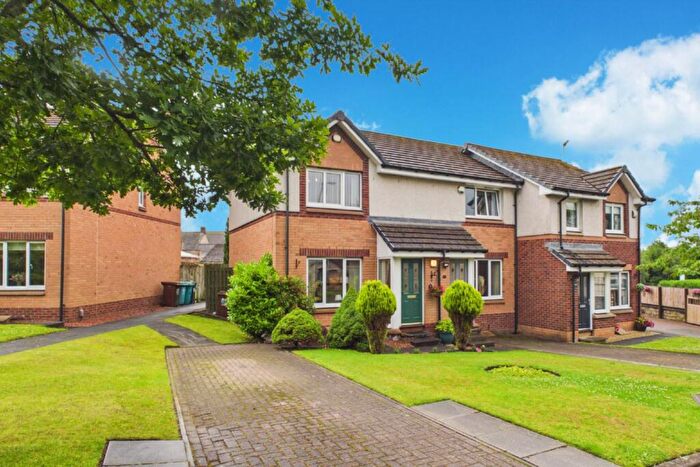
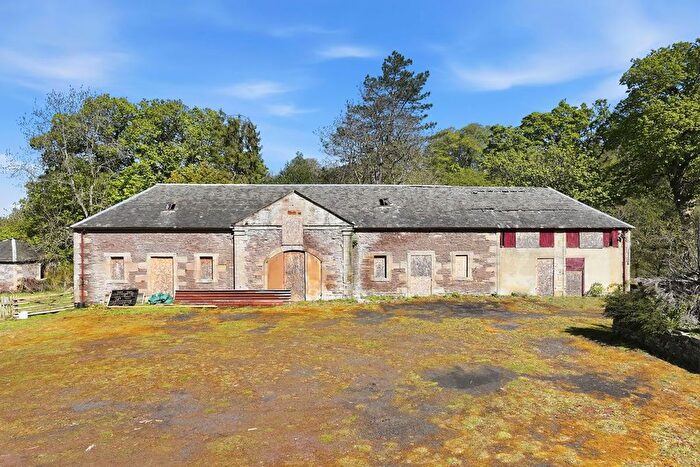
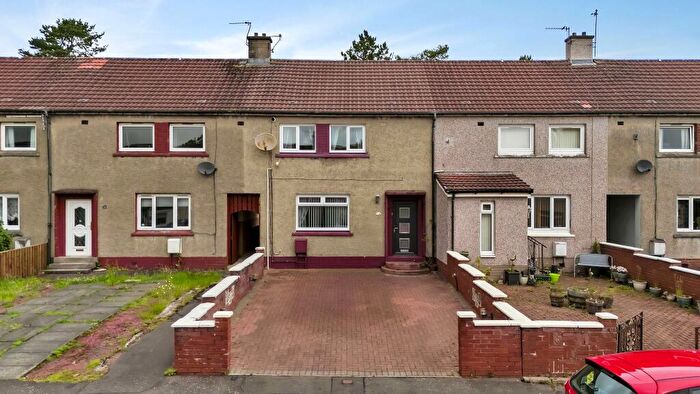
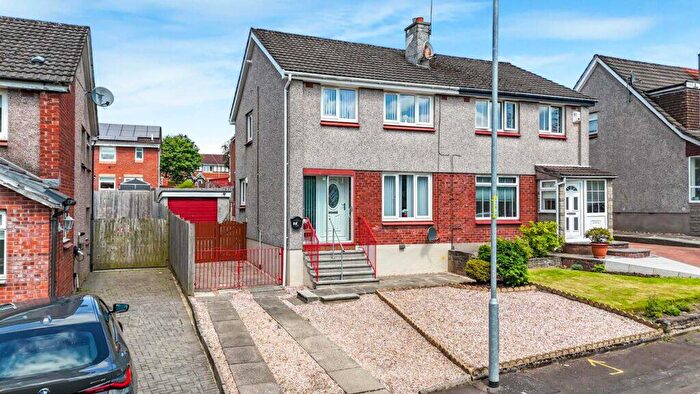
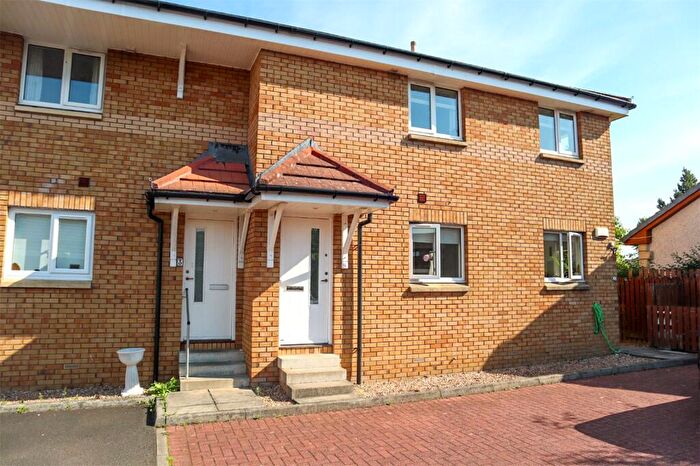
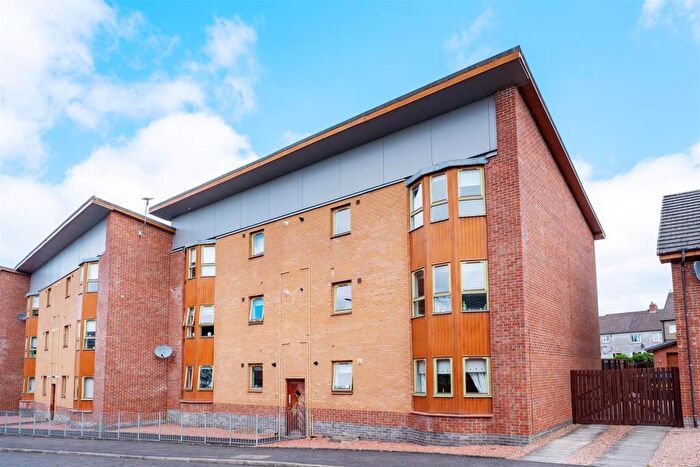
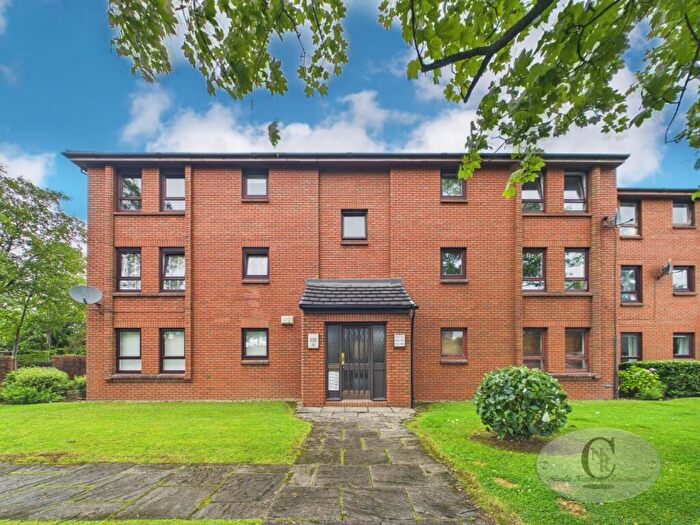
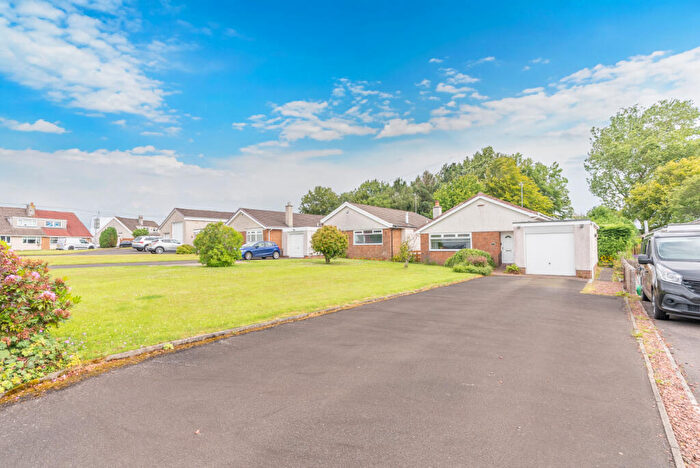
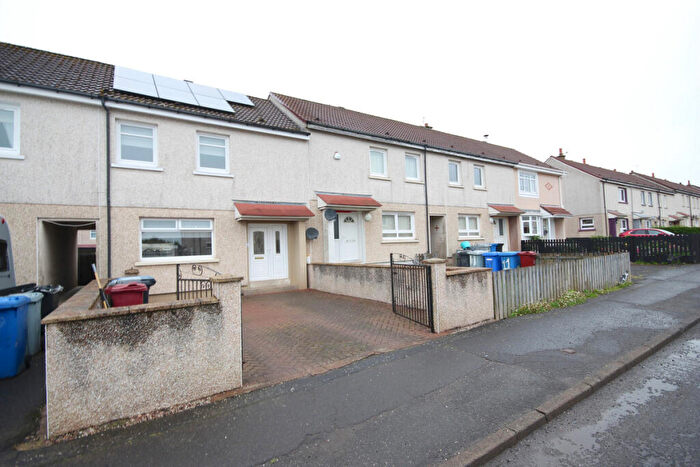
Properties for sale in Lanark
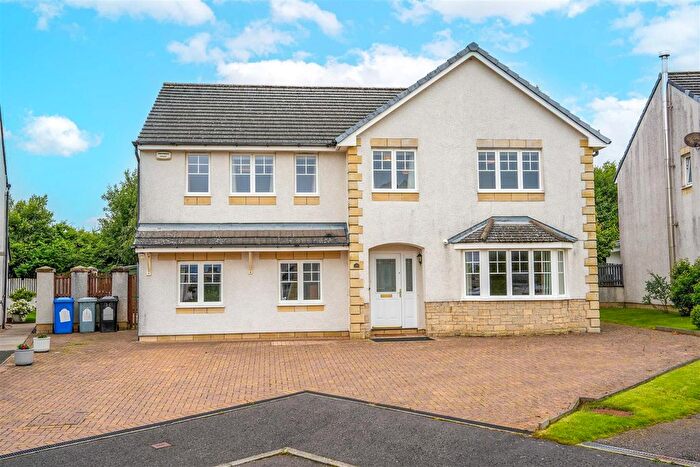
![]()
If you are looking to sell your house, let it out, or receive a property valuation, an expert can help you.
Click the button below to get started.
Neighbourhoods in Lanark
Navigate through our locations to find the location of your next house in Lanark, South Lanarkshire for sale or to rent.
Property price trends in Lanark
According to the latest Registers of Scotland data, the average home in Lanark sold for £175,435 in 2025. That figure comes from a substantial record of 13,694 sales logged over the past 25 years.
Prices have softened over the last three years. Compared with 2022, when the typical sale came in around £185,663, that's a fall of roughly 5.5%.
Looking back five years, average prices are up about 12% since 2020, a gain of around £18,815 in cash terms.
Zoom out to the past decade for the fuller picture. Back in 2015, homes here averaged £128,907, so the typical sold price has climbed about 36.1% since then, roughly 3.1% a year. Stretch the view to fifteen years and that annual pace eases back to about 1.7%.
Frequently asked questions about Lanark
What is the average price for a property for sale in Lanark?
The average price for a property for sale in Lanark is £169,146. This amount is 6% lower than the average price in South Lanarkshire. There are more than 10,000 property listings for sale in Lanark.
What locations have the most expensive properties for sale in Lanark?
The locations with the most expensive properties for sale in Lanark are Clydesdale West at an average of £365,000 and Clydesdale East at an average of £179,152.
What locations have the most affordable properties for sale in Lanark?
The locations with the most affordable properties for sale in Lanark are Clydesdale South at an average of £156,036 and Clydesdale North at an average of £176,403.
Which train stations are available in or near Lanark?
Some of the train stations available in or near Lanark are Lanark, Carstairs and Carluke.
Property Price Paid in Lanark by Year
The average sold property price by year was:
| Year | Average Sold Price | Price Change |
Sold Properties
|
|---|---|---|---|
| 2025 | £175,435 | 8% |
288 Properties |
| 2024 | £162,100 | -5% |
281 Properties |
| 2023 | £169,745 | -9% |
281 Properties |
| 2022 | £185,663 | 10% |
616 Properties |
| 2021 | £166,988 | 6% |
733 Properties |
| 2020 | £156,620 | 9% |
579 Properties |
| 2019 | £142,387 | 4% |
673 Properties |
| 2018 | £136,617 | 2% |
589 Properties |
| 2017 | £133,443 | 3% |
545 Properties |
| 2016 | £129,339 | 0,3% |
607 Properties |
Transport in Lanark
Please see below transportation links in this area:
