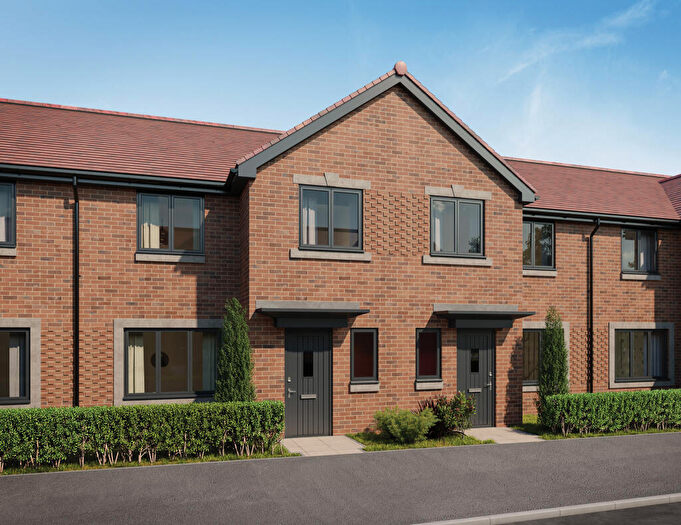
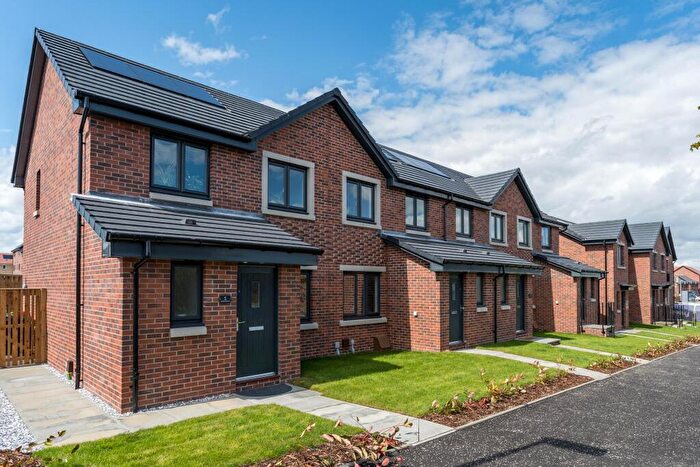
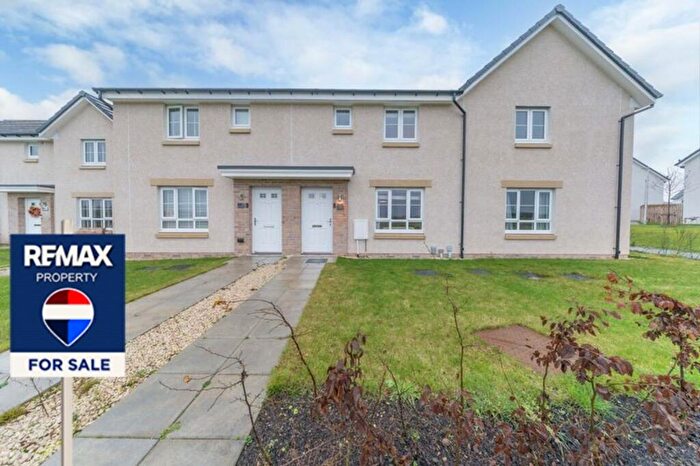
Houses for sale & to rent in Linlithgow, Broxburn
House Prices in Linlithgow
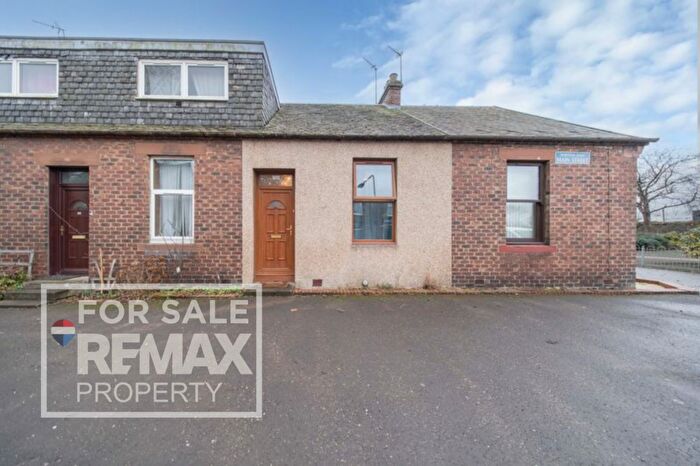
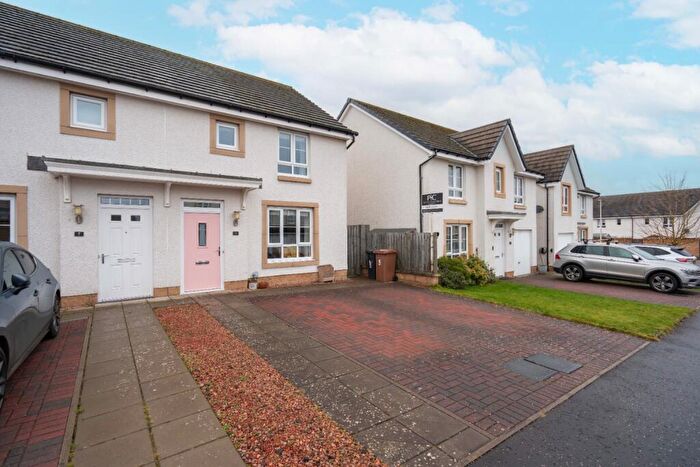
Properties in Linlithgow have an average house price of £221,000.00 and had 4 Property Transactions within the last 3 years¹.
Linlithgow is an area in Broxburn, West Lothian with 89 households², where the most expensive property was sold for £250,000.00.
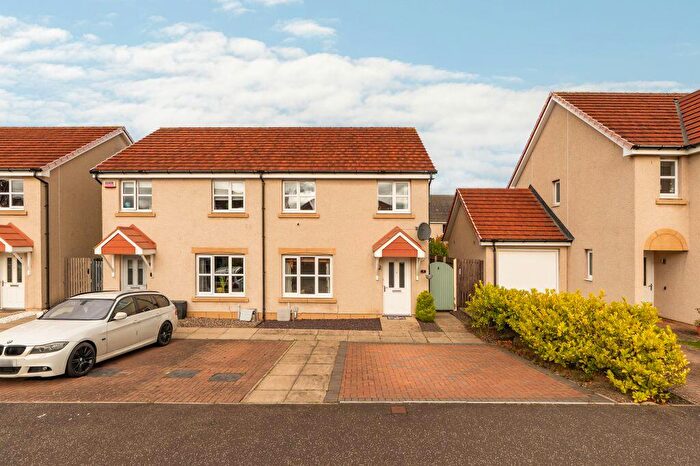
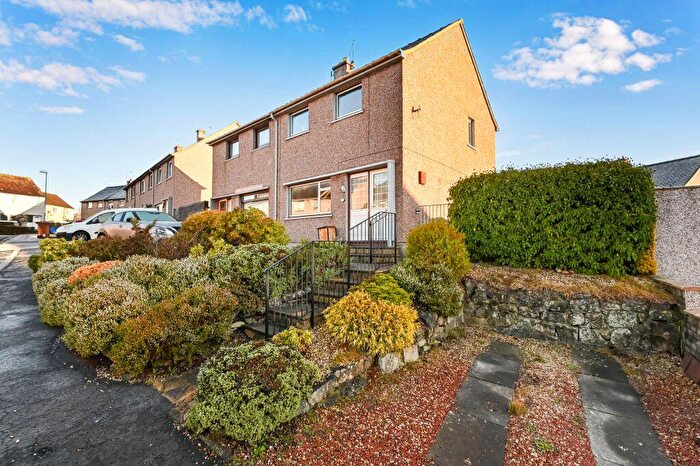
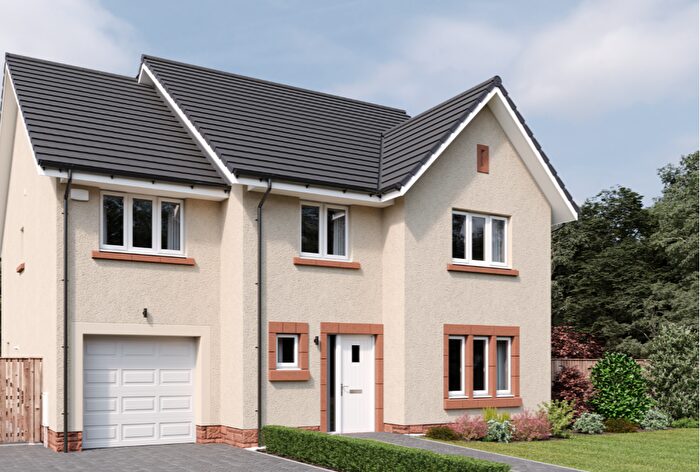
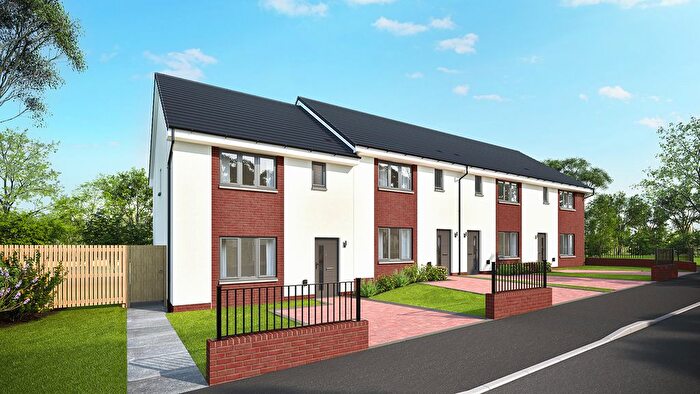
Properties for sale in Linlithgow
Roads and Postcodes in Linlithgow
Navigate through our locations to find the location of your next house in Linlithgow, Broxburn for sale or to rent.
| Streets | Postcodes |
|---|---|
| Abercorn Road | EH52 6GB |
| Duddingston Crescent | EH52 6QG |
| Duddingston Terrace | EH52 6QQ |
| Gallow View | EH52 6QL |
| Hopetoun Wood | EH52 6QZ |
| Main Street | EH52 6QE EH52 6QF |
| Whitequarries | EH52 6PZ |
| Winchburgh Road | EH52 6QB |
| EH52 6NE EH52 6QA EH52 6QH EH52 6QY |
Transport near Linlithgow
-
Dalmeny Station
-
North Queensferry Station
-
Uphall Station
-
Inverkeithing Station
-
Rosyth Station
-
Linlithgow Station
- FAQ
- Price Paid By Year
Frequently asked questions about Linlithgow
What is the average price for a property for sale in Linlithgow?
The average price for a property for sale in Linlithgow is £221,000. This amount is 13% higher than the average price in Broxburn. There are 572 property listings for sale in Linlithgow.
What streets have the most expensive properties for sale in Linlithgow?
The street with the most expensive properties for sale in Linlithgow is Main Street at an average of £242,500.
What streets have the most affordable properties for sale in Linlithgow?
The street with the most affordable properties for sale in Linlithgow is Duddingston Crescent at an average of £209,000.
Which train stations are available in or near Linlithgow?
Some of the train stations available in or near Linlithgow are Dalmeny, North Queensferry and Uphall.
Property Price Paid in Linlithgow by Year
The average sold property price by year was:
| Year | Average Sold Price | Price Change |
Sold Properties
|
|---|---|---|---|
| 2025 | £209,000 | -20% |
1 Property |
| 2024 | £250,000 | 15% |
1 Property |
| 2023 | £212,500 | -74% |
2 Properties |
| 2022 | £370,000 | 40% |
1 Property |
| 2021 | £221,123 | -66% |
4 Properties |
| 2020 | £366,875 | 48% |
6 Properties |
| 2019 | £190,832 | -18% |
6 Properties |
| 2018 | £225,757 | -4% |
3 Properties |
| 2017 | £235,170 | -19% |
5 Properties |
| 2016 | £280,845 | -12% |
7 Properties |
| 2015 | £315,000 | 59% |
1 Property |
| 2014 | £130,382 | -168% |
4 Properties |
| 2013 | £350,000 | 8% |
1 Property |
| 2012 | £323,750 | 57% |
4 Properties |
| 2011 | £139,450 | -304% |
4 Properties |
| 2010 | £563,000 | 51% |
3 Properties |
| 2009 | £274,340 | 49% |
1 Property |
| 2008 | £140,000 | 8% |
1 Property |
| 2007 | £128,625 | 13% |
2 Properties |
| 2006 | £111,325 | 3% |
6 Properties |
| 2005 | £108,422 | 7% |
4 Properties |
| 2004 | £100,872 | -109% |
6 Properties |
| 2003 | £210,569 | 46% |
5 Properties |
| 2002 | £114,213 | - |
6 Properties |

