
Houses for sale in West Lothian, Scotland
House Prices in West Lothian
Properties in West Lothian have
an average house price of
£202k
and had 5,363 Property Transactions
within the last 3 years.¹
West Lothian is a location in
Scotland with
73,276 households², where the most expensive property was sold for £1.4M.
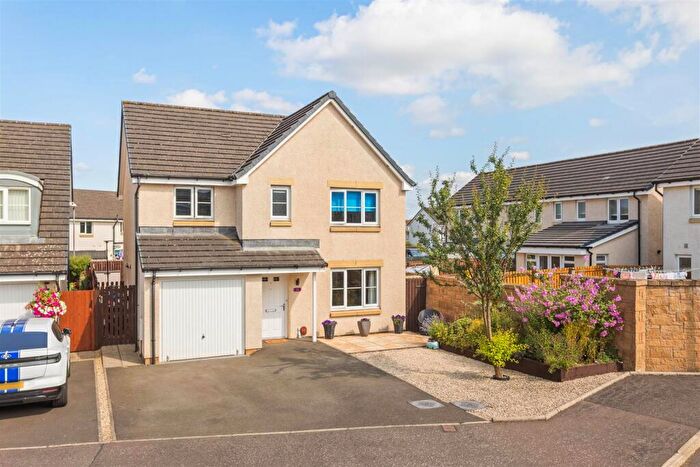
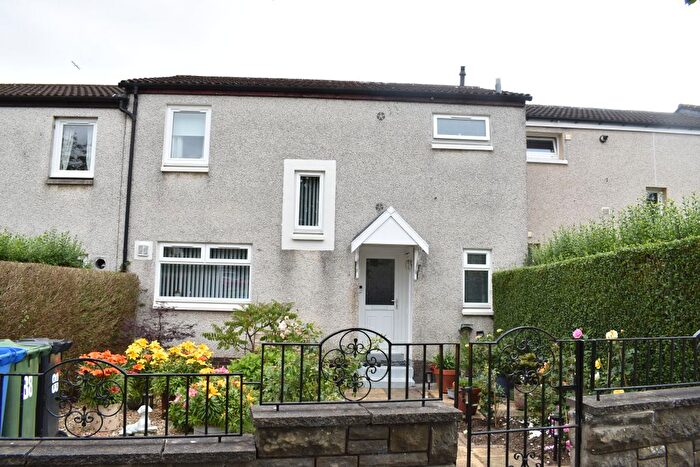
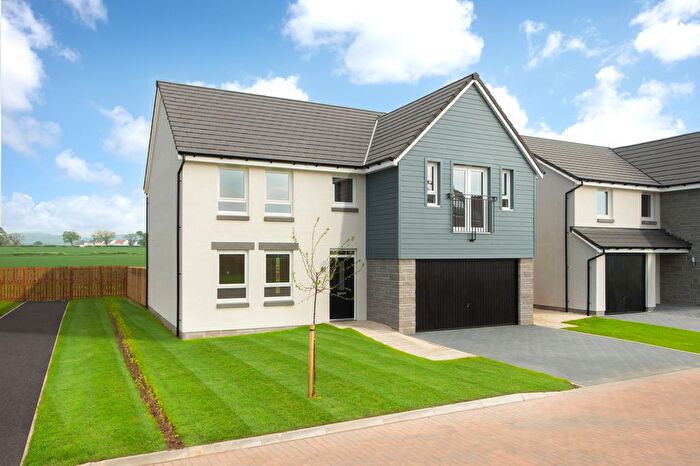
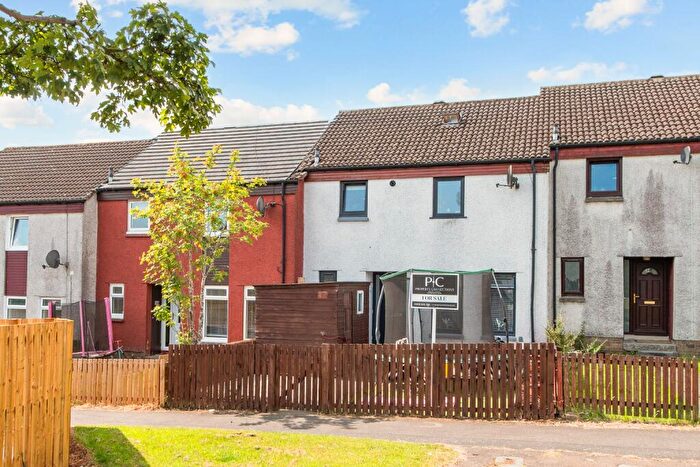
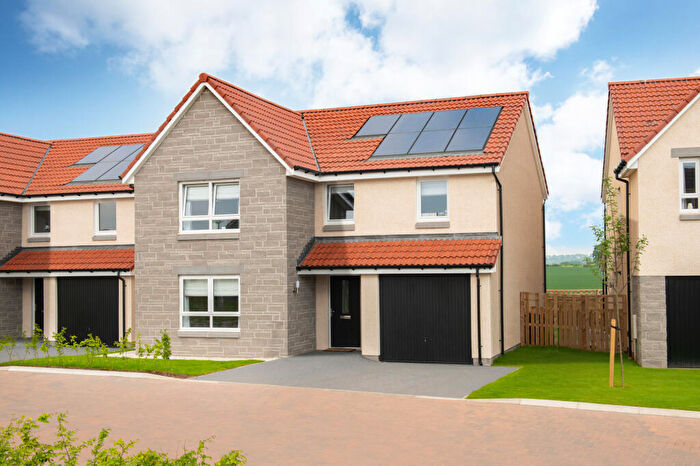
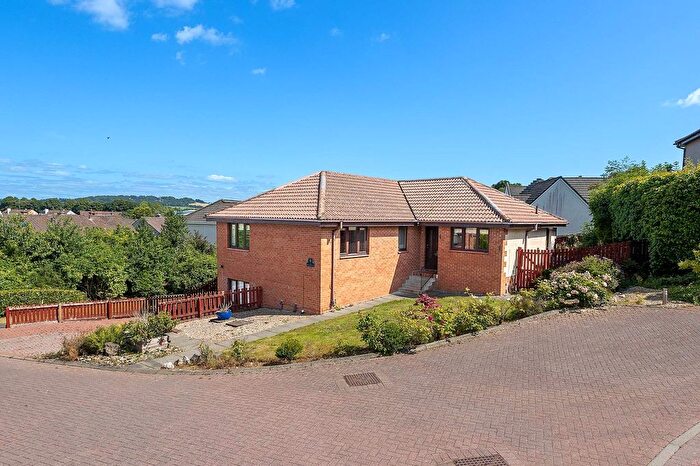
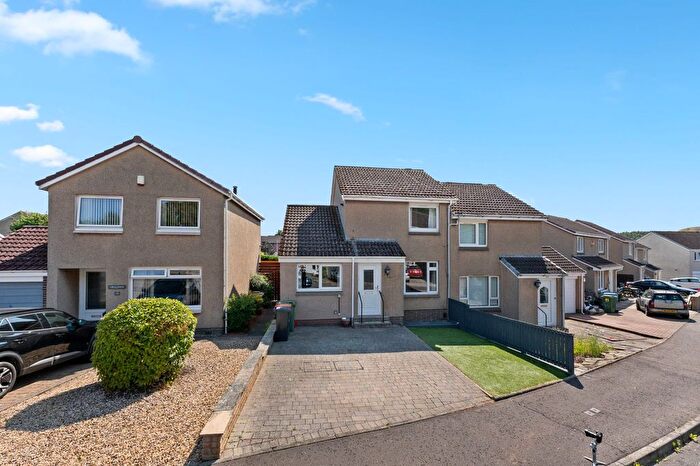
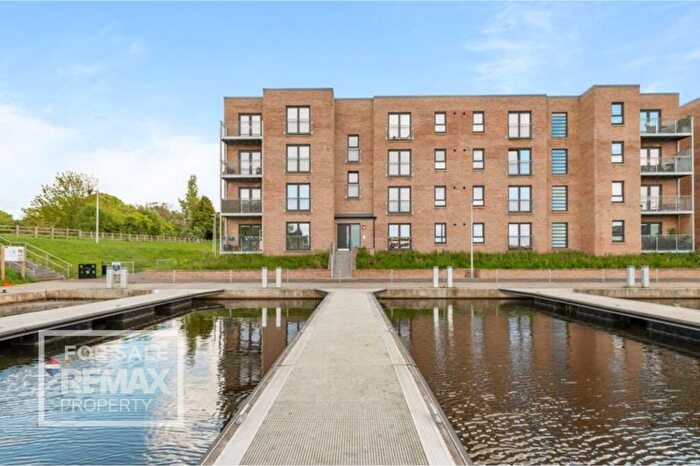
Properties for sale in West Lothian

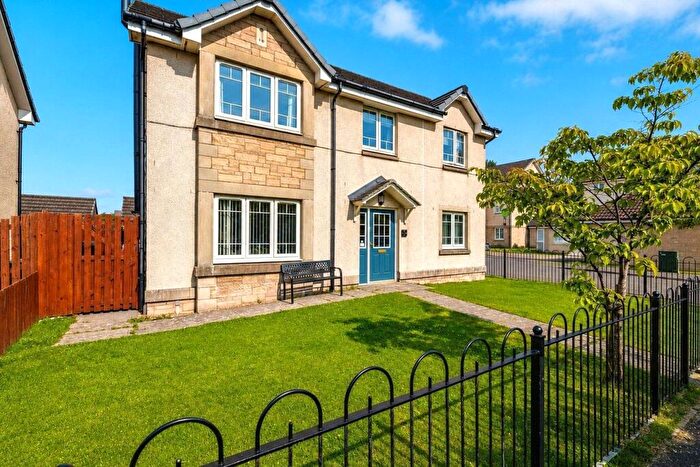

![]()
If you are looking to sell your house, let it out, or receive a property valuation, an expert can help you.
Click the button below to get started.


Towns in West Lothian
Navigate through our locations to find the location of your next house in West Lothian, Scotland for sale or to rent.
Property price trends in West Lothian
According to the latest Registers of Scotland data, the average home in West Lothian sold for £192,742 in 2026. That figure comes from a substantial record of 74,319 sales logged over the past 26 years.
Prices have softened over the last three years. Compared with 2023, when the typical sale came in around £201,069, that's a fall of roughly 4.1%.
Looking back five years, average prices are down about 2% since 2021, a drop of around £3,979 in cash terms.
Zoom out to the past decade for the fuller picture. Back in 2016, homes here averaged £158,109, so the typical sold price has climbed about 21.9% since then, roughly 2% a year. Stretch the view to fifteen years and that annual pace holds at about 2.2%.
Frequently asked questions about West Lothian
What is the average price for a property for sale in West Lothian?
The average price for a property for sale in West Lothian is £202,150. This amount is 0.29% higher than the average price in Scotland. There are more than 10,000 property listings for sale in West Lothian.
What locations have the most expensive properties for sale in West Lothian?
The locations with the most expensive properties for sale in West Lothian are Linlithgow at an average of £260,226, Kirknewton at an average of £247,153 and Livingston at an average of £218,065.
What locations have the most affordable properties for sale in West Lothian?
The locations with the most affordable properties for sale in West Lothian are Shotts at an average of £168,963, Bathgate at an average of £178,583 and West Calder at an average of £195,000.
Which train stations are available in or near West Lothian?
Some of the train stations available in or near West Lothian are Livingston North, Bathgate and West Calder.
Property Price Paid in West Lothian by Year
The average sold property price by year was:
| Year | Average Sold Price | Price Change |
Sold Properties
|
|---|---|---|---|
| 2026 | £192,742 | -8% |
343 Properties |
| 2025 | £208,584 | 5% |
1,707 Properties |
| 2024 | £198,519 | -1% |
1,637 Properties |
| 2023 | £201,069 | -8% |
1,676 Properties |
| 2022 | £216,712 | 9% |
2,839 Properties |
| 2021 | £196,721 | 3% |
3,226 Properties |
| 2020 | £190,623 | 7% |
2,786 Properties |
| 2019 | £176,940 | 4% |
3,194 Properties |
| 2018 | £169,725 | 7% |
3,071 Properties |
| 2017 | £158,220 | 0,1% |
3,323 Properties |
Transport in West Lothian
Please see below transportation links in this area:
