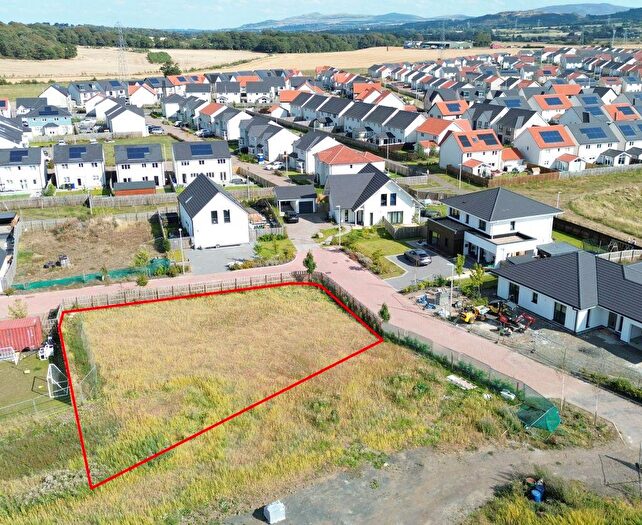
Houses for sale & to rent in East Livingston and East Calder, Kirknewton
House Prices in East Livingston and East Calder
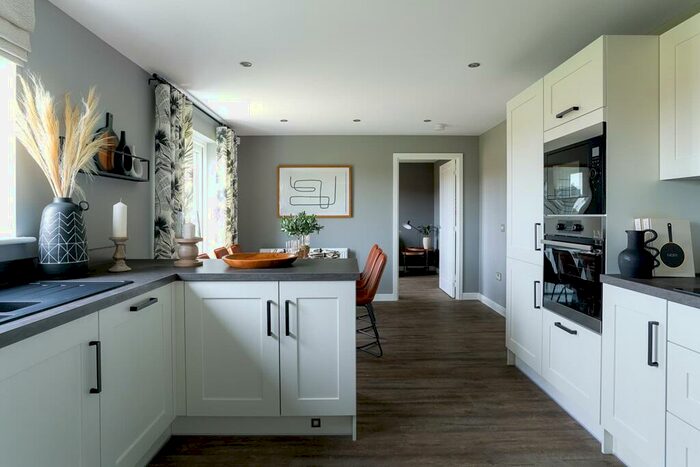
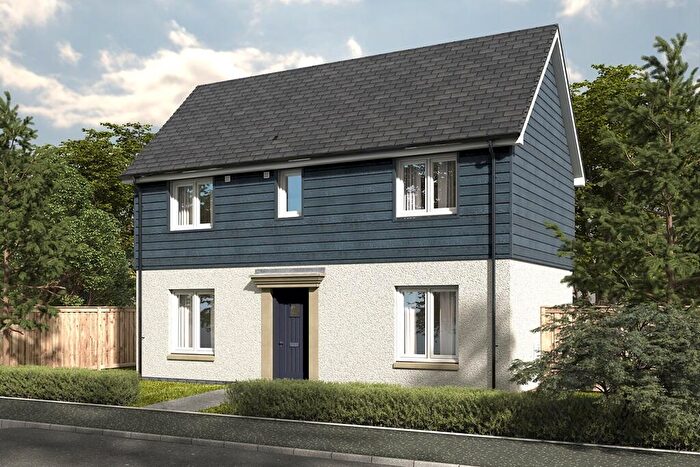
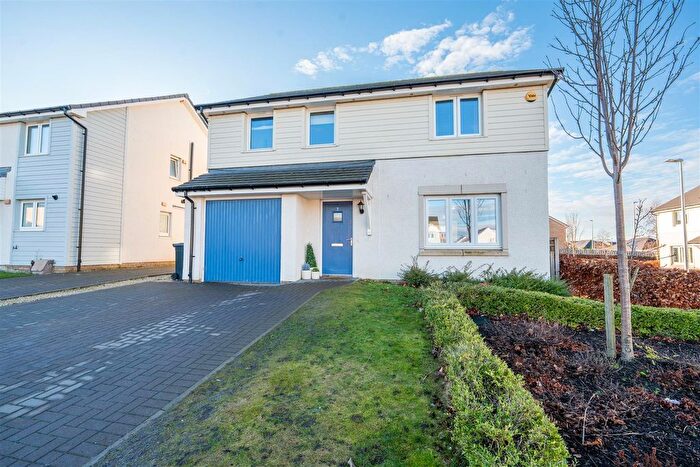
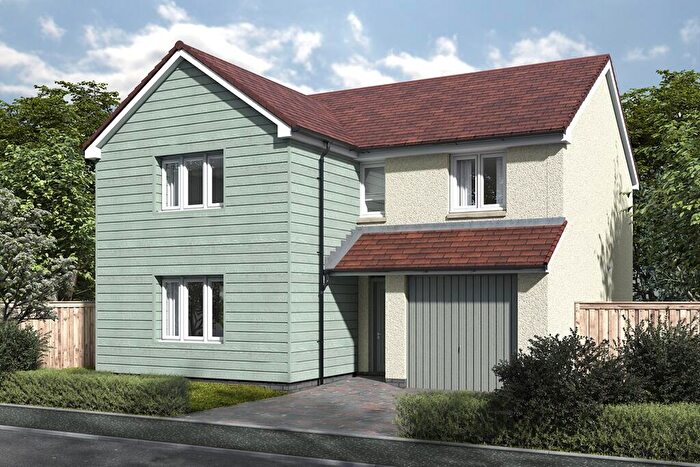
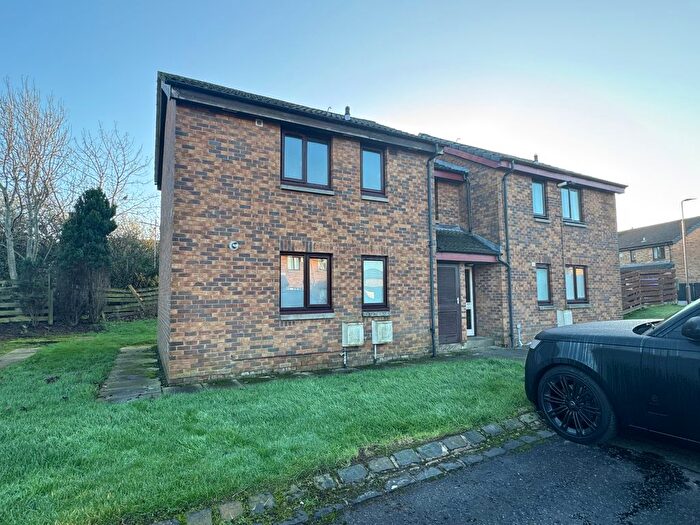
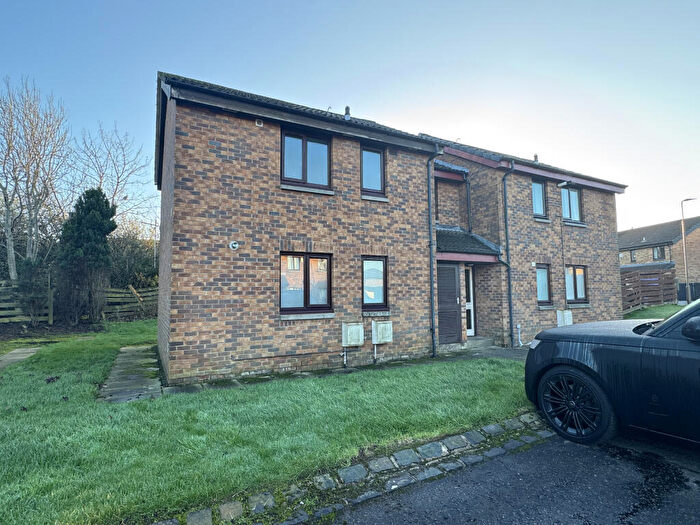
Properties in East Livingston and East Calder have an average house price of £283,251.00 and had 43 Property Transactions within the last 3 years¹.
East Livingston and East Calder is an area in Kirknewton, West Lothian with 963 households², where the most expensive property was sold for £1,050,500.00.
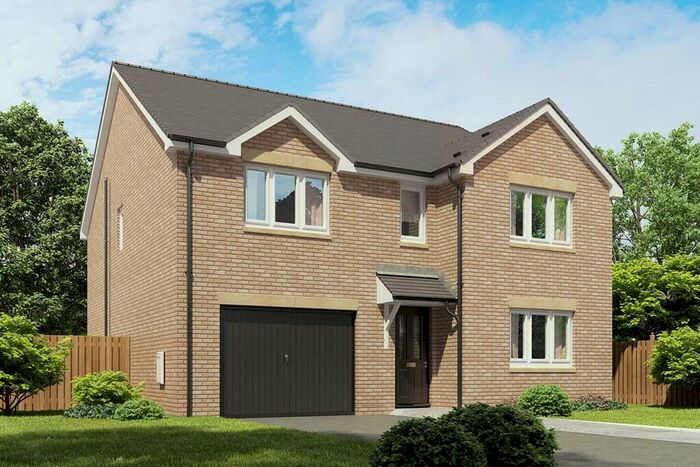
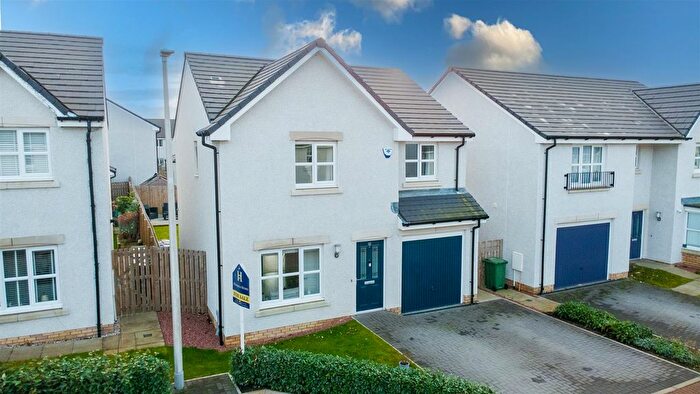
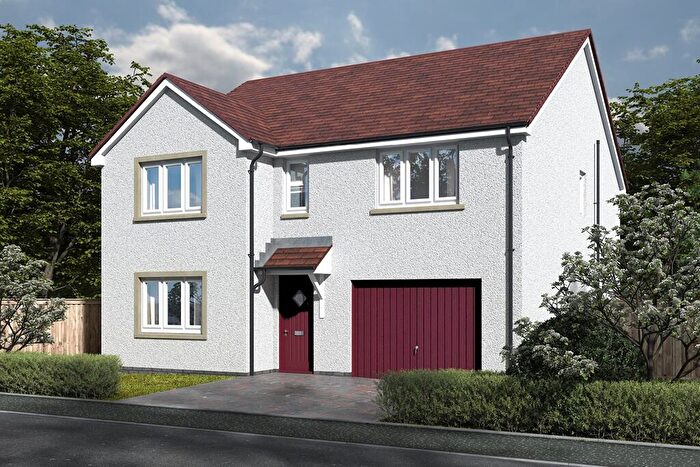
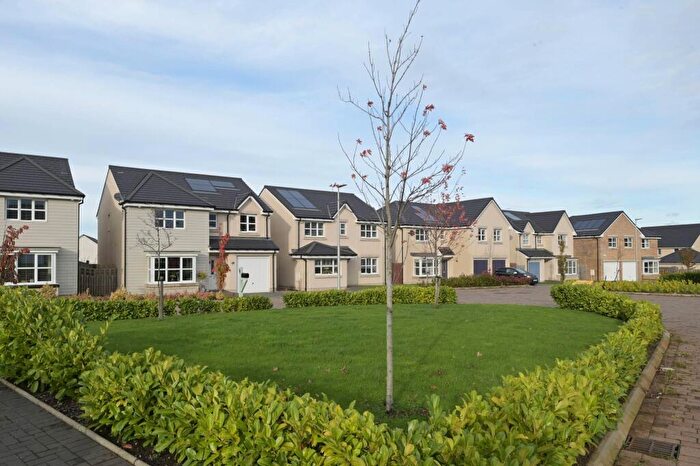
Properties for sale in East Livingston and East Calder
Roads and Postcodes in East Livingston and East Calder
Navigate through our locations to find the location of your next house in East Livingston and East Calder, Kirknewton for sale or to rent.
| Streets | Postcodes |
|---|---|
| Bonnington Road | EH27 8BD |
| Braekirk Avenue | EH27 8BL EH27 8BN |
| Braekirk Gardens | EH27 8BP EH27 8BW |
| Caledonian Court | EH27 8BX |
| Camps Industrial Estate | EH27 8DF |
| Churchill Way | EH27 8AE |
| Coxydene Court | EH27 8BY |
| Forth View | EH27 8AN |
| Hillhouse Crescent | EH27 8AW |
| Hillhouse Terrace | EH27 8AL EH27 8AR |
| Hillhouse Wynd | EH27 8BU |
| Kaimes Avenue | EH27 8AU |
| Kaimes Crescent | EH27 8AS EH27 8AT |
| Kaimes Gardens | EH27 8AZ |
| Kaimes Grove | EH27 8AY |
| Kaimes Place | EH27 8AX |
| Kirknewton Court | EH27 8BT |
| Leyden Road | EH27 8DW |
| Linburn Road | EH27 8DY |
| Lindean Terrace | EH27 8BQ |
| Louis Braille Court | EH27 8EP |
| Main Street | EH27 8AA EH27 8AH EH27 8AJ |
| Meadowbank Road | EH27 8BH EH27 8BS |
| Meadowbank View | EH27 8AP |
| Orchardfield Terrace | EH27 8BG |
| Park Terrace | EH27 8AB |
| Roosevelt Road | EH27 8AD |
| Smithy Brae | EH27 8AQ |
| Station Mews | EH27 8BZ |
| Station Road | EH27 8BJ |
| The Camps | EH27 8DN |
| The Low Doors | EH27 8AG |
| Whitemoss Lane | EH27 8DL |
| Whitemoss Road | EH27 8AF |
| EH27 8BA EH27 8BE EH27 8BF EH27 8DA EH27 8DD EH27 8DE EH27 8DG EH27 8DH EH27 8DQ EH27 8DR EH27 8DS EH27 8DT EH27 8DU EH27 8DX EH27 8DZ EH27 8EF EH27 8EL EH27 8EN EH27 8LR EH27 8ER EH27 8ES |
Transport near East Livingston and East Calder
-
Kirknewton Station
-
Livingston South Station
-
Uphall Station
-
Curriehill Station
-
Livingston North Station
- FAQ
- Price Paid By Year
Frequently asked questions about East Livingston and East Calder
What is the average price for a property for sale in East Livingston and East Calder?
The average price for a property for sale in East Livingston and East Calder is £283,251. There are 1,217 property listings for sale in East Livingston and East Calder.
Which train stations are available in or near East Livingston and East Calder?
Some of the train stations available in or near East Livingston and East Calder are Kirknewton, Livingston South and Uphall.
Property Price Paid in East Livingston and East Calder by Year
The average sold property price by year was:
| Year | Average Sold Price | Price Change |
Sold Properties
|
|---|---|---|---|
| 2023 | £190,788 | -58% |
7 Properties |
| 2022 | £301,230 | 20% |
36 Properties |
| 2021 | £241,652 | -17% |
33 Properties |
| 2020 | £283,801 | 24% |
38 Properties |
| 2019 | £216,342 | -42% |
27 Properties |
| 2018 | £307,313 | 34% |
49 Properties |
| 2017 | £204,092 | 1% |
46 Properties |
| 2016 | £202,001 | 5% |
37 Properties |
| 2015 | £191,822 | -4% |
45 Properties |
| 2014 | £198,557 | 27% |
45 Properties |
| 2013 | £144,451 | -20% |
35 Properties |
| 2012 | £173,775 | 12% |
45 Properties |
| 2011 | £153,071 | -21% |
20 Properties |
| 2010 | £184,708 | -0,3% |
28 Properties |
| 2009 | £185,319 | 5% |
32 Properties |
| 2008 | £175,172 | -5% |
40 Properties |
| 2007 | £183,875 | 27% |
63 Properties |
| 2006 | £133,831 | -22% |
65 Properties |
| 2005 | £163,000 | 28% |
70 Properties |
| 2004 | £117,148 | 7% |
75 Properties |
| 2003 | £108,372 | 18% |
108 Properties |
| 2002 | £89,225 | 27% |
66 Properties |
| 2001 | £64,843 | 63% |
12 Properties |
| 2000 | £24,300 | - |
1 Property |

