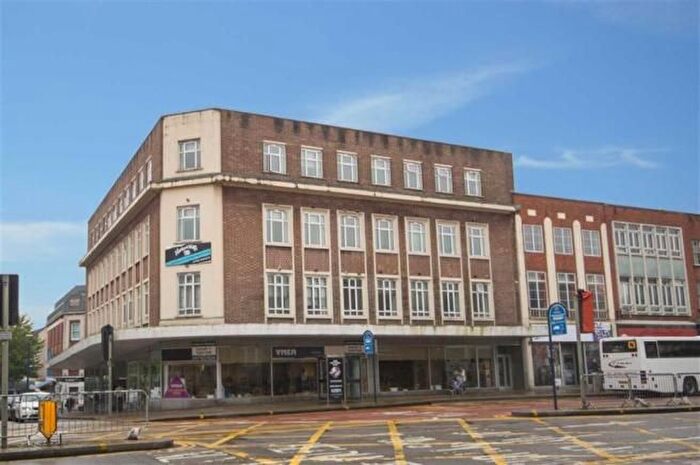
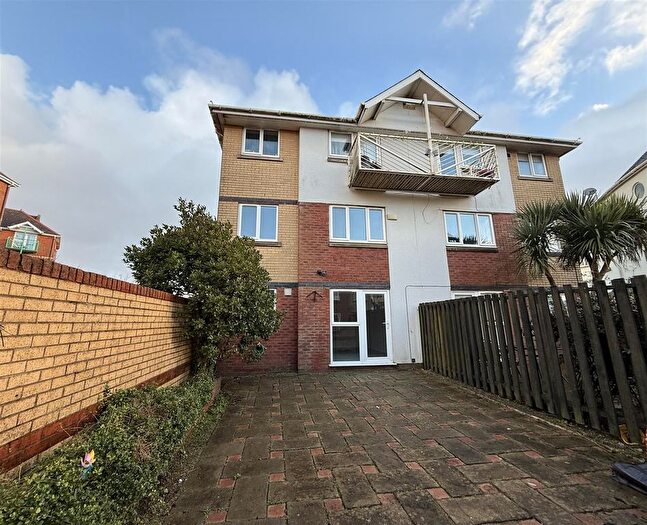
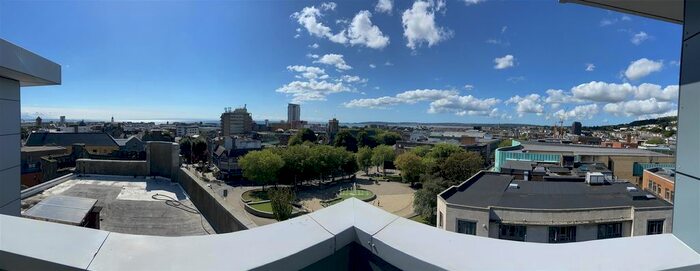
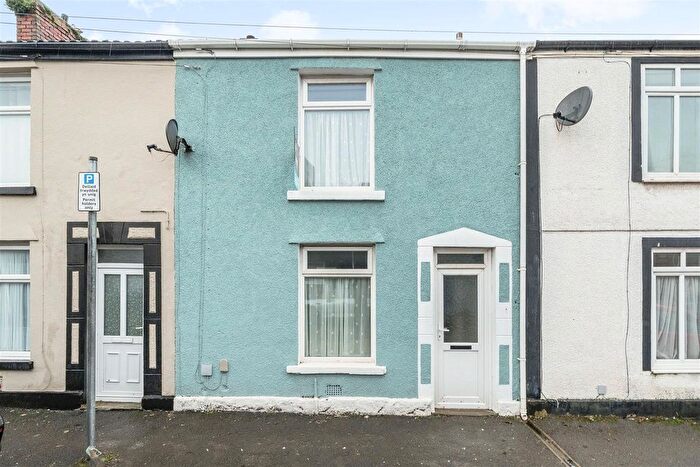
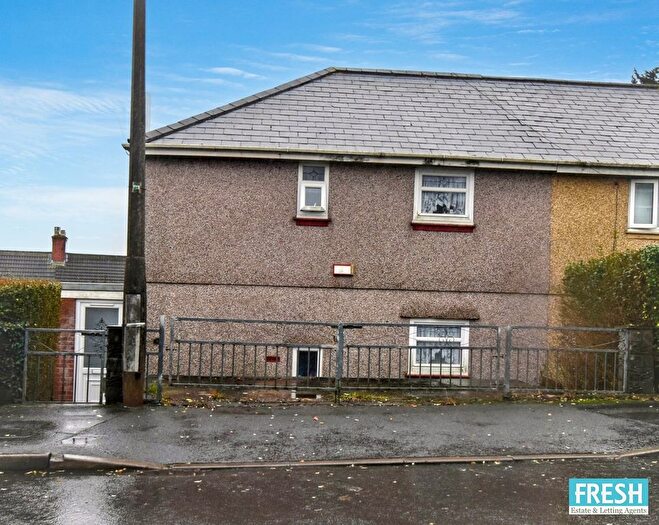
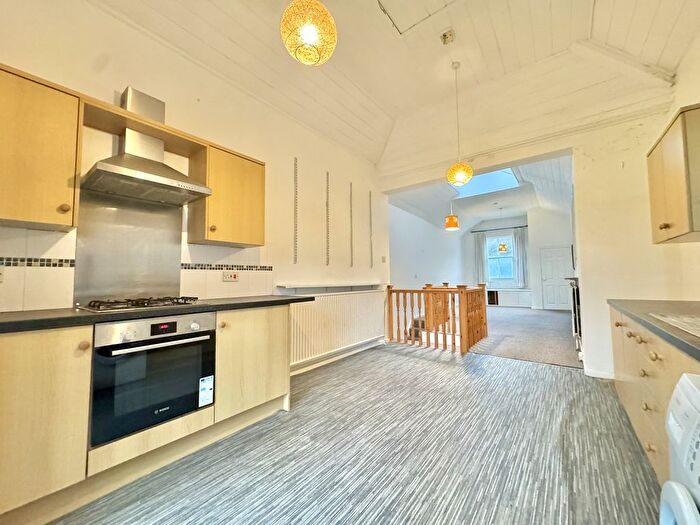
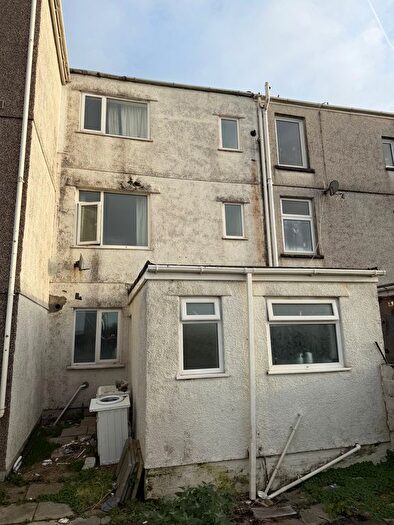
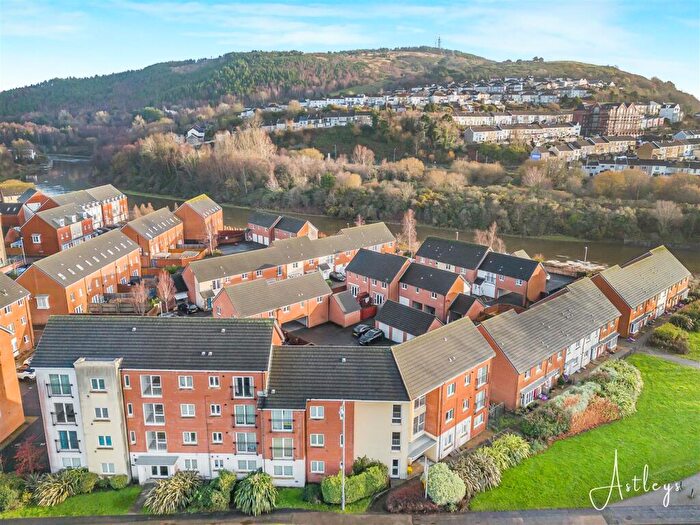
Houses for sale & to rent in Castle, Swansea
House Prices in Castle
Properties in Castle have an average house price of £147,776.00 and had 982 Property Transactions within the last 3 years¹.
Castle is an area in Swansea, Abertawe - Swansea with 8,151 households², where the most expensive property was sold for £590,000.00.
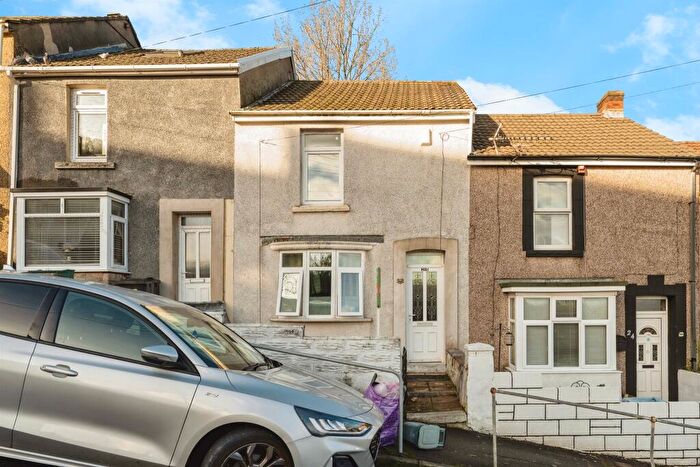
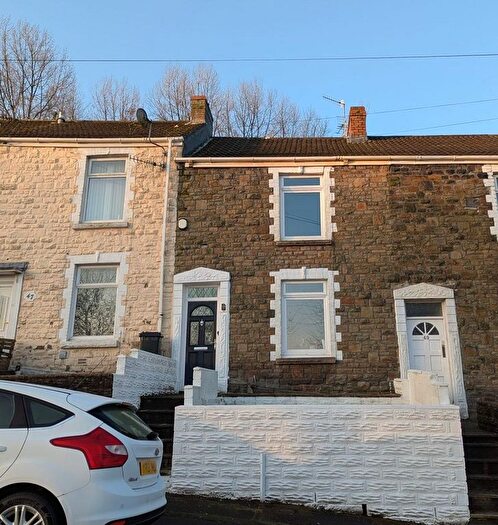
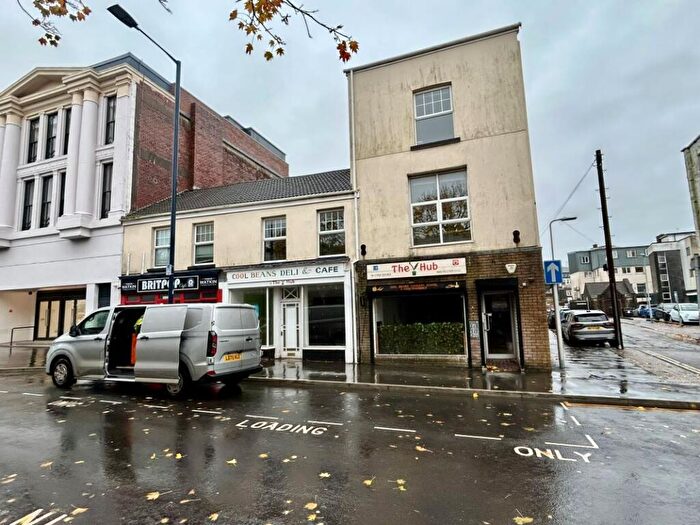
Properties for sale in Castle
Roads and Postcodes in Castle
Navigate through our locations to find the location of your next house in Castle, Swansea for sale or to rent.
Transport near Castle
- FAQ
- Price Paid By Year
- Property Type Price
Frequently asked questions about Castle
What is the average price for a property for sale in Castle?
The average price for a property for sale in Castle is £147,776. This amount is 32% lower than the average price in Swansea. There are 1,759 property listings for sale in Castle.
What streets have the most expensive properties for sale in Castle?
The streets with the most expensive properties for sale in Castle are Marine Walk at an average of £393,000, Chaddesley Terrace at an average of £280,400 and Oystermouth Road at an average of £270,200.
What streets have the most affordable properties for sale in Castle?
The streets with the most affordable properties for sale in Castle are Croft Street at an average of £53,000, Cwm Road at an average of £67,666 and Long Ridge at an average of £69,000.
Which train stations are available in or near Castle?
Some of the train stations available in or near Castle are Swansea, Llansamlet and Gowerton.
Property Price Paid in Castle by Year
The average sold property price by year was:
| Year | Average Sold Price | Price Change |
Sold Properties
|
|---|---|---|---|
| 2025 | £163,444 | 12% |
142 Properties |
| 2024 | £144,241 | 1% |
269 Properties |
| 2023 | £142,366 | -4% |
280 Properties |
| 2022 | £148,605 | 11% |
291 Properties |
| 2021 | £132,448 | -1% |
284 Properties |
| 2020 | £133,196 | 2% |
206 Properties |
| 2019 | £130,508 | -1% |
237 Properties |
| 2018 | £131,419 | 5% |
244 Properties |
| 2017 | £124,892 | - |
275 Properties |
| 2016 | £124,883 | 8% |
260 Properties |
| 2015 | £115,145 | -4% |
291 Properties |
| 2014 | £120,065 | 6% |
212 Properties |
| 2013 | £113,070 | 0,4% |
208 Properties |
| 2012 | £112,609 | -24% |
159 Properties |
| 2011 | £139,214 | -13% |
184 Properties |
| 2010 | £157,732 | -2% |
239 Properties |
| 2009 | £160,658 | -5% |
318 Properties |
| 2008 | £167,997 | 13% |
366 Properties |
| 2007 | £146,332 | 6% |
629 Properties |
| 2006 | £137,075 | 10% |
510 Properties |
| 2005 | £123,167 | 5% |
327 Properties |
| 2004 | £116,448 | 29% |
320 Properties |
| 2003 | £82,129 | 20% |
421 Properties |
| 2002 | £65,935 | 16% |
361 Properties |
| 2001 | £55,710 | -0,3% |
344 Properties |
| 2000 | £55,853 | 11% |
365 Properties |
| 1999 | £49,701 | 9% |
370 Properties |
| 1998 | £45,336 | 5% |
290 Properties |
| 1997 | £43,239 | 11% |
273 Properties |
| 1996 | £38,630 | -9% |
238 Properties |
| 1995 | £41,915 | - |
195 Properties |
Property Price per Property Type in Castle
Here you can find historic sold price data in order to help with your property search.
The average Property Paid Price for specific property types in the last three years are:
| Property Type | Average Sold Price | Sold Properties |
|---|---|---|
| Semi Detached House | £156,112.00 | 39 Semi Detached Houses |
| Detached House | £213,615.00 | 13 Detached Houses |
| Terraced House | £151,382.00 | 577 Terraced Houses |
| Flat | £138,537.00 | 353 Flats |


