
Houses for sale & to rent in Swansea, Abertawe - Swansea
House Prices in Swansea
Properties in Swansea have an average house price of £219k and had 8,985 Property Transactions within the last 3 years.¹
Swansea is an area in Abertawe - Swansea with 103,356 households², where the most expensive property was sold for £2.47M.
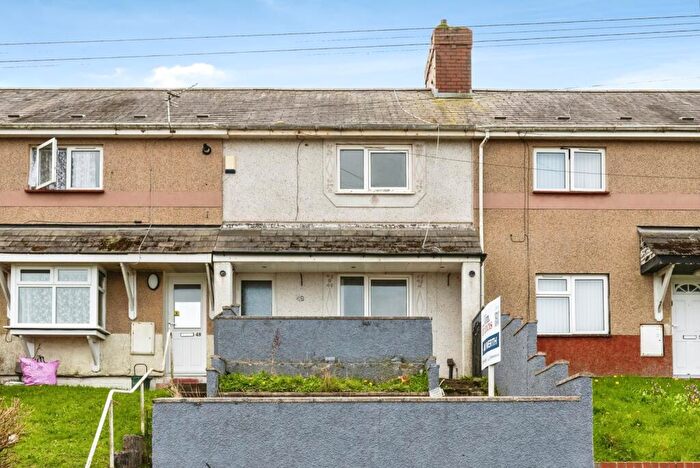
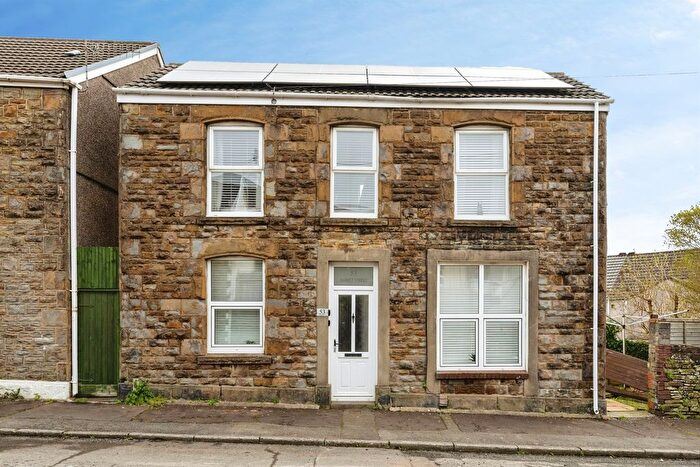
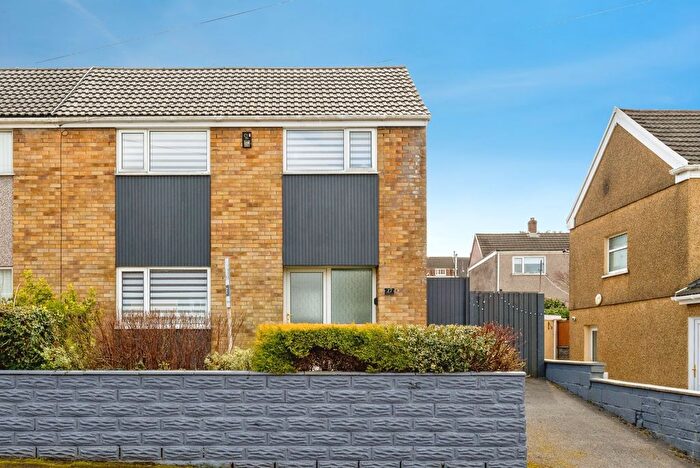
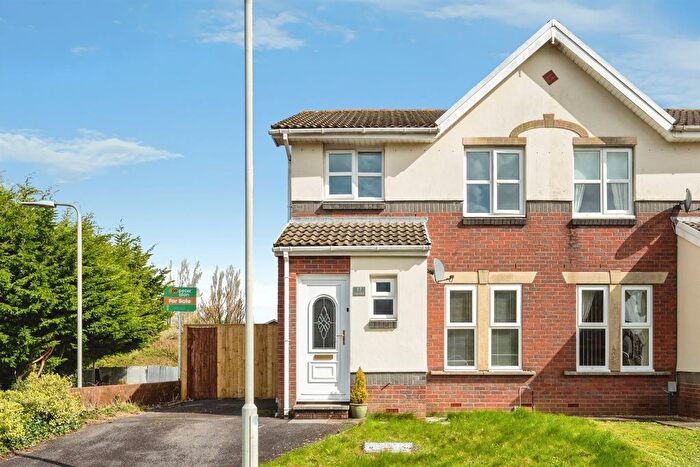
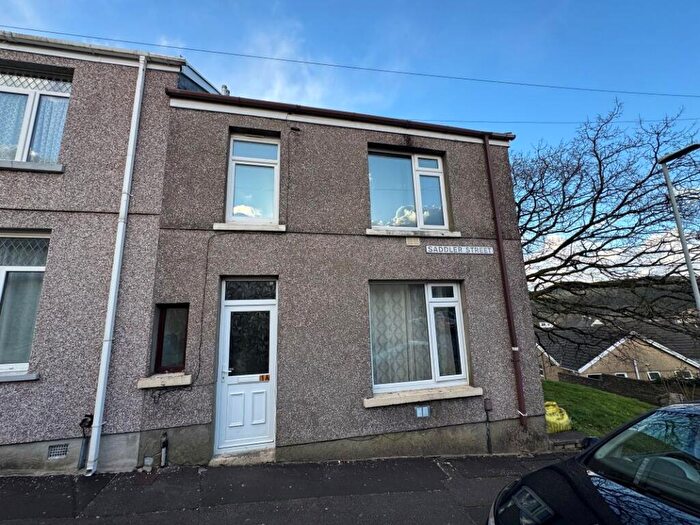
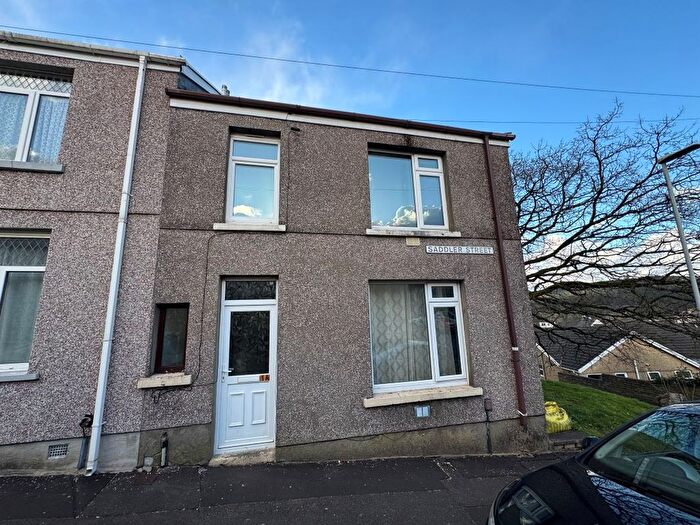
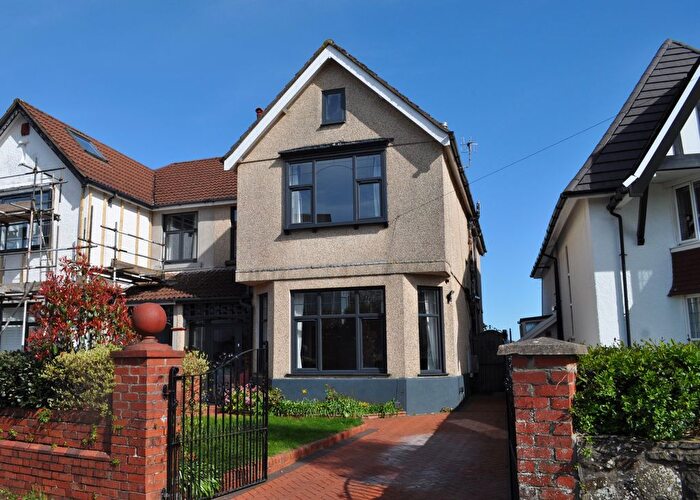
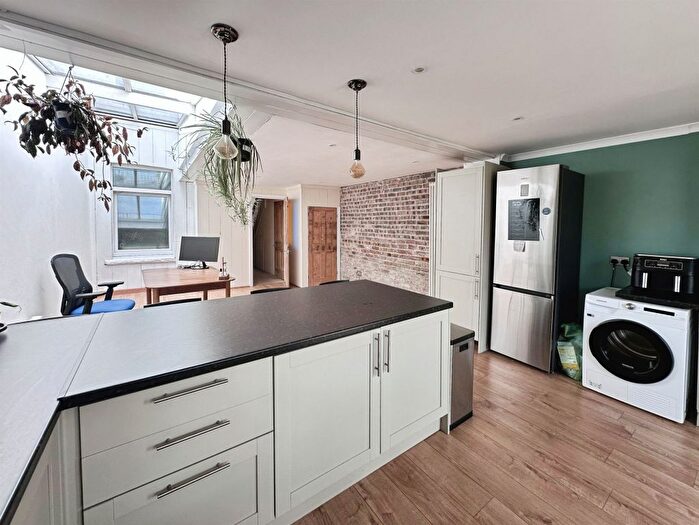
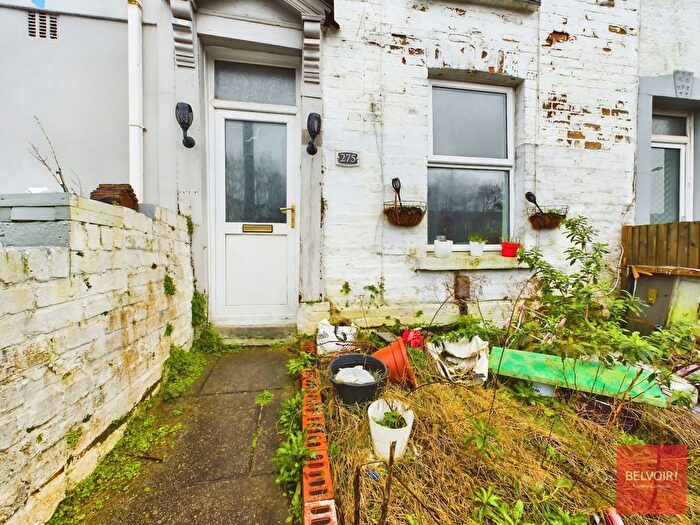
Properties for sale in Swansea
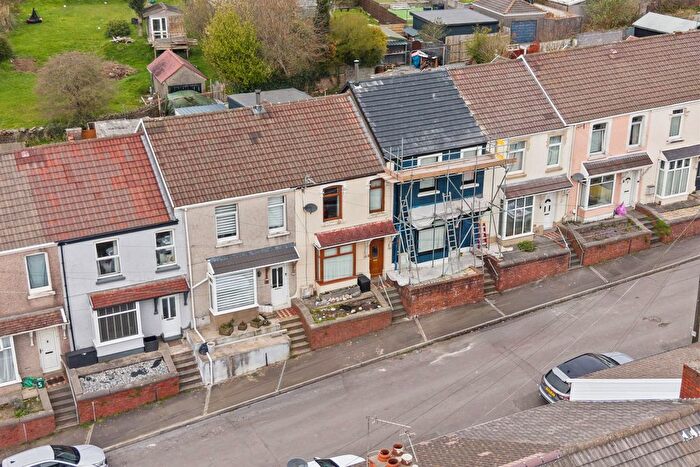

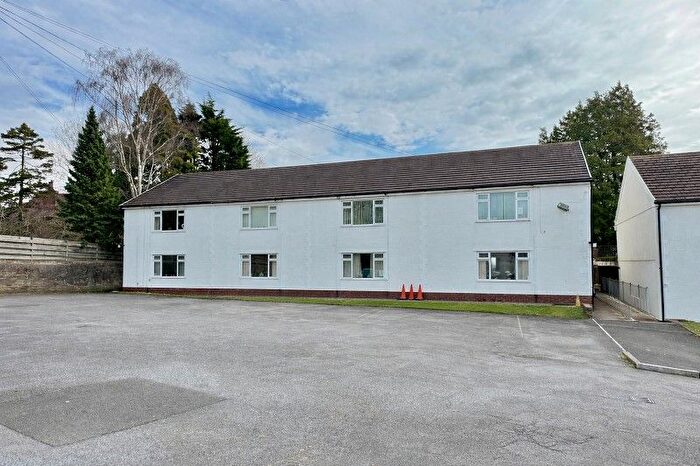
![]()
If you are looking to sell your house, let it out, or receive a property valuation, an expert can help you.
Click the button below to get started.


Neighbourhoods in Swansea
Navigate through our locations to find the location of your next house in Swansea, Abertawe - Swansea for sale or to rent.
- Bishopston
- Bonymaen
- Castle
- Clydach
- Cockett
- Cwmbwrla
- Dunvant
- Fairwood
- Gorseinon
- Gower
- Gowerton
- Killay North
- Killay South
- Kingsbridge
- Landore
- Llangyfelach
- Llansamlet
- Lower Loughor
- Mawr
- Mayals
- Morriston
- Mynyddbach
- Newton
- Oystermouth
- Penclawdd
- Penderry
- Penllergaer
- Pennard
- Penyrheol
- Pontardulais
- Sketty
- St. Thomas
- Townhill
- Uplands
- Upper Loughor
- West Cross
- Allt-wen
Transport in Swansea
Please see below transportation links in this area:

- FAQ
- Price Paid By Year
- Property Type Price
Frequently asked questions about Swansea
What is the average price for a property for sale in Swansea?
The average price for a property for sale in Swansea is £219,464. This amount is 0.02% lower than the average price in Abertawe - Swansea. There are more than 10,000 property listings for sale in Swansea.
What locations have the most expensive properties for sale in Swansea?
The locations with the most expensive properties for sale in Swansea are Newton at an average of £473,017, Gower at an average of £470,795 and Pennard at an average of £422,721.
What locations have the most affordable properties for sale in Swansea?
The locations with the most affordable properties for sale in Swansea are Townhill at an average of £120,541, Landore at an average of £124,853 and Cwmbwrla at an average of £137,774.
Which train stations are available in or near Swansea?
Some of the train stations available in or near Swansea are Swansea, Gowerton and Llansamlet.
Property Price Paid in Swansea by Year
The average sold property price by year was:
| Year | Average Sold Price | Price Change |
Sold Properties
|
|---|---|---|---|
| 2026 | £210,118 | -10% |
46 Properties |
| 2025 | £231,594 | 6% |
2,725 Properties |
| 2024 | £218,761 | 4% |
3,205 Properties |
| 2023 | £209,371 | -3% |
3,009 Properties |
| 2022 | £216,081 | 2% |
3,605 Properties |
| 2021 | £211,843 | 11% |
4,166 Properties |
| 2020 | £188,780 | 6% |
2,900 Properties |
| 2019 | £176,563 | 2% |
3,569 Properties |
| 2018 | £173,051 | 7% |
3,677 Properties |
| 2017 | £161,666 | -1% |
3,866 Properties |
| 2016 | £163,906 | 6% |
3,670 Properties |
| 2015 | £154,677 | 1% |
3,402 Properties |
| 2014 | £153,393 | 2% |
3,355 Properties |
| 2013 | £151,085 | 1% |
2,834 Properties |
| 2012 | £150,121 | 0,4% |
2,351 Properties |
| 2011 | £149,450 | -4% |
2,475 Properties |
| 2010 | £155,156 | -0,1% |
2,512 Properties |
| 2009 | £155,244 | -1% |
2,683 Properties |
| 2008 | £157,417 | 1% |
2,808 Properties |
| 2007 | £156,491 | 5% |
4,852 Properties |
| 2006 | £148,398 | 6% |
4,943 Properties |
| 2005 | £139,269 | 7% |
3,838 Properties |
| 2004 | £128,958 | 25% |
4,135 Properties |
| 2003 | £97,032 | 19% |
5,069 Properties |
| 2002 | £78,420 | 11% |
5,294 Properties |
| 2001 | £69,938 | 5% |
4,692 Properties |
| 2000 | £66,208 | 10% |
4,232 Properties |
| 1999 | £59,265 | 2% |
4,320 Properties |
| 1998 | £57,924 | 2% |
3,842 Properties |
| 1997 | £56,724 | 7% |
3,945 Properties |
| 1996 | £52,512 | 3% |
3,668 Properties |
| 1995 | £51,033 | - |
2,811 Properties |
Property Price per Property Type in Swansea
Here you can find historic sold price data in order to help with your property search.
The average Property Paid Price for specific property types in the last three years are:
| Property Type | Average Sold Price | Sold Properties |
|---|---|---|
| Semi Detached House | £209,237.00 | 2,925 Semi Detached Houses |
| Terraced House | £161,720.00 | 3,286 Terraced Houses |
| Detached House | £363,603.00 | 1,944 Detached Houses |
| Flat | £146,521.00 | 830 Flats |