
Houses for sale & to rent in SA3 1BQ, Burryhead Cottages, Gower, Swansea
House Prices in SA3 1BQ, Burryhead Cottages, Gower
Properties in SA3 1BQ have no sales history available within the last 3 years. SA3 1BQ is a postcode in Burryhead Cottages located in Gower, an area in Swansea, Abertawe - Swansea, with 2 households².
Previously listed properties near SA3 1BQ, Burryhead Cottages

![]()
If you are looking to sell your house, let it out, or receive a property valuation, an expert can help you.
Click the button below to get started.


Price Paid in Burryhead Cottages, SA3 1BQ, Gower
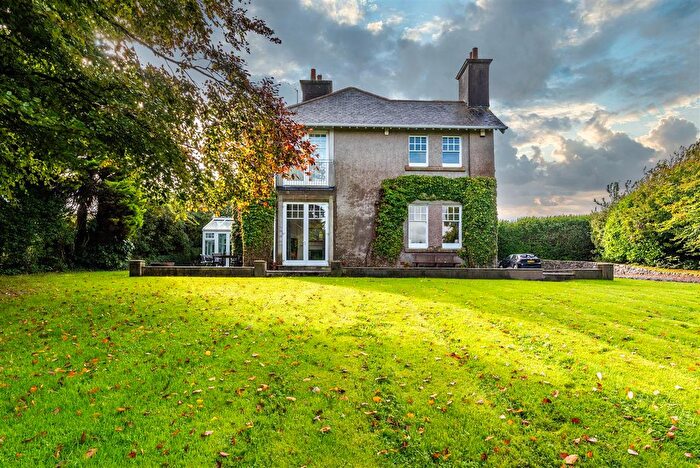
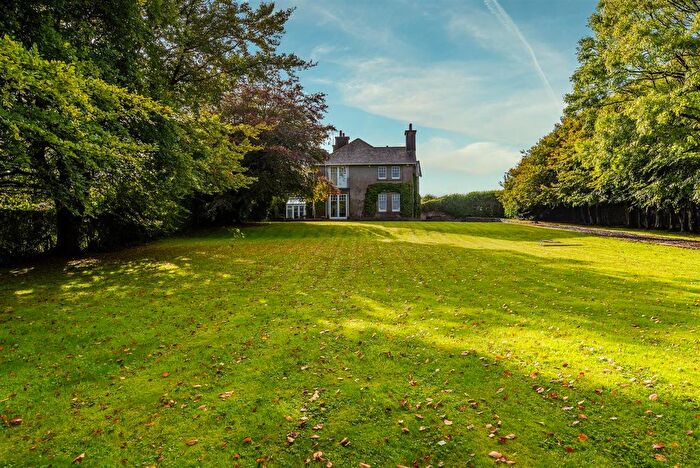
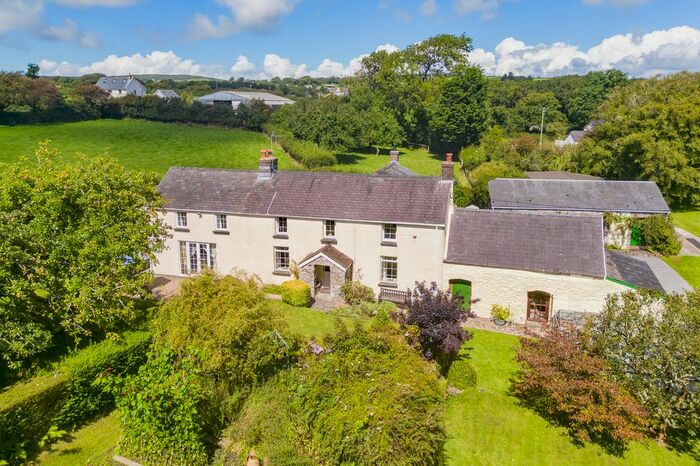
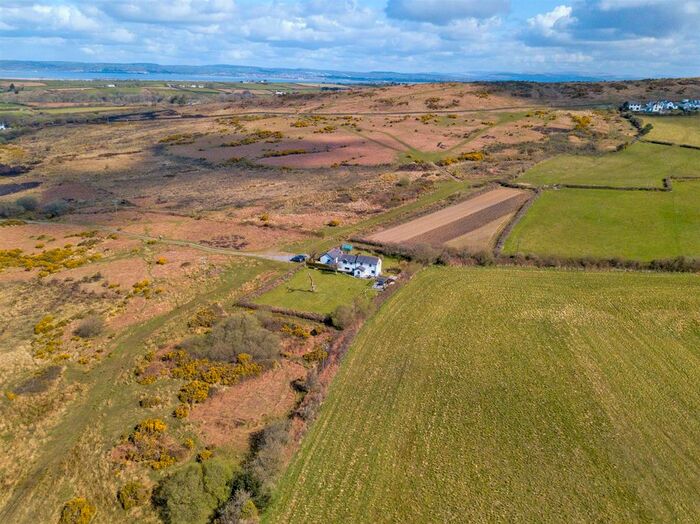
1 Burryhead Cottages, SA3 1BQ, Gower Swansea
Property 1 has been sold 5 times. The last time it was sold was in 05/11/2021 and the sold price was £399,744.00.
This detached house, sold as a freehold on 05/11/2021, is a 163 sqm semi-detached house with an EPC rating of E.
| Date | Price | Property Type | Tenure | Classification |
|---|---|---|---|---|
| 05/11/2021 | £399,744.00 | Detached House | freehold | Established Building |
| 05/08/2010 | £340,000.00 | Detached House | freehold | Established Building |
| 08/08/2007 | £343,590.00 | Detached House | freehold | Established Building |
| 16/12/1999 | £135,000.00 | Detached House | freehold | Established Building |
| 21/04/1997 | £88,000.00 | Detached House | freehold | Established Building |
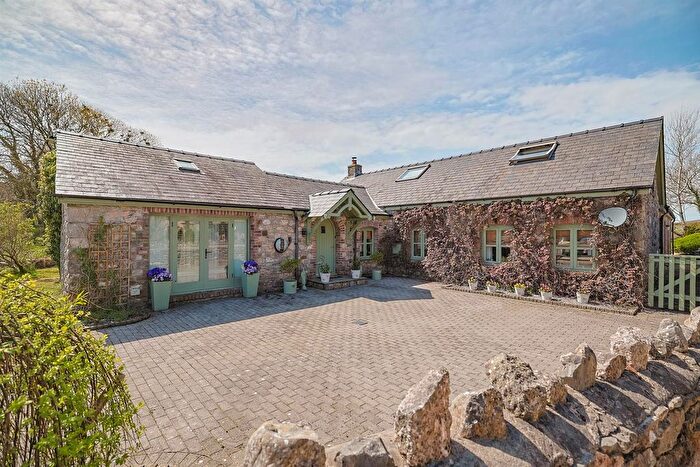
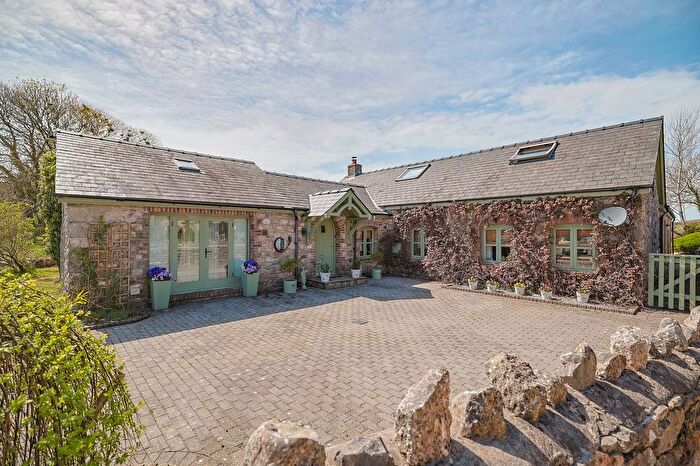
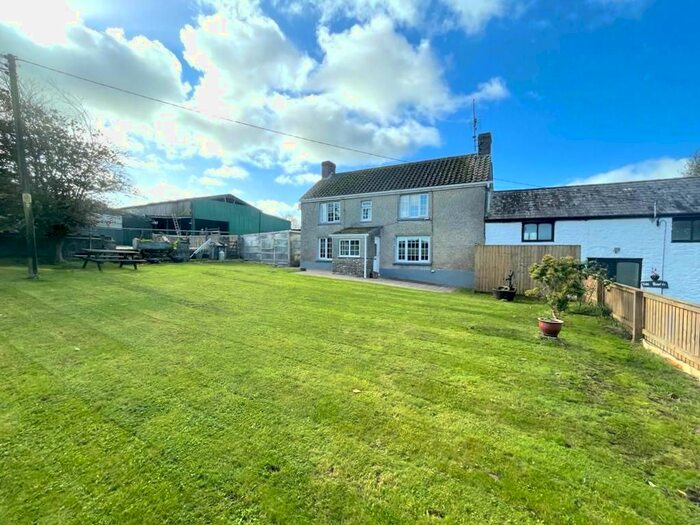
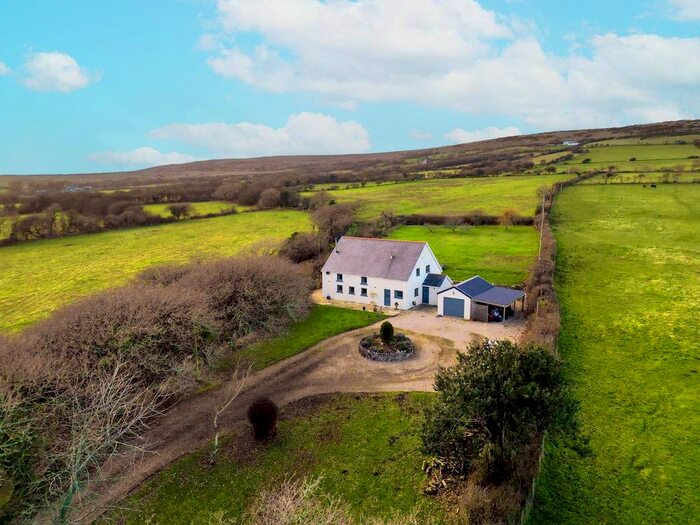
2 Burryhead Cottages, SA3 1BQ, Gower Swansea
Property 2 has been sold 3 times. The last time it was sold was in 07/09/2011 and the sold price was £299,500.00.
This semi detached house, sold as a freehold on 07/09/2011, is a 287 sqm semi-detached house with an EPC rating of C.
| Date | Price | Property Type | Tenure | Classification |
|---|---|---|---|---|
| 07/09/2011 | £299,500.00 | Semi Detached House | freehold | Established Building |
| 10/03/2006 | £249,995.00 | Semi Detached House | freehold | Established Building |
| 19/12/2003 | £90,000.00 | Semi Detached House | freehold | Established Building |
Transport near SA3 1BQ, Burryhead Cottages

House price paid reports for SA3 1BQ, Burryhead Cottages
Click on the buttons below to see price paid reports by year or property price:
- Price Paid By Year
Property Price Paid in SA3 1BQ, Burryhead Cottages by Year
The average sold property price by year was:
| Year | Average Sold Price | Price Change |
Sold Properties
|
|---|---|---|---|
| 2021 | £399,744 | 25% |
1 Property |
| 2011 | £299,500 | -14% |
1 Property |
| 2010 | £340,000 | -1% |
1 Property |
| 2007 | £343,590 | 27% |
1 Property |
| 2006 | £249,995 | 64% |
1 Property |
| 2003 | £90,000 | -50% |
1 Property |
| 1999 | £135,000 | 35% |
1 Property |
| 1997 | £88,000 | - |
1 Property |