
Houses for sale & to rent in Ebbw Vale, Blaenau Gwent - Blaenau Gwent
House Prices in Ebbw Vale
Properties in Ebbw Vale have an average house price of £147,955.00 and had 1,474 Property Transactions within the last 3 years.¹
Ebbw Vale is an area in Blaenau Gwent - Blaenau Gwent with 14,265 households², where the most expensive property was sold for £600,000.00.
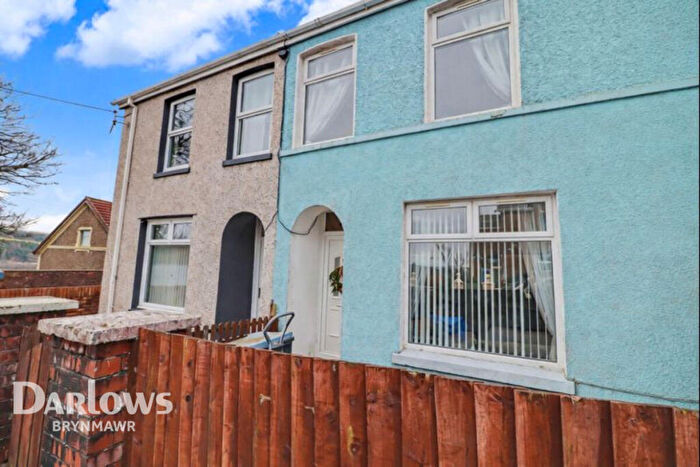
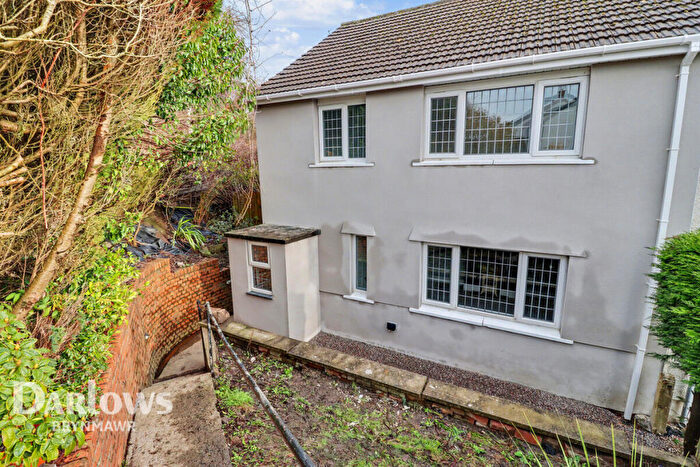
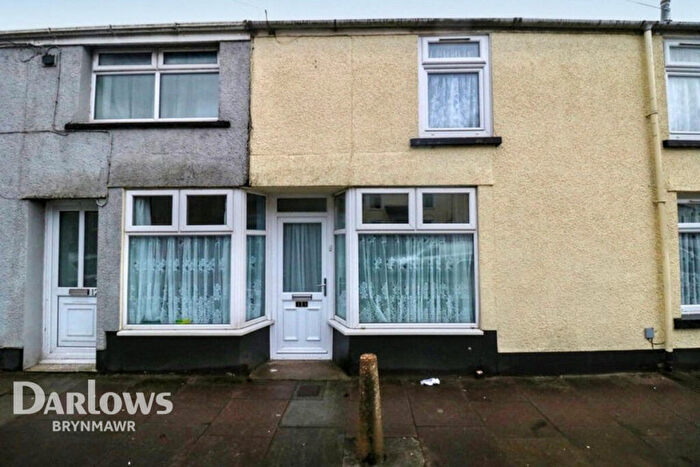
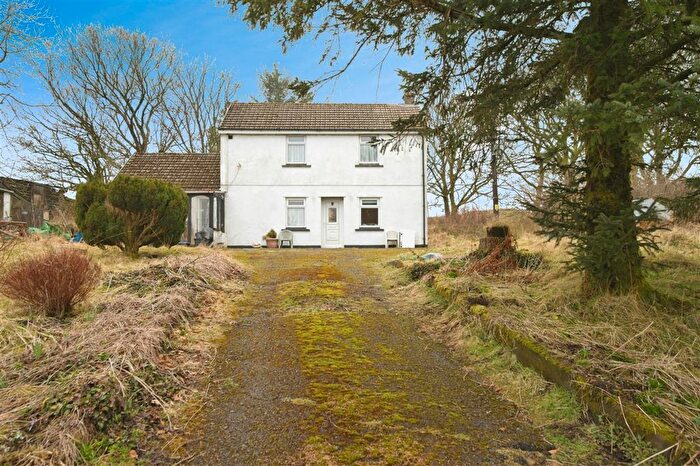
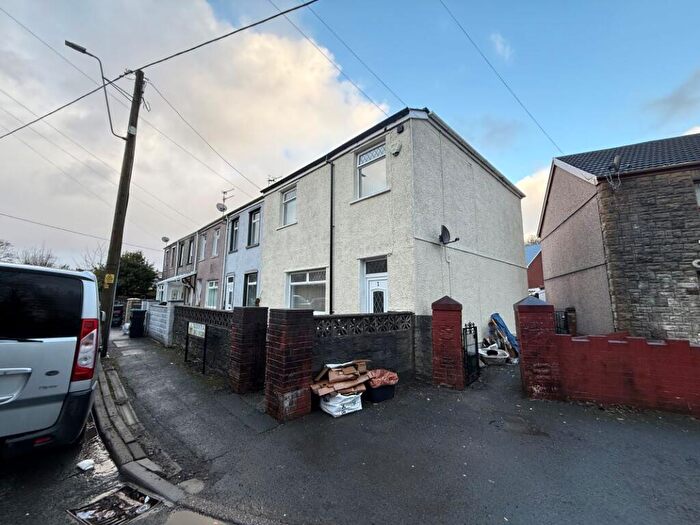
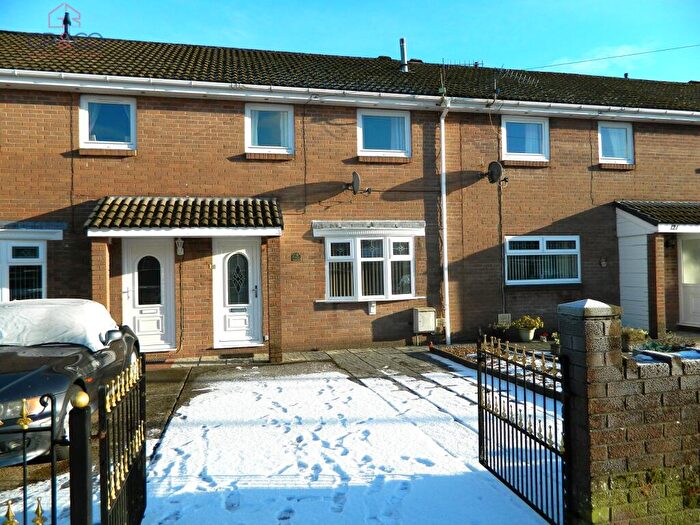
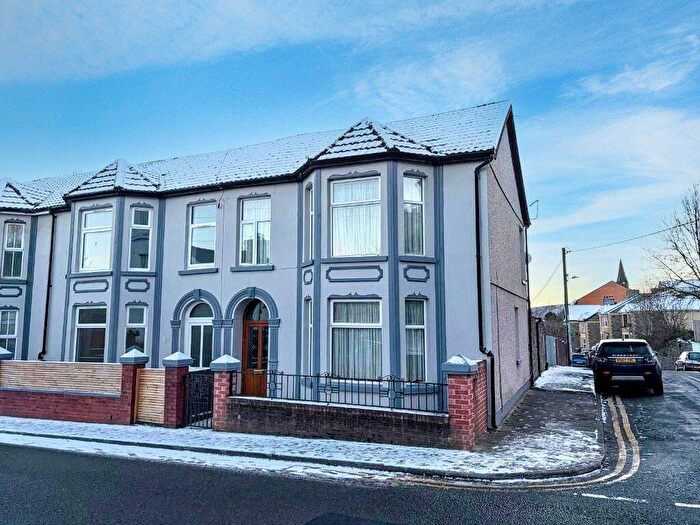
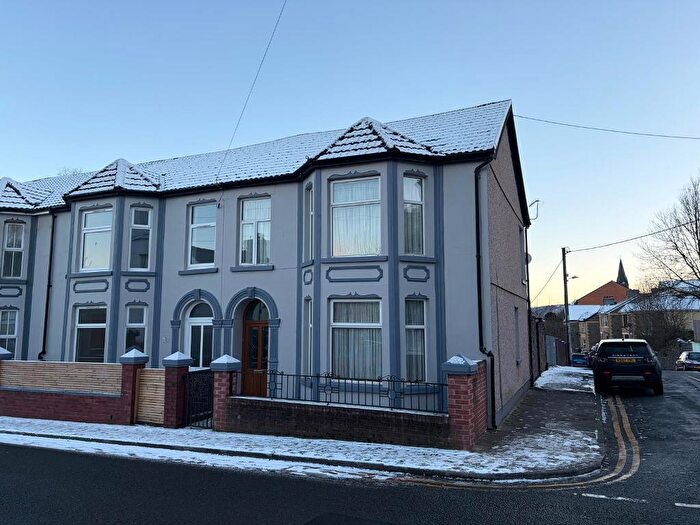
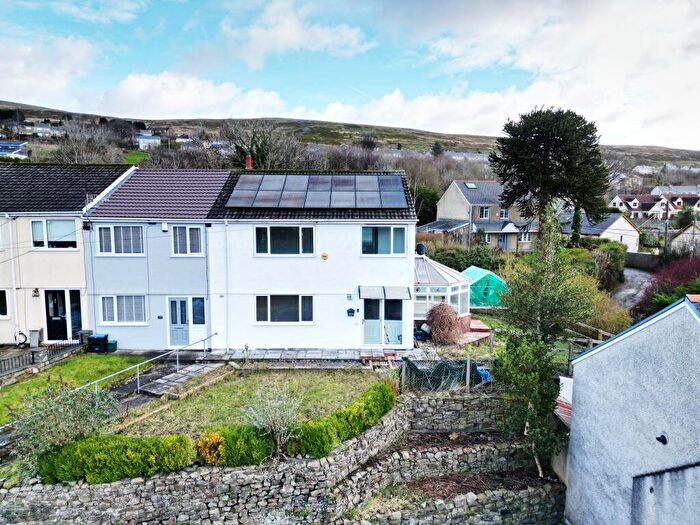
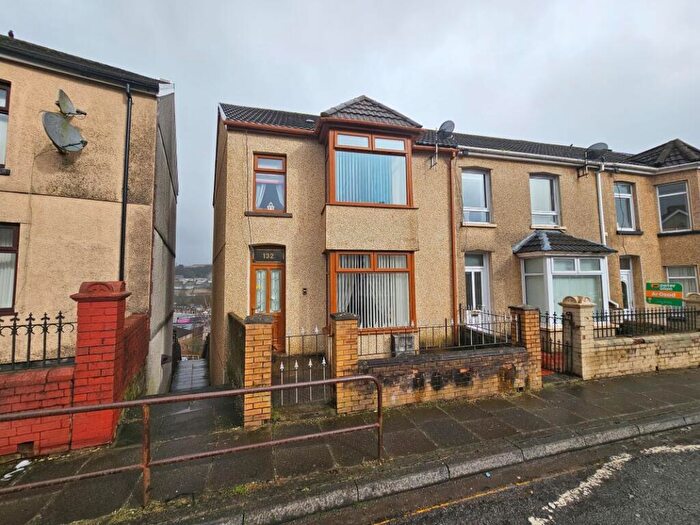
Properties for sale in Ebbw Vale
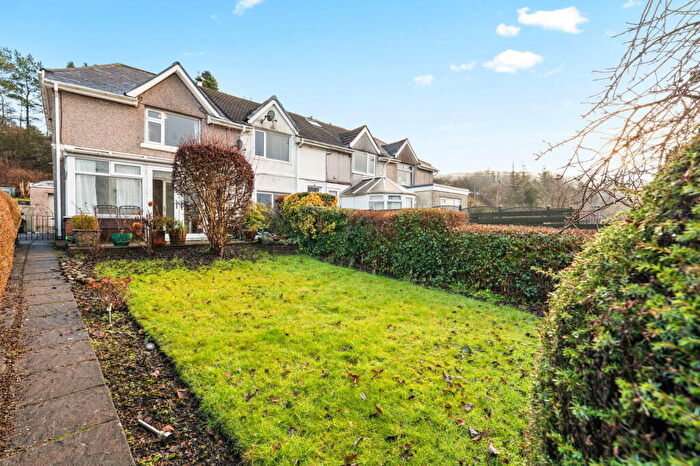
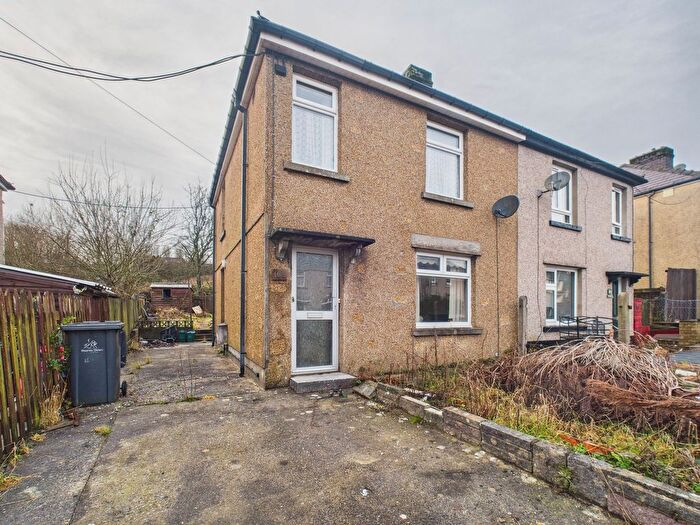
![]()
If you are looking to sell your house, let it out, or receive a property valuation, an expert can help you.
Click the button below to get started.

Neighbourhoods in Ebbw Vale
Navigate through our locations to find the location of your next house in Ebbw Vale, Blaenau Gwent - Blaenau Gwent for sale or to rent.
Transport in Ebbw Vale
Please see below transportation links in this area:
-
 Ebbw Vale Town Station
 -
Ebbw Vale Parkway Station
-
Rhymney Station
-
Pontlottyn Station
-
Tir-Phil Station
- FAQ
- Price Paid By Year
- Property Type Price
Frequently asked questions about Ebbw Vale
What is the average price for a property for sale in Ebbw Vale?
The average price for a property for sale in Ebbw Vale is £147,955. This amount is 7% higher than the average price in Blaenau Gwent - Blaenau Gwent. There are 3,570 property listings for sale in Ebbw Vale.
What locations have the most expensive properties for sale in Ebbw Vale?
The locations with the most expensive properties for sale in Ebbw Vale are Badminton at an average of £191,898, Beaufort at an average of £177,775 and Rassau at an average of £169,272.
What locations have the most affordable properties for sale in Ebbw Vale?
The locations with the most affordable properties for sale in Ebbw Vale are Ebbw Vale South at an average of £120,825, Ebbw Vale North at an average of £127,591 and Cwm at an average of £136,204.
Which train stations are available in or near Ebbw Vale?
Some of the train stations available in or near Ebbw Vale are Ebbw Vale Town, Ebbw Vale Parkway and Rhymney.
Property Price Paid in Ebbw Vale by Year
The average sold property price by year was:
| Year | Average Sold Price | Price Change |
Sold Properties
|
|---|---|---|---|
| 2025 | £149,454 | 1% |
252 Properties |
| 2024 | £147,335 | 2% |
353 Properties |
| 2023 | £143,973 | -5% |
365 Properties |
| 2022 | £150,524 | 14% |
504 Properties |
| 2021 | £129,874 | 8% |
596 Properties |
| 2020 | £118,939 | 2% |
408 Properties |
| 2019 | £116,676 | 11% |
455 Properties |
| 2018 | £103,858 | 3% |
461 Properties |
| 2017 | £100,279 | 6% |
416 Properties |
| 2016 | £94,742 | -0,1% |
417 Properties |
| 2015 | £94,829 | 4% |
395 Properties |
| 2014 | £91,412 | 9% |
361 Properties |
| 2013 | £83,188 | -7% |
314 Properties |
| 2012 | £88,819 | -4% |
253 Properties |
| 2011 | £92,682 | -3% |
239 Properties |
| 2010 | £95,333 | 1% |
234 Properties |
| 2009 | £94,033 | -5% |
239 Properties |
| 2008 | £99,176 | -6% |
259 Properties |
| 2007 | £105,474 | 4% |
492 Properties |
| 2006 | £100,778 | 7% |
543 Properties |
| 2005 | £93,678 | 16% |
465 Properties |
| 2004 | £79,002 | 31% |
516 Properties |
| 2003 | £54,236 | 9% |
531 Properties |
| 2002 | £49,213 | 19% |
548 Properties |
| 2001 | £39,845 | -2% |
414 Properties |
| 2000 | £40,838 | 0,1% |
409 Properties |
| 1999 | £40,803 | 4% |
479 Properties |
| 1998 | £39,272 | -1% |
356 Properties |
| 1997 | £39,670 | 11% |
403 Properties |
| 1996 | £35,355 | 5% |
349 Properties |
| 1995 | £33,523 | - |
264 Properties |
Property Price per Property Type in Ebbw Vale
Here you can find historic sold price data in order to help with your property search.
The average Property Paid Price for specific property types in the last three years are:
| Property Type | Average Sold Price | Sold Properties |
|---|---|---|
| Semi Detached House | £168,737.00 | 352 Semi Detached Houses |
| Detached House | £278,248.00 | 179 Detached Houses |
| Terraced House | £116,964.00 | 908 Terraced Houses |
| Flat | £76,585.00 | 35 Flats |