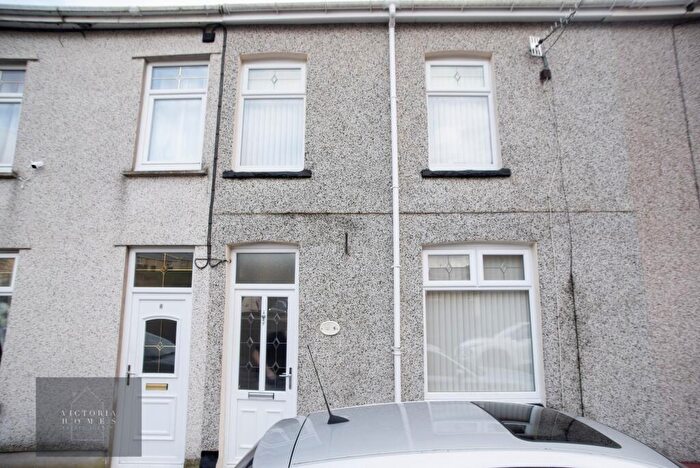
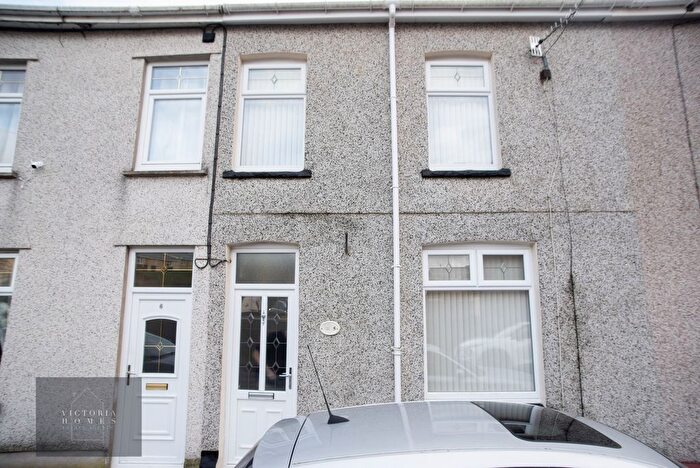
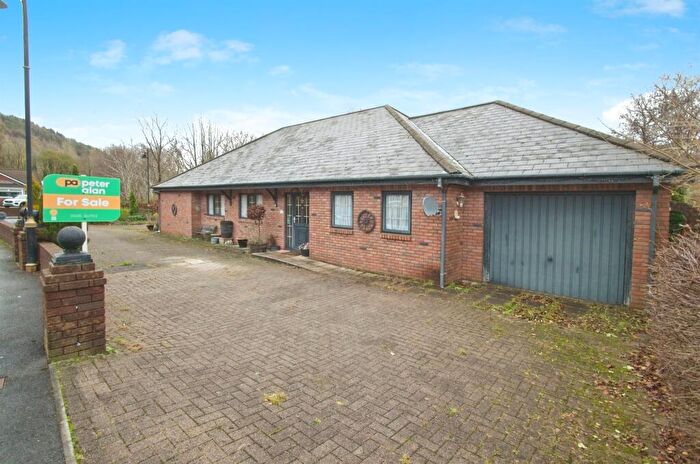
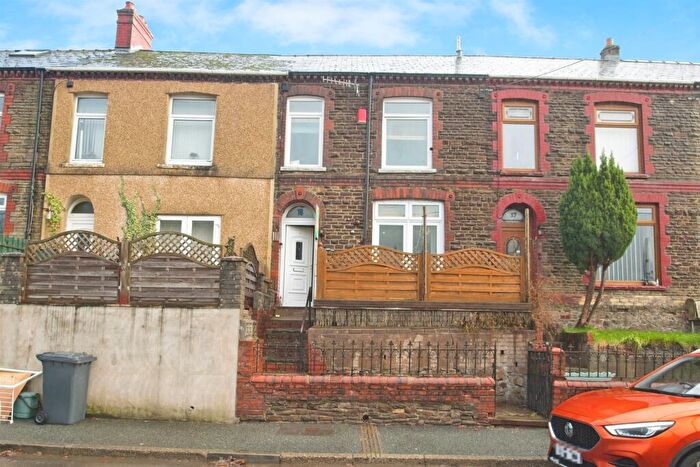
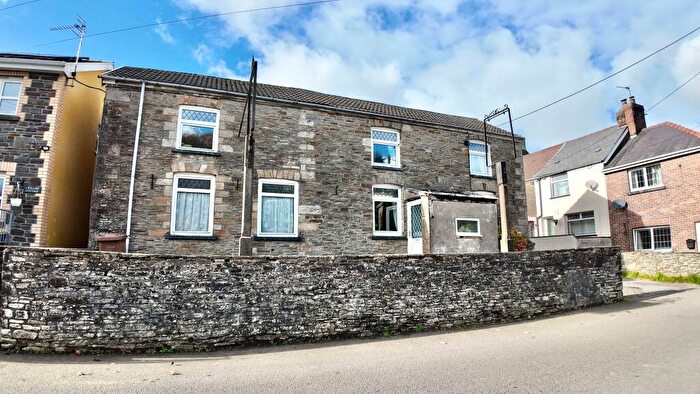
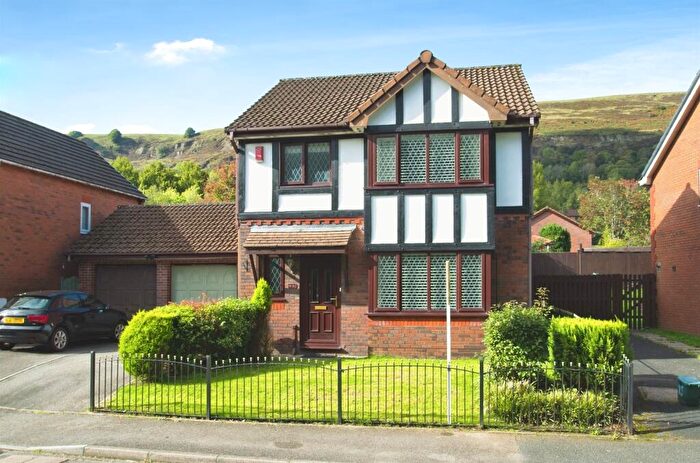
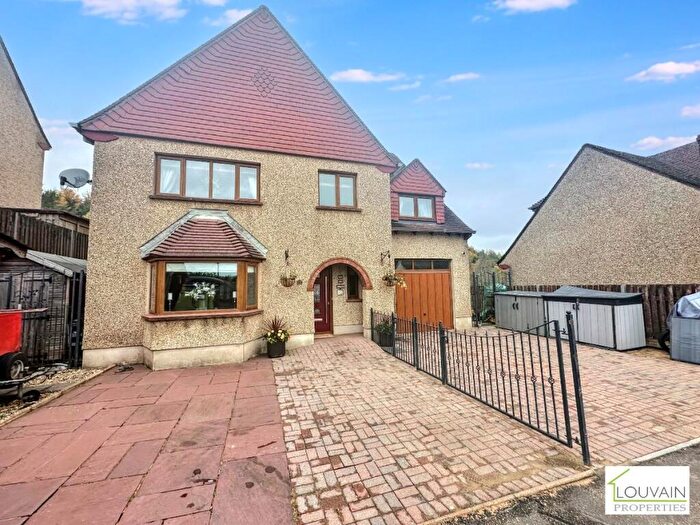
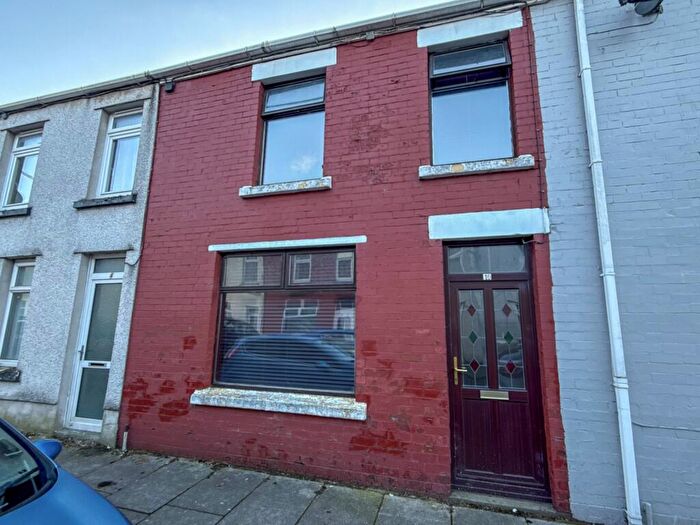
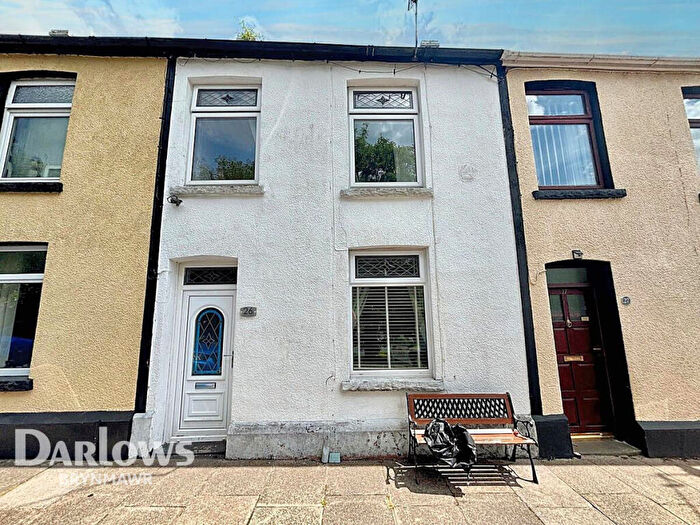
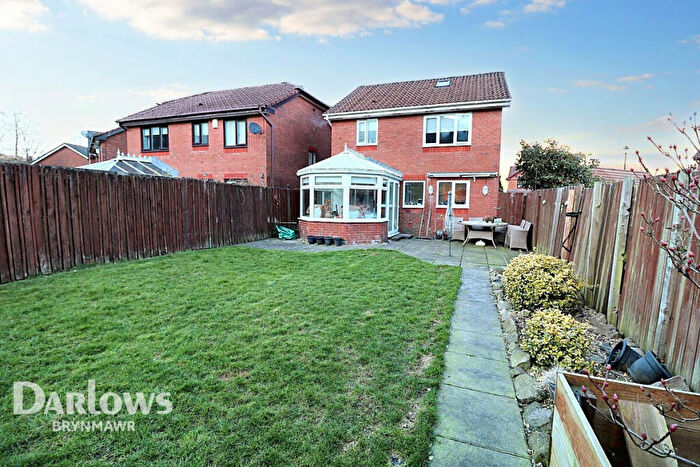
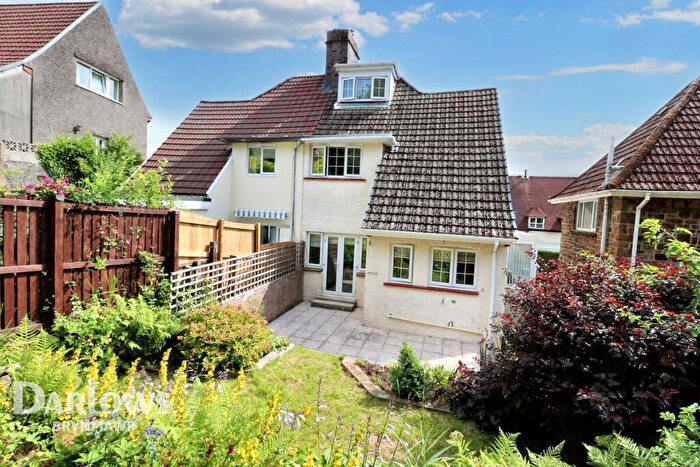
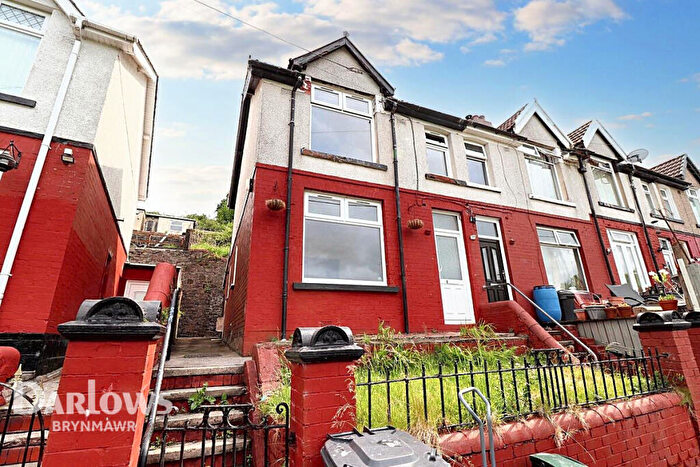
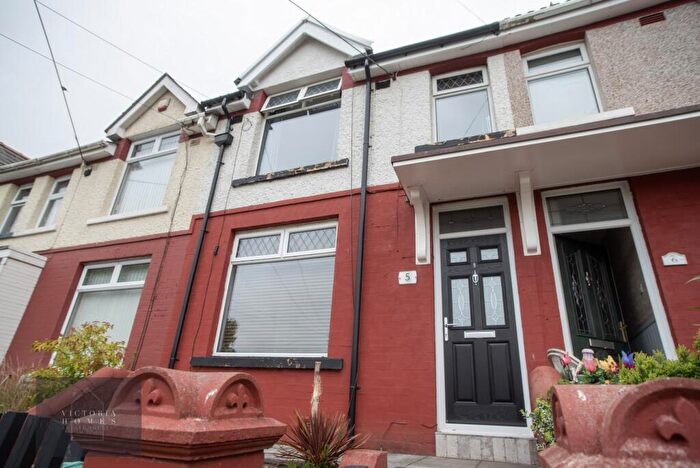
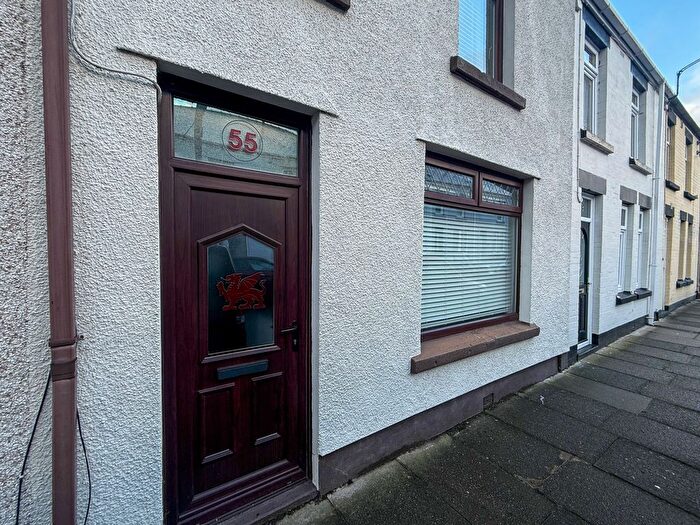
Houses for sale & to rent in Cwm, Ebbw Vale
House Prices in Cwm
Properties in Cwm have an average house price of £136,204.00 and had 251 Property Transactions within the last 3 years¹.
Cwm is an area in Ebbw Vale, Blaenau Gwent - Blaenau Gwent with 1,884 households², where the most expensive property was sold for £431,756.00.
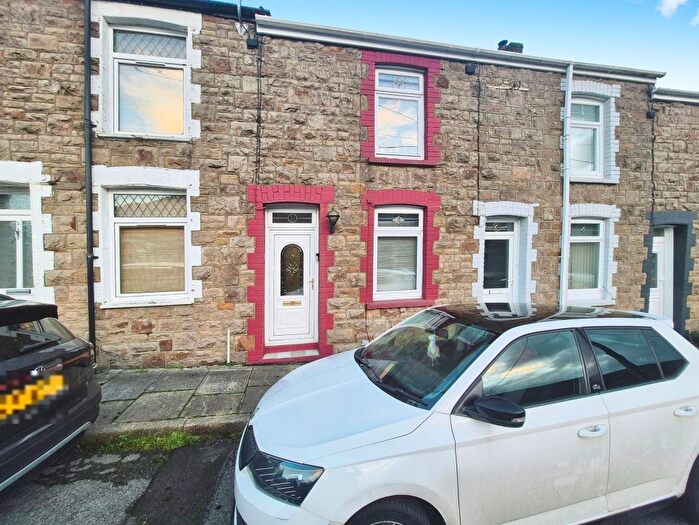
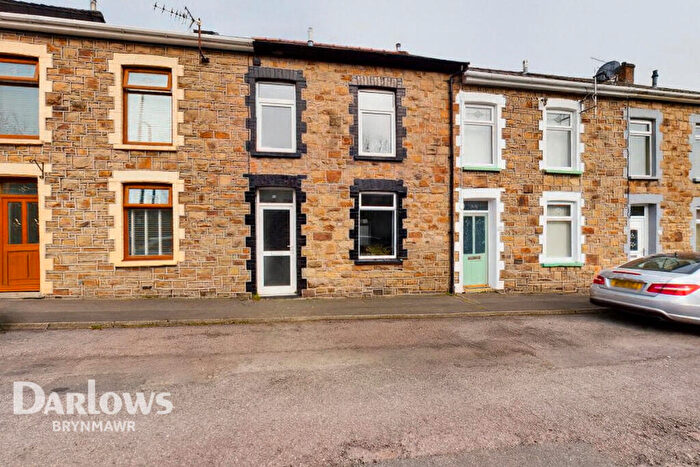
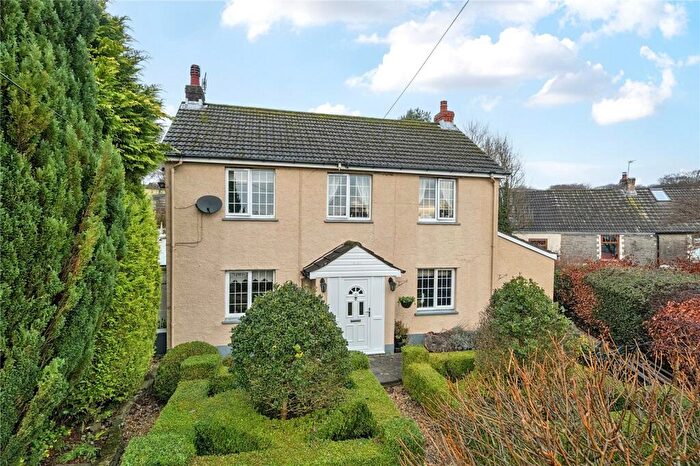
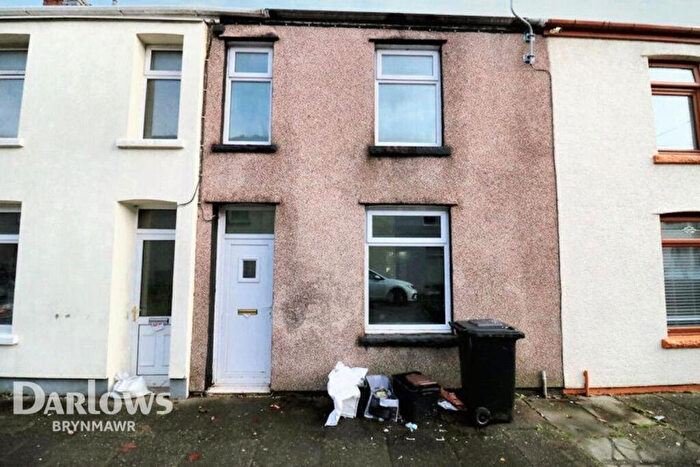
Properties for sale in Cwm
Previously listed properties in Cwm
Roads and Postcodes in Cwm
Navigate through our locations to find the location of your next house in Cwm, Ebbw Vale for sale or to rent.
| Streets | Postcodes |
|---|---|
| Acorn Villas | NP23 8AW |
| Ash Street | NP23 7RQ |
| Aubry Terrace | NP23 7SN |
| Augusta Park | NP23 8DN |
| Bailey Street | NP23 7RT |
| Beech Grove | NP23 8WQ |
| Brecon Heights | NP23 8WP |
| Brighton Terrace | NP23 7QX |
| Brook Place | NP23 7QZ |
| Bryn Terrace | NP23 6TZ |
| Brynhyfryd Terrace | NP23 6TW |
| Canning Street | NP23 7RD NP23 7RH NP23 7RN NP23 7RW |
| Carne Street | NP23 7RJ |
| Cendl Terrace | NP23 7RX |
| Clos Hen Ysgol | NP23 6FA |
| Coed Y Garn | NP23 6NF |
| Cools Close | NP23 7RY |
| Crosscombe Terrace | NP23 7SP NP23 7SW NP23 7SB |
| Curre Street | NP23 7RA NP23 7RB NP23 7RE NP23 7RF |
| Cwm Road | NP23 6TR NP23 7PY |
| Cwm Small Business Centre | NP23 7TB |
| Cwm Terrace | NP23 7RR |
| Dyffryn Road | NP23 6UA |
| Dyffryn Villas | NP23 7TD |
| Elm Street | NP23 7RG |
| Emlyn Road | NP23 7RZ |
| Excelsior Street | NP23 6TT NP23 6TU |
| Falcon Terrace | NP23 7SA |
| Festival Park Factory Outlet Shopping Centre | NP23 8FP |
| Garn Terrace | NP23 6TX |
| Glan Ebbw Terrace | NP23 8AP |
| Graig Terrace | NP23 7TF |
| Green Street | NP23 8WR |
| Hafod Lane | NP23 8AS |
| Hall Street | NP23 6AT |
| Hall Street Industrial Estate | NP23 8UF |
| Hillside Terrace | NP23 6TY |
| Howards Way | NP23 8AX |
| Itton Street | NP23 7RP |
| King Street | NP23 7SG NP23 7SJ NP23 7SQ |
| Marine Street | NP23 7SS NP23 7ST NP23 7SU NP23 7SX NP23 7SY NP23 7SZ NP23 7TA NP23 7WJ NP23 7WL |
| Mill Terrace | NP23 7SR |
| Mountain View | NP23 7SF |
| New Cwm Terrace | NP23 7RS |
| New Victoria | NP23 7SH |
| Oak Street | NP23 7RL |
| Park Place | NP23 6TP |
| Park View | NP23 6UB NP23 6UD |
| Railway Terrace | NP23 7SE |
| River Row | NP23 7TJ |
| School Terrace | NP23 7QY |
| Stanfield Street | NP23 7TG NP23 7TQ |
| Station Road | NP23 6TN |
| Station Terrace | NP23 7SD |
| Stewart Street | NP23 7TE |
| The Boulevard | NP23 8BR |
| Victoria Avenue | NP23 8AY |
| Victoria Business Park | NP23 8AN NP23 8ER |
| Village Lane | NP23 8AR |
| William Street | NP23 7TH |
| Woodville Road | NP23 7RU |
| York Terrace | NP23 7SL |
| NP23 8AU NP23 6PZ NP23 7TL |
Transport near Cwm
-
Ebbw Vale Parkway Station
-
Ebbw Vale Town Station
-
Brithdir Station
-
Tir-Phil Station
-
Llanhilleth Station
-
Pontlottyn Station
-
Bargoed Station
-
Rhymney Station
-
Gilfach Fargoed Station
- FAQ
- Price Paid By Year
- Property Type Price
Frequently asked questions about Cwm
What is the average price for a property for sale in Cwm?
The average price for a property for sale in Cwm is £136,204. This amount is 8% lower than the average price in Ebbw Vale. There are 371 property listings for sale in Cwm.
What streets have the most expensive properties for sale in Cwm?
The streets with the most expensive properties for sale in Cwm are Beech Grove at an average of £375,583, Coed Y Garn at an average of £320,000 and Howards Way at an average of £313,500.
What streets have the most affordable properties for sale in Cwm?
The streets with the most affordable properties for sale in Cwm are York Terrace at an average of £79,666, Graig Terrace at an average of £81,000 and Stanfield Street at an average of £84,312.
Which train stations are available in or near Cwm?
Some of the train stations available in or near Cwm are Ebbw Vale Parkway, Ebbw Vale Town and Brithdir.
Property Price Paid in Cwm by Year
The average sold property price by year was:
| Year | Average Sold Price | Price Change |
Sold Properties
|
|---|---|---|---|
| 2025 | £143,478 | 7% |
37 Properties |
| 2024 | £133,869 | 3% |
69 Properties |
| 2023 | £129,324 | -9% |
69 Properties |
| 2022 | £141,029 | 27% |
76 Properties |
| 2021 | £103,329 | 30% |
102 Properties |
| 2020 | £72,154 | -29% |
55 Properties |
| 2019 | £93,236 | -0,3% |
51 Properties |
| 2018 | £93,486 | 2% |
73 Properties |
| 2017 | £91,477 | 15% |
67 Properties |
| 2016 | £77,435 | -3% |
57 Properties |
| 2015 | £79,855 | -2% |
68 Properties |
| 2014 | £81,265 | 16% |
52 Properties |
| 2013 | £68,285 | -9% |
47 Properties |
| 2012 | £74,696 | -7% |
28 Properties |
| 2011 | £79,680 | -37% |
23 Properties |
| 2010 | £109,014 | 25% |
24 Properties |
| 2009 | £82,215 | -6% |
45 Properties |
| 2008 | £86,739 | -7% |
41 Properties |
| 2007 | £92,758 | -9% |
93 Properties |
| 2006 | £101,256 | 17% |
90 Properties |
| 2005 | £83,861 | 15% |
69 Properties |
| 2004 | £71,015 | 39% |
90 Properties |
| 2003 | £43,505 | -37% |
103 Properties |
| 2002 | £59,808 | 39% |
117 Properties |
| 2001 | £36,211 | -11% |
81 Properties |
| 2000 | £40,204 | -7% |
80 Properties |
| 1999 | £42,874 | 4% |
117 Properties |
| 1998 | £41,083 | -12% |
86 Properties |
| 1997 | £45,948 | 16% |
62 Properties |
| 1996 | £38,737 | 9% |
79 Properties |
| 1995 | £35,355 | - |
48 Properties |
Property Price per Property Type in Cwm
Here you can find historic sold price data in order to help with your property search.
The average Property Paid Price for specific property types in the last three years are:
| Property Type | Average Sold Price | Sold Properties |
|---|---|---|
| Semi Detached House | £181,819.00 | 21 Semi Detached Houses |
| Detached House | £298,889.00 | 36 Detached Houses |
| Terraced House | £100,254.00 | 193 Terraced Houses |
| Flat | £260,000.00 | 1 Flat |

