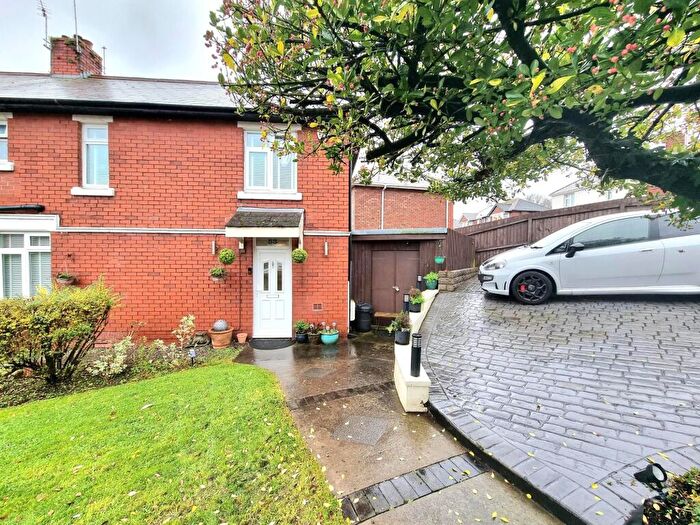
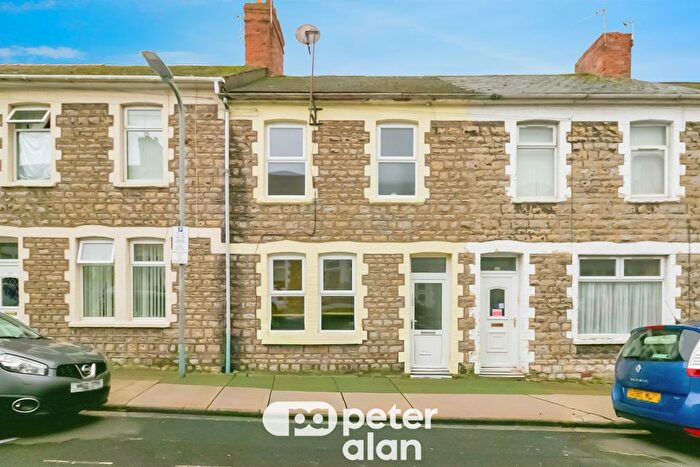
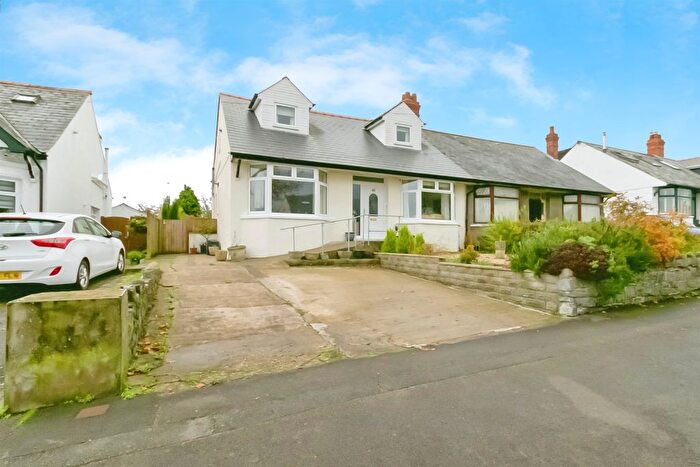
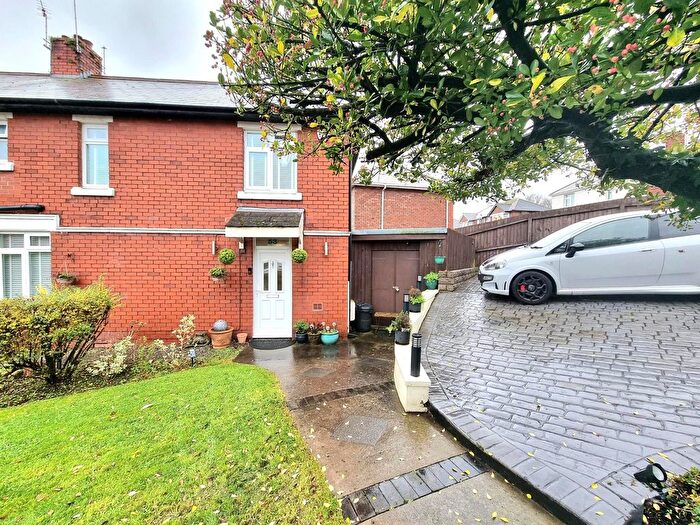
Houses for sale & to rent in Dyfan, Barry
House Prices in Dyfan
Properties in Dyfan have an average house price of £276,066.00 and had 194 Property Transactions within the last 3 years¹.
Dyfan is an area in Barry, Bro Morgannwg - the Vale of Glamorgan with 2,159 households², where the most expensive property was sold for £680,000.00.
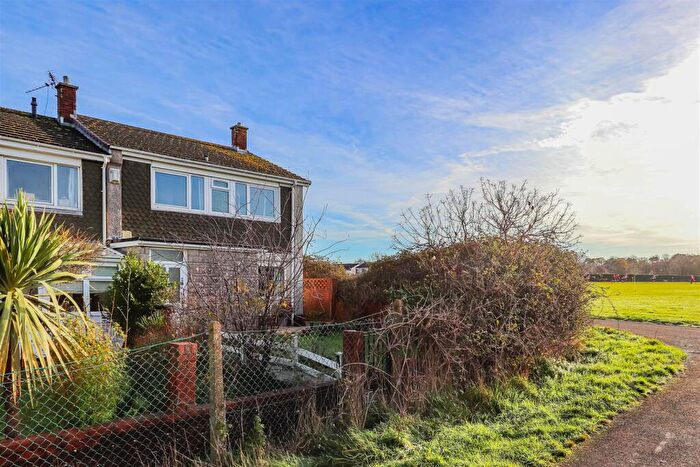
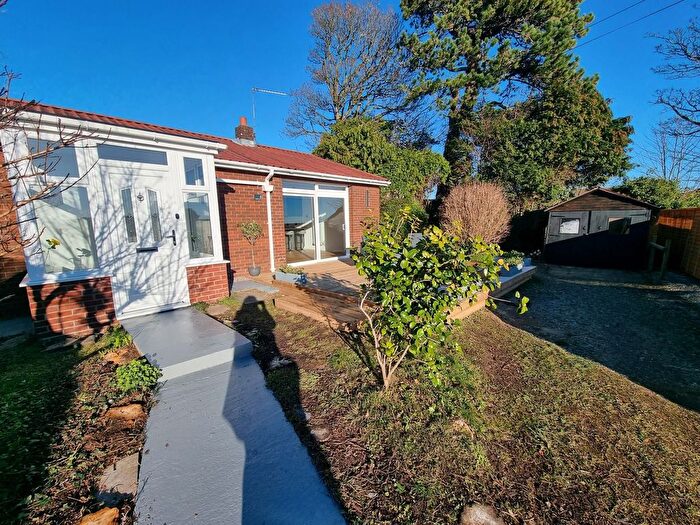
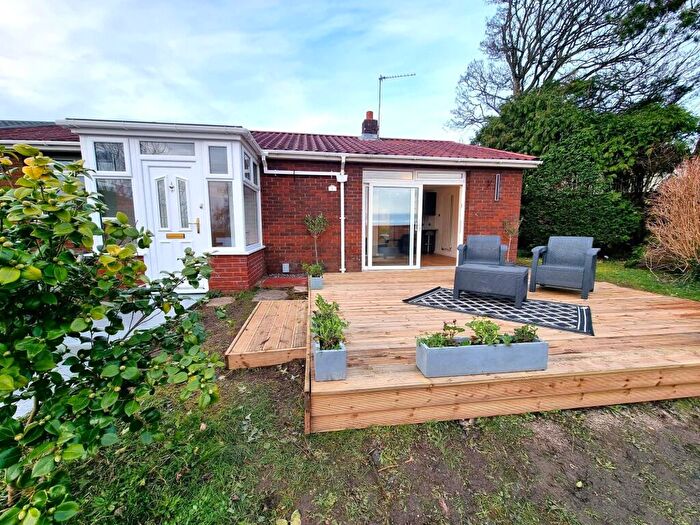
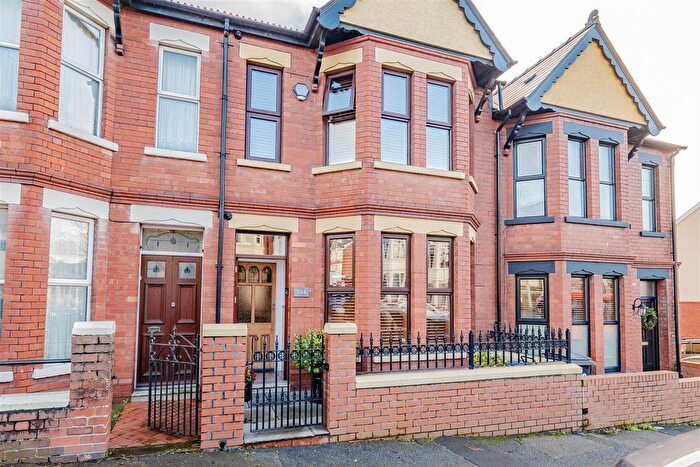
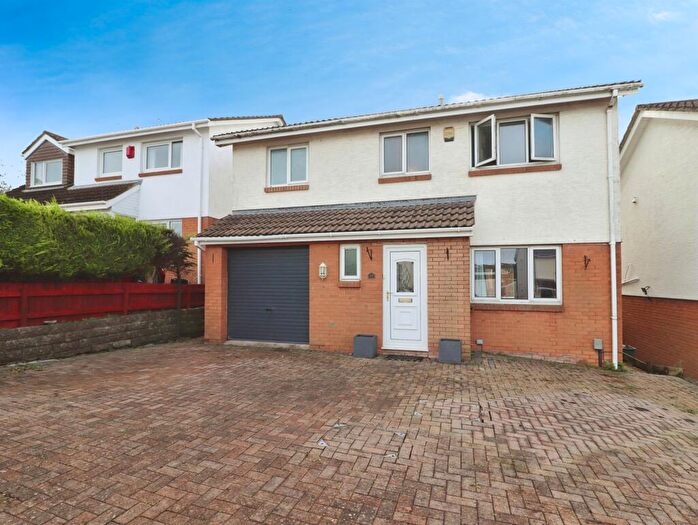
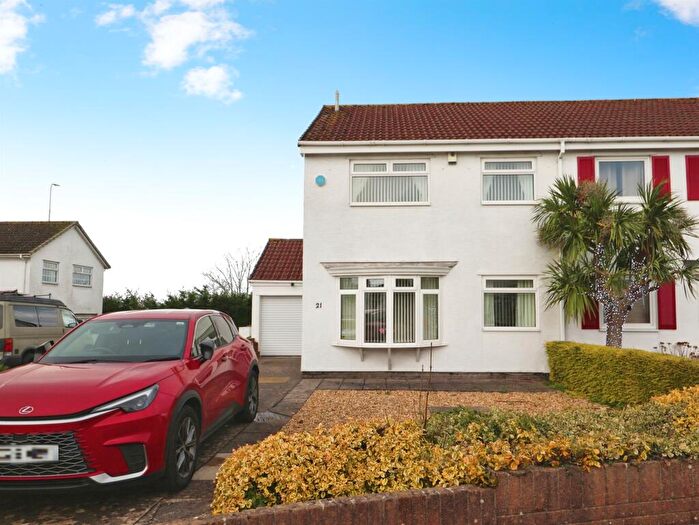
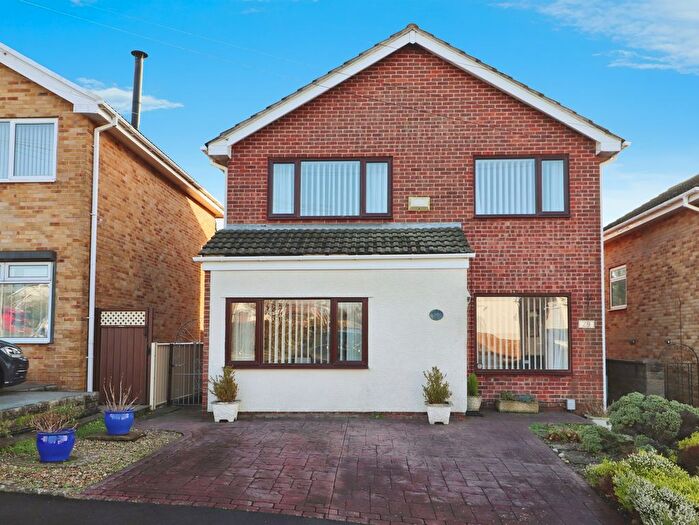
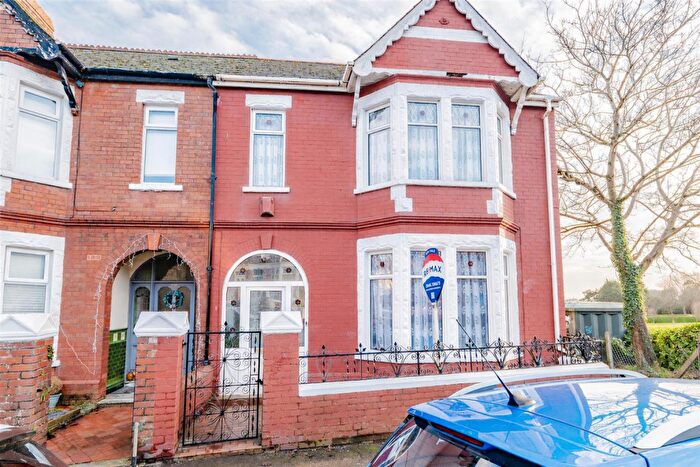
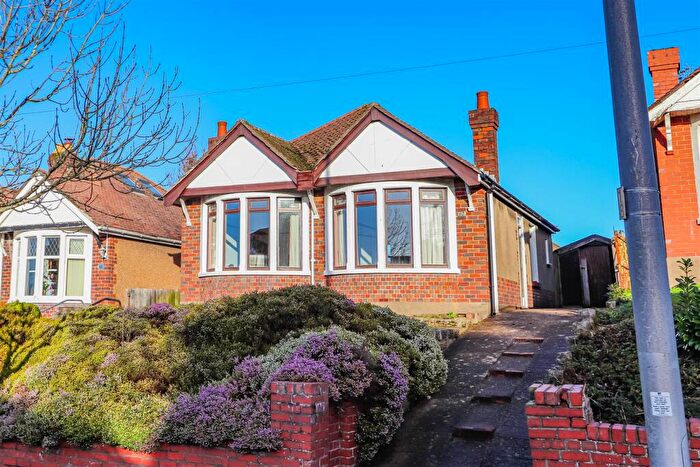
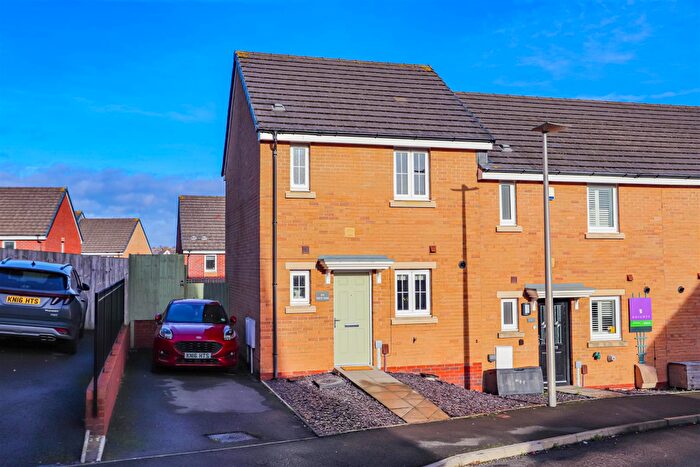
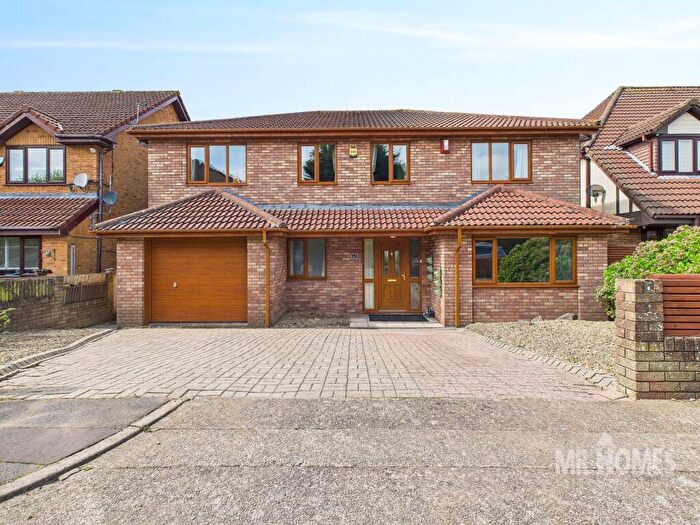
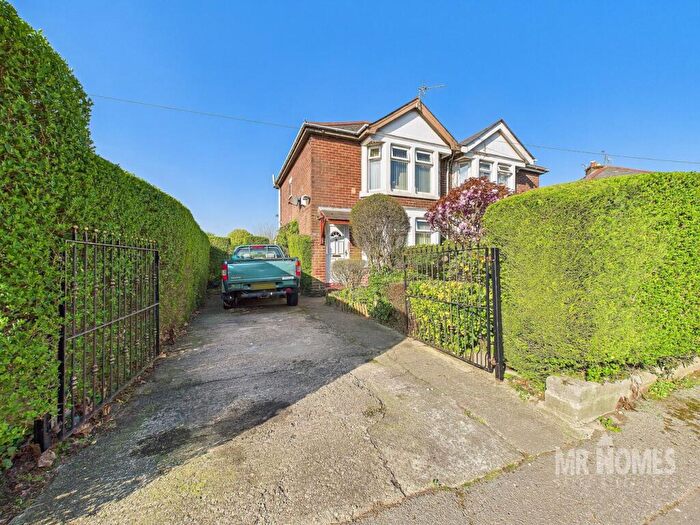
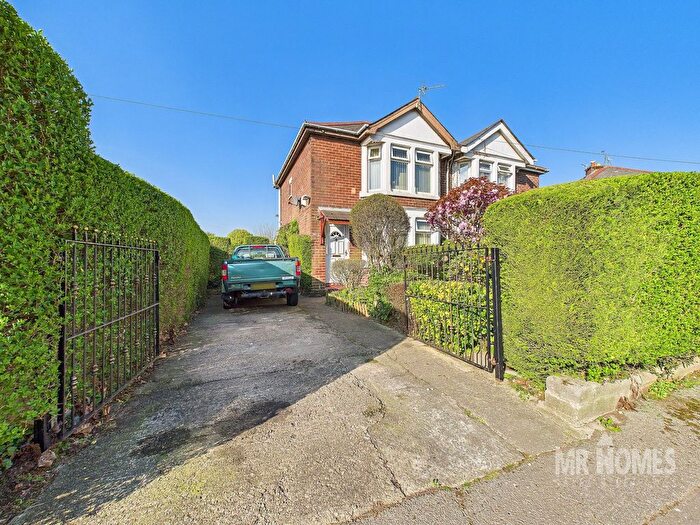
Properties for sale in Dyfan
Roads and Postcodes in Dyfan
Navigate through our locations to find the location of your next house in Dyfan, Barry for sale or to rent.
| Streets | Postcodes |
|---|---|
| Andover Close | CF62 8AG |
| Baird Rise | CF62 7UG |
| Balmoral Court | CF62 8AU |
| Barrians Way | CF62 8JG |
| Barry Road | CF62 8BJ CF62 8HF CF62 8HG CF62 8HH |
| Beaumont Close | CF62 8AP |
| Blenheim Close | CF62 8AN |
| Borough Avenue | CF62 9UU CF62 9UW |
| Brynhill Close | CF62 8PL |
| Buckingham Place | CF62 8AT |
| Buttrills Road | CF62 8EH |
| Buttrills Walk | CF62 8BZ CF62 8DG |
| Caernarvon Gardens | CF62 9XJ CF62 9XL |
| Cambourne Close | CF62 8AL |
| Cemetery Approach Road | CF62 8BP |
| Charter Avenue | CF62 9UX |
| Coed Bach | CF62 8AE |
| Coed Mawr | CF62 8AD |
| Coed Y Capel | CF62 8AF |
| Colcot Road | CF62 8HJ CF62 8HL CF62 8HN CF62 8HP CF62 8UH CF62 8UJ CF62 8UL CF62 8YG CF62 8YH |
| Coleridge Crescent | CF62 9TT CF62 9TX |
| College Fields Close | CF62 8LF |
| Dyffryn Place | CF62 8UN |
| East Walk | CF62 8DA |
| Glen Affric Close | CF62 8JB |
| Great Brynhill Lane | CF62 8QB |
| Greenfield Road | CF62 8UP |
| Griffin Close | CF62 8BH |
| Harlech Gardens | CF62 9XN |
| Heathfield Drive | CF62 9UG |
| Hellas Drive | CF62 8AW |
| Highfield Road | CF62 8UQ |
| Highlight Lane | CF62 8AA |
| Hinchsliff Avenue | CF62 9UR CF62 9US |
| Hollyrood Close | CF62 8AX CF62 8AY |
| Kent Green | CF62 8EP |
| Lakin Drive | CF62 8AH CF62 8AJ |
| Little Brynhill Lane | CF62 8PN |
| Lloyd Avenue | CF62 8BT |
| Meggitt Road | CF62 9UT |
| Munro Place | CF62 8BU |
| Neale Street | CF62 8ES |
| North Walk | CF62 8BW CF62 8BX CF62 8DF |
| Oakfield Road | CF62 8PR |
| Pembroke Place | CF62 8BG |
| Pleasant View | CF62 9QA |
| Poets Field Road | CF62 9TY |
| Port Road East | CF62 9PT CF62 9PU CF62 9PY |
| Port Road West | CF62 8PP CF62 8PQ |
| Ridgeway Road | CF62 8PS |
| Rutland Close | CF62 8AR |
| Sandringham Close | CF62 8BD |
| Sherbourne Close | CF62 8AQ |
| Somerset Road East | CF63 1BG |
| South Walk | CF62 8DB |
| St Andrews Road | CF62 8BR |
| St Fagans Avenue | CF62 8BS |
| St Teilo Avenue | CF62 8BQ |
| The Pastures | CF62 9ET |
| Tynewydd Road | CF62 8BB |
| Vale View | CF62 9XY |
| West Walk | CF62 8BY CF62 8DE |
| White Farm | CF62 9EU |
| Whitewell Road | CF62 9TU CF62 9TW |
| Winston Road | CF62 9ST CF62 9SU CF62 9SW CF62 9SX |
| Woodham Close | CF62 8JD |
| Woodham Park | CF62 8FJ CF62 8JF |
| CF62 9EW |
Transport near Dyfan
- FAQ
- Price Paid By Year
- Property Type Price
Frequently asked questions about Dyfan
What is the average price for a property for sale in Dyfan?
The average price for a property for sale in Dyfan is £276,066. This amount is 16% higher than the average price in Barry. There are 1,170 property listings for sale in Dyfan.
What streets have the most expensive properties for sale in Dyfan?
The streets with the most expensive properties for sale in Dyfan are Highlight Lane at an average of £432,500, Oakfield Road at an average of £378,500 and Port Road East at an average of £377,010.
What streets have the most affordable properties for sale in Dyfan?
The streets with the most affordable properties for sale in Dyfan are College Fields Close at an average of £180,816, South Walk at an average of £192,500 and The Pastures at an average of £200,300.
Which train stations are available in or near Dyfan?
Some of the train stations available in or near Dyfan are Barry, Barry Docks and Cadoxton.
Property Price Paid in Dyfan by Year
The average sold property price by year was:
| Year | Average Sold Price | Price Change |
Sold Properties
|
|---|---|---|---|
| 2025 | £268,929 | -5% |
32 Properties |
| 2024 | £281,161 | 5% |
60 Properties |
| 2023 | £268,107 | -5% |
42 Properties |
| 2022 | £280,348 | 11% |
60 Properties |
| 2021 | £250,261 | 10% |
63 Properties |
| 2020 | £225,619 | 10% |
56 Properties |
| 2019 | £202,045 | -2% |
75 Properties |
| 2018 | £206,936 | 11% |
77 Properties |
| 2017 | £184,518 | -0,2% |
94 Properties |
| 2016 | £184,957 | -7% |
85 Properties |
| 2015 | £197,249 | 16% |
106 Properties |
| 2014 | £165,588 | 1% |
142 Properties |
| 2013 | £163,987 | 3% |
79 Properties |
| 2012 | £158,396 | -3% |
41 Properties |
| 2011 | £162,451 | -17% |
49 Properties |
| 2010 | £189,836 | 21% |
51 Properties |
| 2009 | £150,169 | -9% |
39 Properties |
| 2008 | £163,220 | 0,2% |
27 Properties |
| 2007 | £162,878 | 8% |
93 Properties |
| 2006 | £149,486 | 12% |
104 Properties |
| 2005 | £132,163 | -1% |
67 Properties |
| 2004 | £133,530 | 21% |
81 Properties |
| 2003 | £104,827 | 19% |
99 Properties |
| 2002 | £84,408 | 18% |
99 Properties |
| 2001 | £69,353 | 12% |
97 Properties |
| 2000 | £61,191 | -3% |
82 Properties |
| 1999 | £62,971 | 16% |
109 Properties |
| 1998 | £53,122 | -5% |
83 Properties |
| 1997 | £55,850 | 5% |
88 Properties |
| 1996 | £52,852 | 0,1% |
63 Properties |
| 1995 | £52,795 | - |
61 Properties |
Property Price per Property Type in Dyfan
Here you can find historic sold price data in order to help with your property search.
The average Property Paid Price for specific property types in the last three years are:
| Property Type | Average Sold Price | Sold Properties |
|---|---|---|
| Semi Detached House | £259,121.00 | 119 Semi Detached Houses |
| Detached House | £352,474.00 | 43 Detached Houses |
| Terraced House | £242,833.00 | 30 Terraced Houses |
| Flat | £139,975.00 | 2 Flats |

