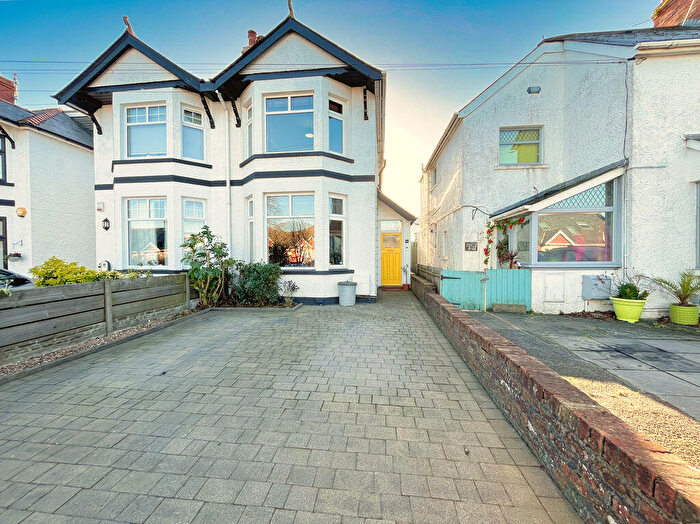
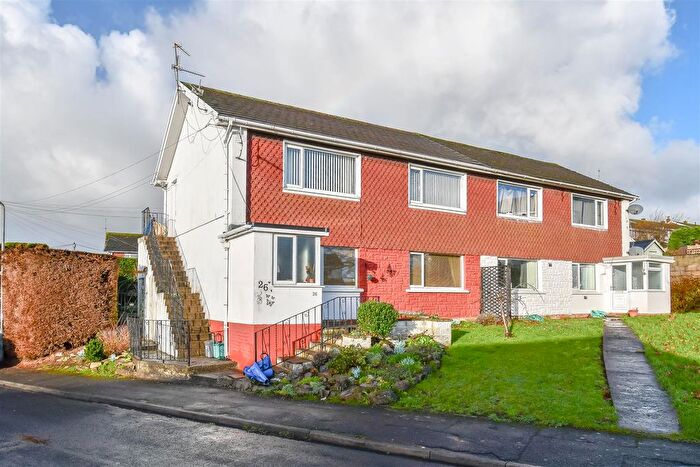
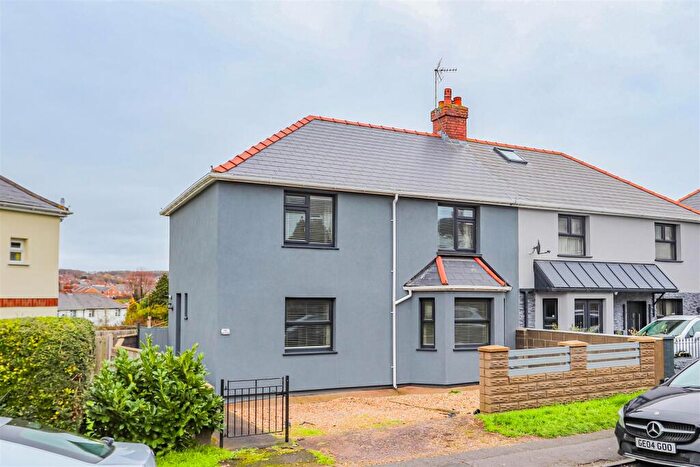
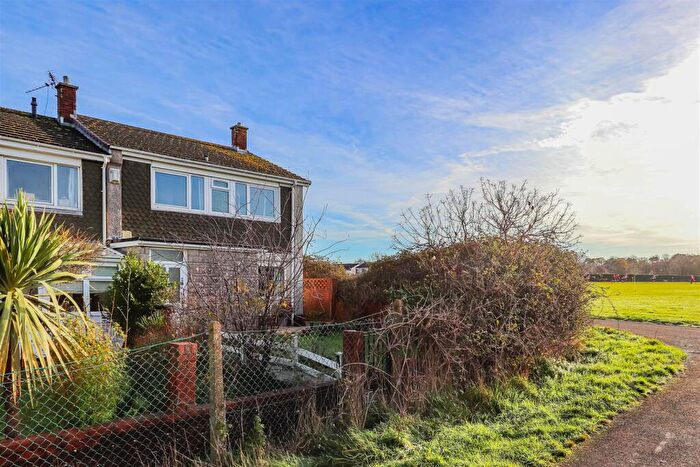
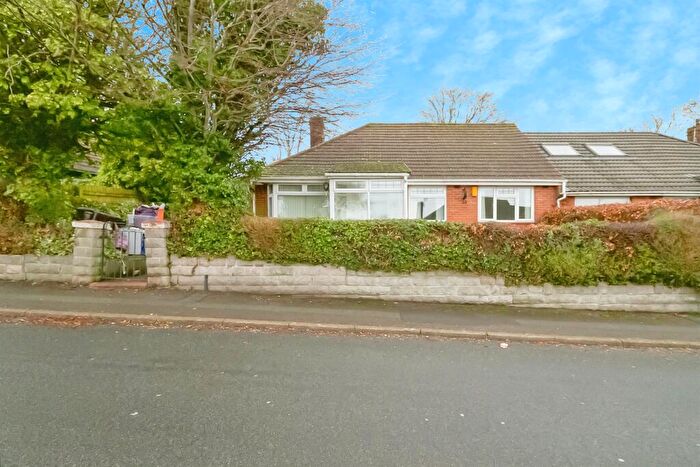
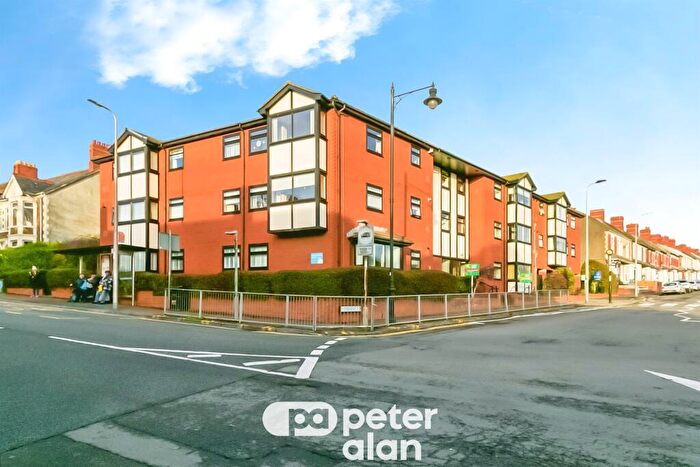
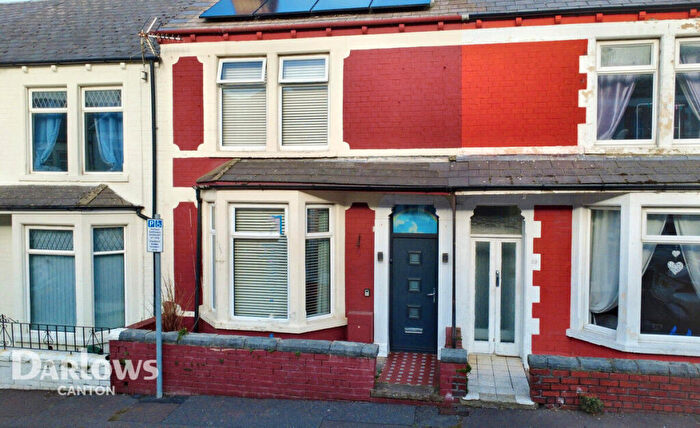
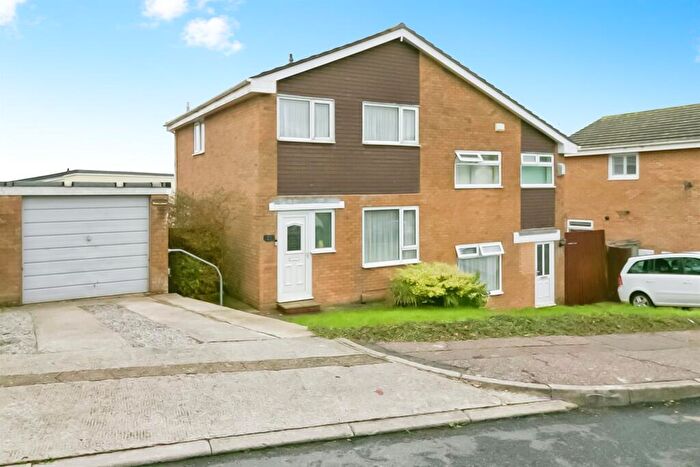
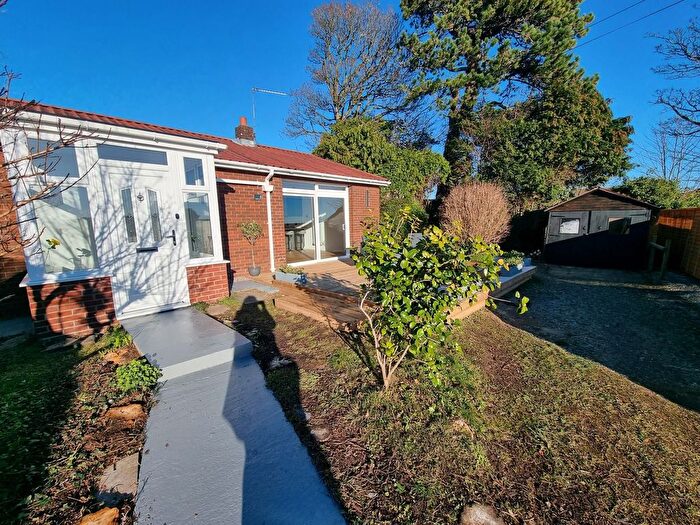
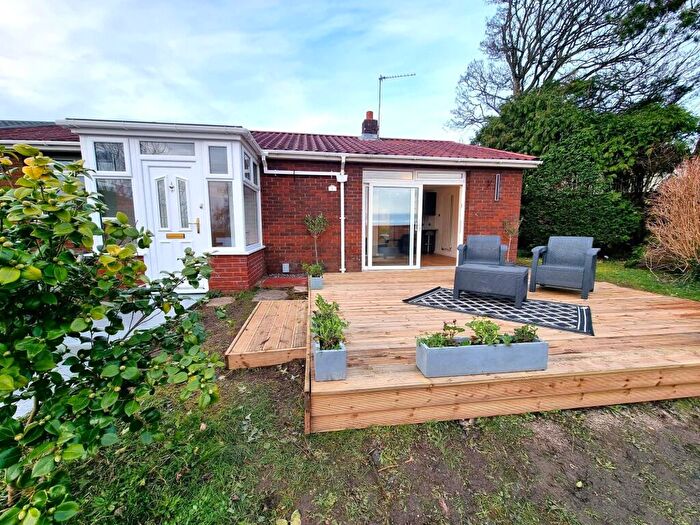
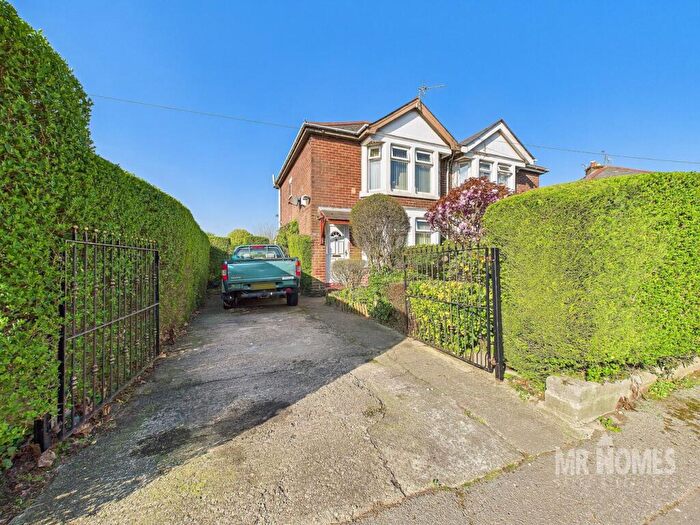
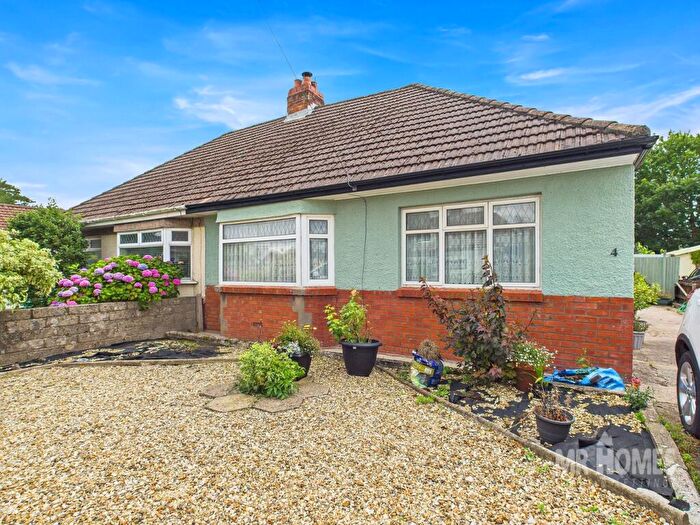
Houses for sale & to rent in Gibbonsdown, Barry
House Prices in Gibbonsdown
Properties in Gibbonsdown have an average house price of £205,092.00 and had 184 Property Transactions within the last 3 years¹.
Gibbonsdown is an area in Barry, Bro Morgannwg - the Vale of Glamorgan with 2,377 households², where the most expensive property was sold for £500,000.00.
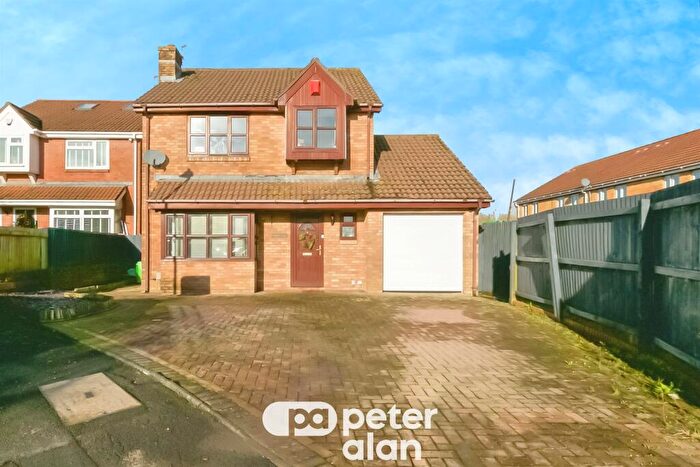
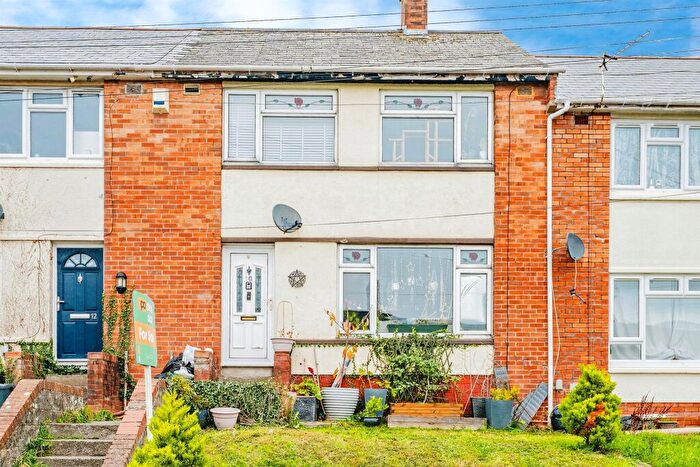
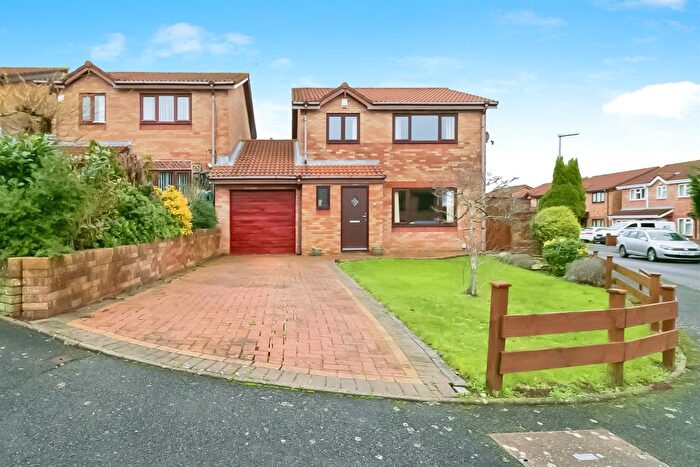
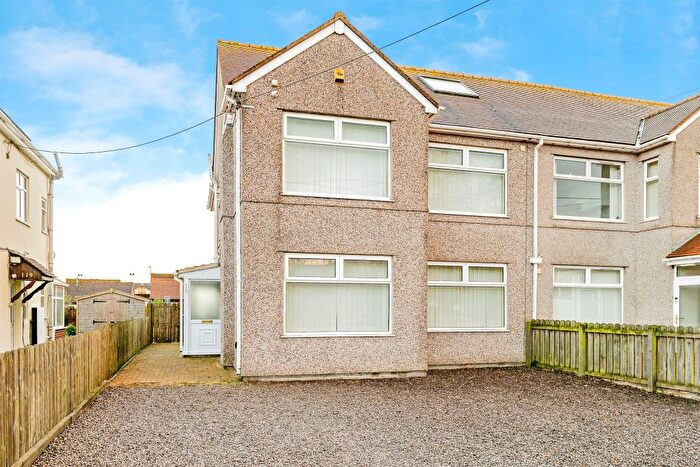
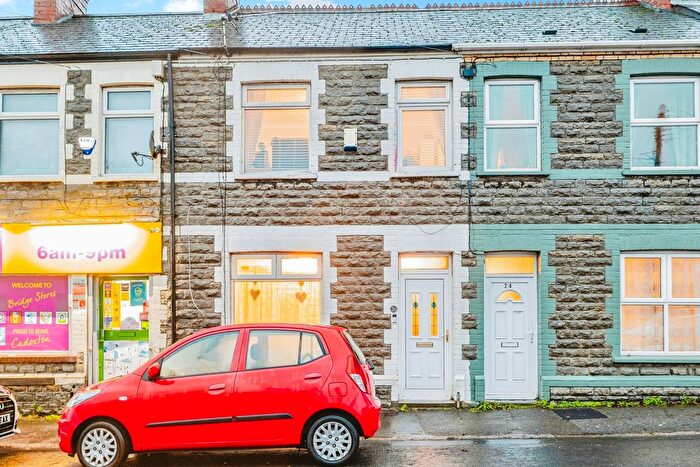
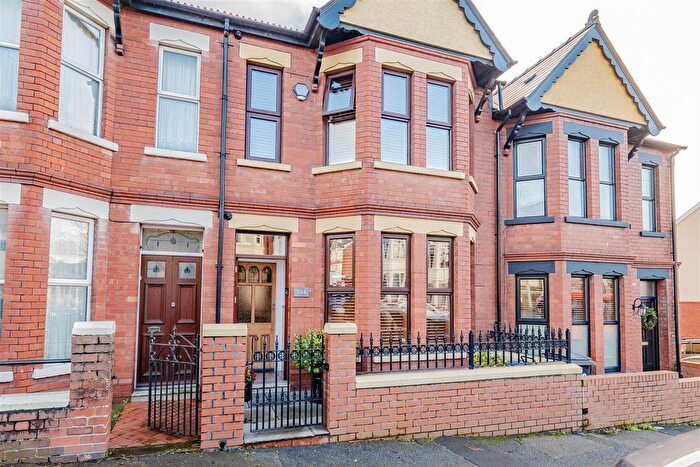
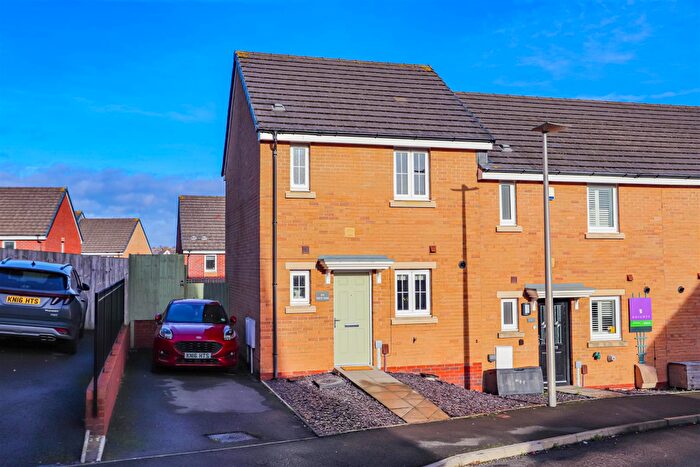
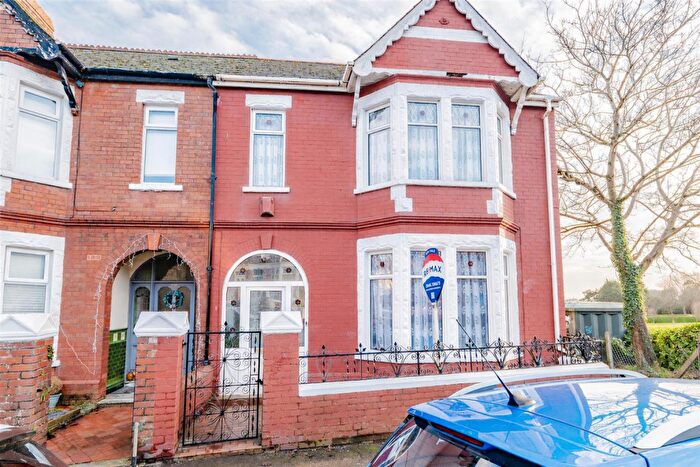
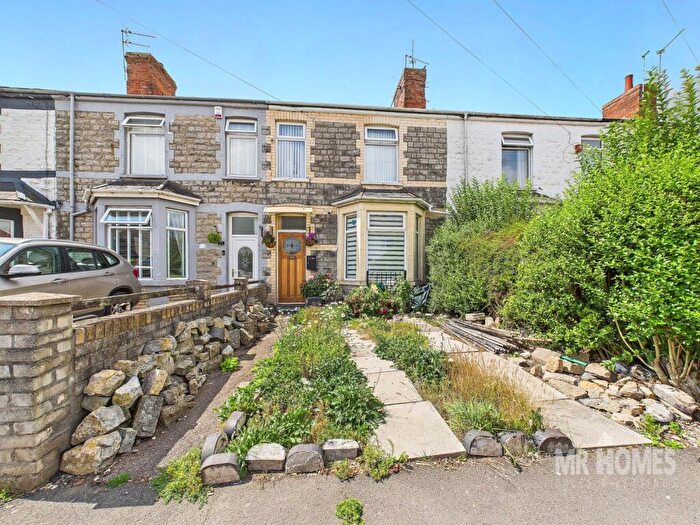
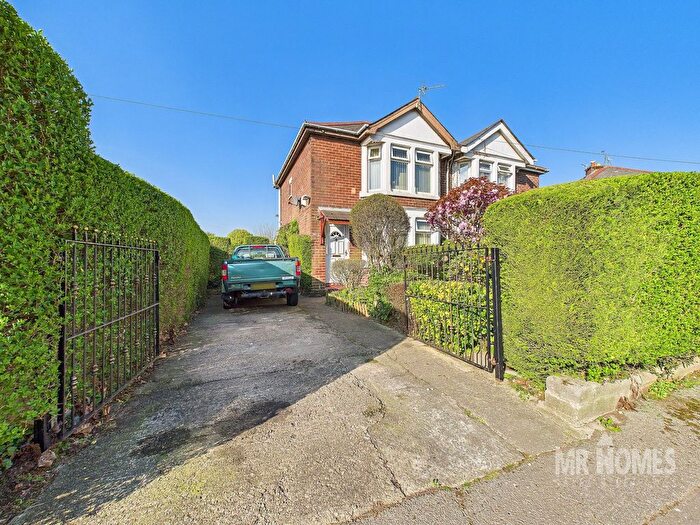
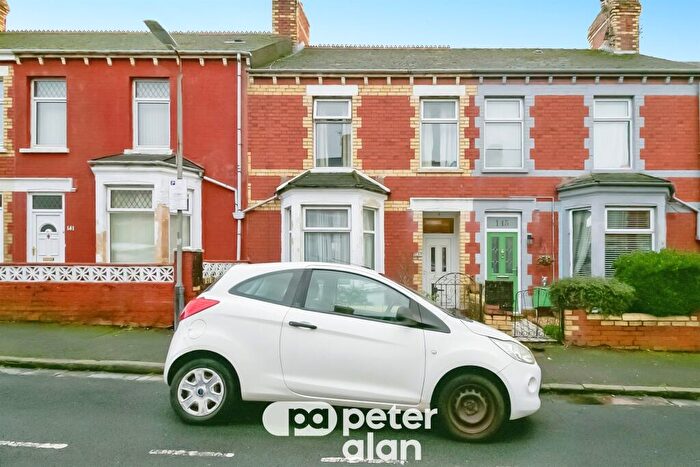
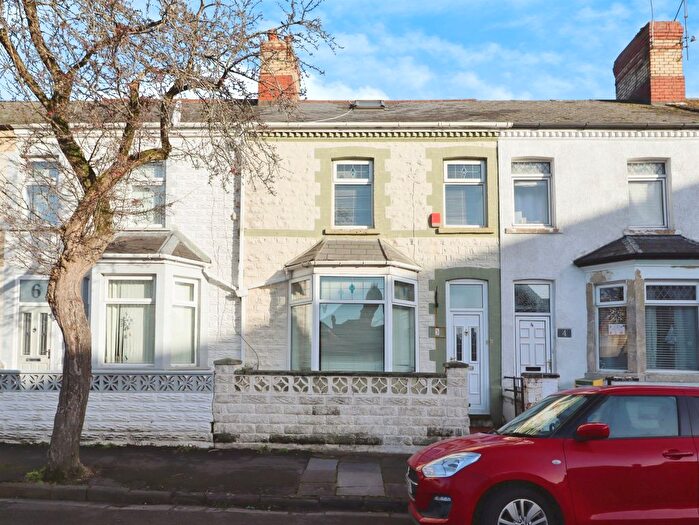
Properties for sale in Gibbonsdown
Roads and Postcodes in Gibbonsdown
Navigate through our locations to find the location of your next house in Gibbonsdown, Barry for sale or to rent.
| Streets | Postcodes |
|---|---|
| Aberaeron Close | CF62 9BT |
| Angle Close | CF62 9ED |
| Barry Road | CF62 8HE CF62 9BG CF62 9BH |
| Beatty Close | CF62 9HE |
| Blyth Close | CF62 9HG |
| Broughton Place | CF63 1QL |
| Burns Crescent | CF62 9TQ |
| Cae Leon | CF62 9TF |
| Caldy Close | CF62 9DQ CF62 9DS CF62 9DW CF62 9DU |
| Camrose Court | CF62 9DR |
| Carew Close | CF62 9EH |
| Carmarthen Close | CF62 9AS |
| Chaucer Road | CF62 9TB |
| Clos Holm View | CF62 9AX |
| Collard Crescent | CF62 9AN CF62 9AP CF62 9AQ |
| Columbus Close | CF62 9HA |
| Cook Road | CF62 9HD |
| Cornwall Rise | CF62 9AG |
| Cornwall Road | CF62 9AF CF62 9AH |
| Coychurch Rise | CF63 1SP CF63 1SQ |
| Cwrt Pencoedtre | CF62 9BS |
| Denbigh Way | CF62 9AT |
| Dorothy Avenue | CF62 9XG |
| Dorothy Close | CF62 9AW |
| Dryden Terrace | CF62 9TD |
| Elizabeth Avenue | CF62 9XB CF62 9XD |
| Ewenny Close | CF63 1QN |
| Florence Avenue | CF62 9XH |
| Francis Road | CF62 9HH |
| Gateholm Close | CF62 9BZ |
| Gloucester Close | CF62 9AD |
| Glynbridge Close | CF62 9FN |
| Goodwick Close | CF62 9EF |
| Hardy Close | CF62 9HJ |
| Keats Way | CF62 9TZ |
| Laleston Close | CF63 1TZ CF63 1UA |
| Lydstep Road | CF62 9EA CF62 9EB |
| Magellan Close | CF62 9HB |
| Margaret Avenue | CF62 9XE |
| Marloes Close | CF62 9EL |
| Melville Close | CF62 9QD |
| Merioneth Place | CF62 9AJ |
| Merthyr Dyfan Court | CF62 9UA |
| Merthyr Dyfan Road | CF62 9TG CF62 9TH CF62 9TJ CF62 9TL CF62 9YQ |
| Michaelston Close | CF63 1SG CF63 1SH |
| Milton Road | CF62 9TS |
| Monmouth Way | CF62 9AE |
| Morningside Walk | CF62 9TE |
| Mountbatten Road | CF62 9HF |
| Nelson Road | CF62 9HL |
| Newgale Close | CF62 9EE |
| Neyland Court | CF62 9DP |
| Ogmore Place | CF63 1QQ |
| Orchard Drive | CF62 9AA |
| Pendine Close | CF62 9DD CF62 9DE |
| Pendoylan Close | CF63 1TX CF63 1TY |
| Pontalun Close | CF63 1QJ |
| Port Mews | CF62 9XS |
| Port Road East | CF62 9PW CF62 9PX CF62 9PZ |
| Radnor Green | CF62 9AR |
| Ramsey Road | CF62 9DH CF62 9DJ CF62 9DL CF62 9DF CF62 9DG |
| Redberth Close | CF62 9EG |
| Shakespeare Road | CF62 9TP |
| Shelley Crescent | CF62 9TR |
| Skomer Road | CF62 9DA |
| Slade Road | CF62 9AL |
| Solva Close | CF62 9EJ |
| St Anns Court | CF62 9DN |
| St Catherines Court | CF62 9DB |
| St Govans Close | CF62 9EN |
| St Michaels Gardens | CF62 9XP |
| Tennyson Road | CF62 9TN |
| The Rise | CF62 9BR |
| Warwick Way | CF62 9AB |
| Wellfield Court | CF63 1AZ |
| Winifred Avenue | CF62 9XA |
| Winston Road | CF62 9SY CF62 9SZ CF62 9TA |
| CF62 9BW CF62 9BY CF62 9AU |
Transport near Gibbonsdown
- FAQ
- Price Paid By Year
- Property Type Price
Frequently asked questions about Gibbonsdown
What is the average price for a property for sale in Gibbonsdown?
The average price for a property for sale in Gibbonsdown is £205,092. This amount is 14% lower than the average price in Barry. There are 1,572 property listings for sale in Gibbonsdown.
What streets have the most expensive properties for sale in Gibbonsdown?
The streets with the most expensive properties for sale in Gibbonsdown are Port Road East at an average of £420,375, Nelson Road at an average of £322,500 and Ewenny Close at an average of £281,250.
What streets have the most affordable properties for sale in Gibbonsdown?
The streets with the most affordable properties for sale in Gibbonsdown are Ogmore Place at an average of £95,000, Laleston Close at an average of £101,500 and Pendoylan Close at an average of £136,000.
Which train stations are available in or near Gibbonsdown?
Some of the train stations available in or near Gibbonsdown are Cadoxton, Barry Docks and Barry.
Property Price Paid in Gibbonsdown by Year
The average sold property price by year was:
| Year | Average Sold Price | Price Change |
Sold Properties
|
|---|---|---|---|
| 2025 | £198,975 | -8% |
43 Properties |
| 2024 | £214,650 | 4% |
45 Properties |
| 2023 | £205,021 | 2% |
44 Properties |
| 2022 | £201,939 | 9% |
52 Properties |
| 2021 | £183,116 | 9% |
70 Properties |
| 2020 | £166,132 | 3% |
45 Properties |
| 2019 | £161,114 | 11% |
57 Properties |
| 2018 | £144,016 | -6% |
53 Properties |
| 2017 | £153,230 | 5% |
55 Properties |
| 2016 | £144,911 | 11% |
59 Properties |
| 2015 | £129,484 | 12% |
69 Properties |
| 2014 | £113,532 | -19% |
59 Properties |
| 2013 | £135,206 | 14% |
44 Properties |
| 2012 | £116,380 | -16% |
25 Properties |
| 2011 | £135,232 | 10% |
35 Properties |
| 2010 | £121,105 | -9% |
28 Properties |
| 2009 | £132,036 | 2% |
30 Properties |
| 2008 | £129,738 | 3% |
34 Properties |
| 2007 | £125,912 | 1% |
73 Properties |
| 2006 | £124,424 | 12% |
81 Properties |
| 2005 | £109,973 | 2% |
50 Properties |
| 2004 | £108,316 | 22% |
86 Properties |
| 2003 | £84,519 | 21% |
93 Properties |
| 2002 | £67,102 | 22% |
110 Properties |
| 2001 | £52,353 | -2% |
76 Properties |
| 2000 | £53,260 | 6% |
80 Properties |
| 1999 | £49,816 | 9% |
65 Properties |
| 1998 | £45,128 | -0,1% |
58 Properties |
| 1997 | £45,169 | 9% |
68 Properties |
| 1996 | £41,325 | -6% |
50 Properties |
| 1995 | £43,722 | - |
38 Properties |
Property Price per Property Type in Gibbonsdown
Here you can find historic sold price data in order to help with your property search.
The average Property Paid Price for specific property types in the last three years are:
| Property Type | Average Sold Price | Sold Properties |
|---|---|---|
| Semi Detached House | £206,267.00 | 105 Semi Detached Houses |
| Detached House | £297,666.00 | 21 Detached Houses |
| Terraced House | £169,445.00 | 58 Terraced Houses |

