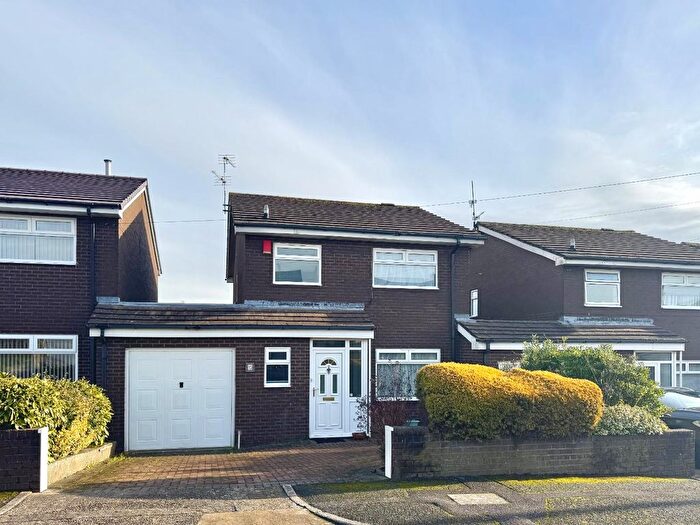
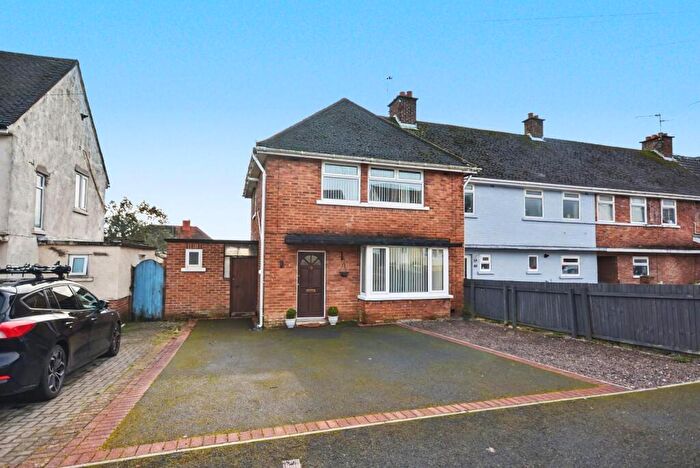
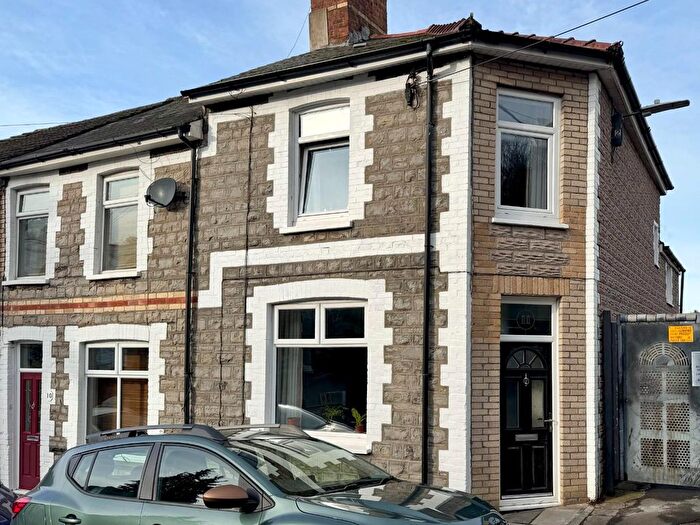
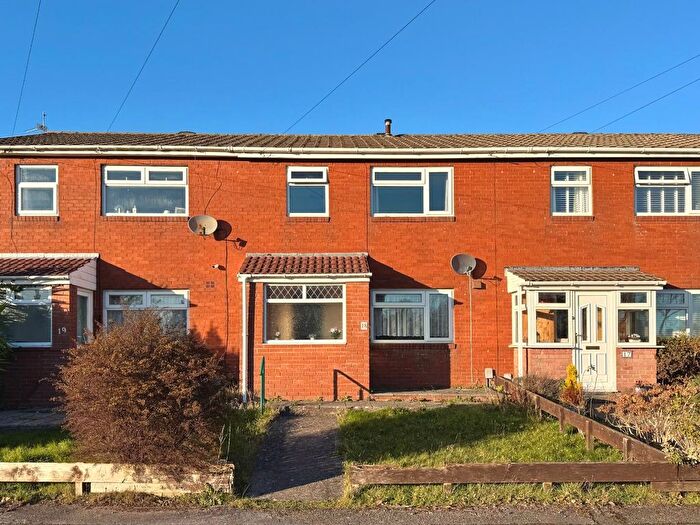
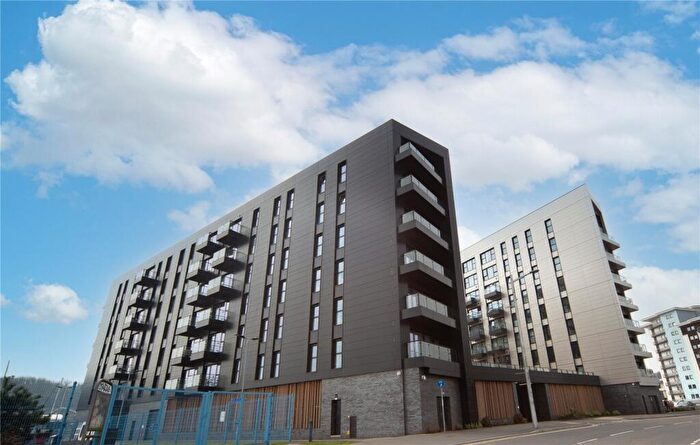
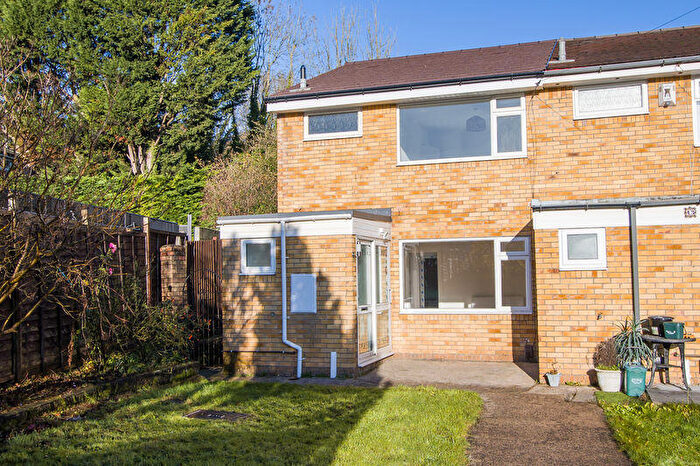
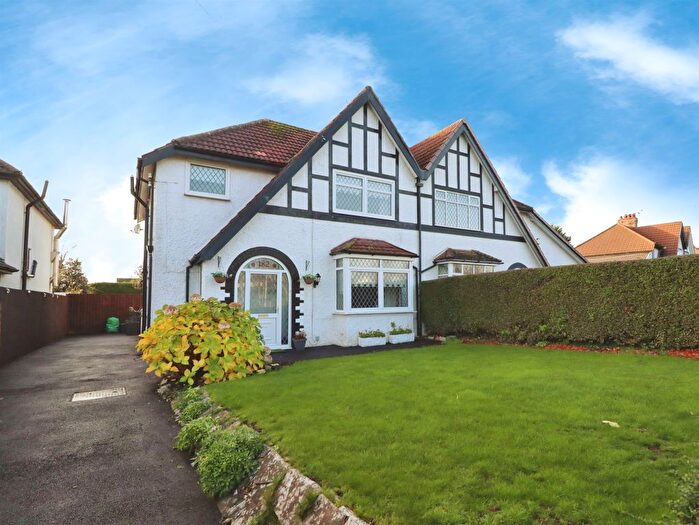
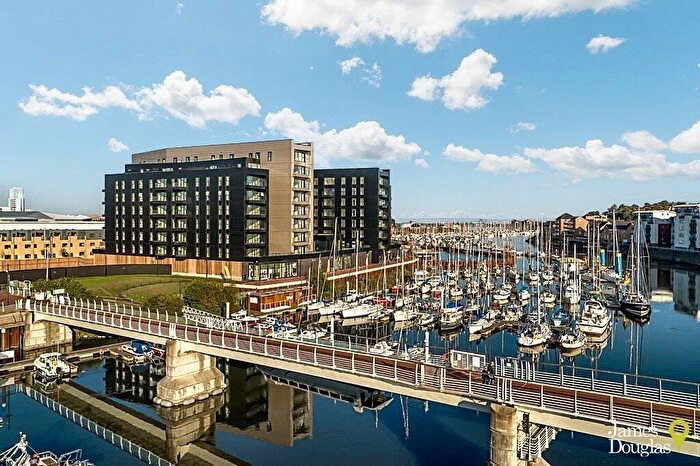
Houses for sale & to rent in Llandough, Penarth
House Prices in Llandough
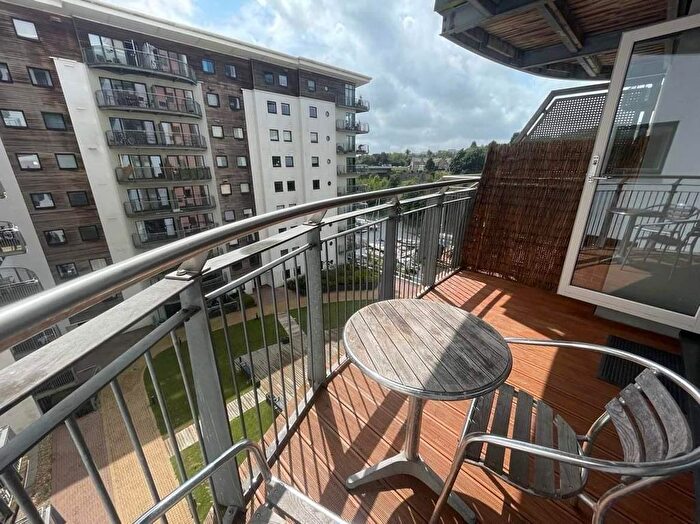
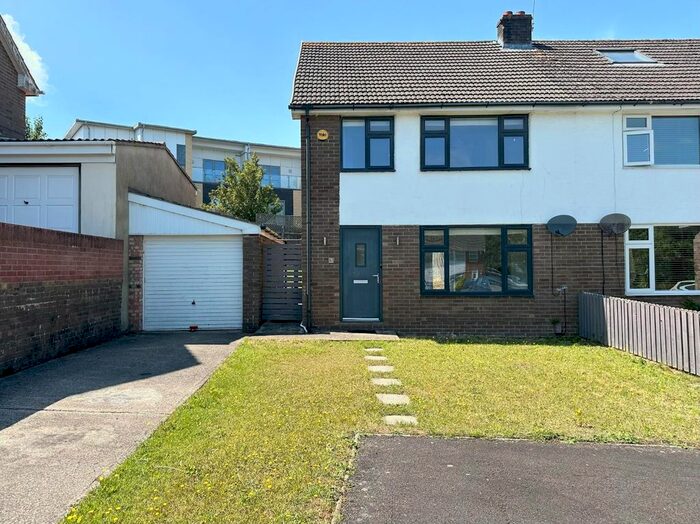
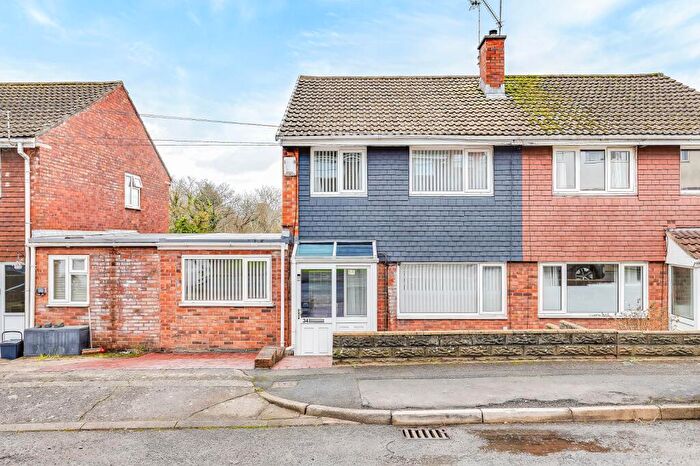
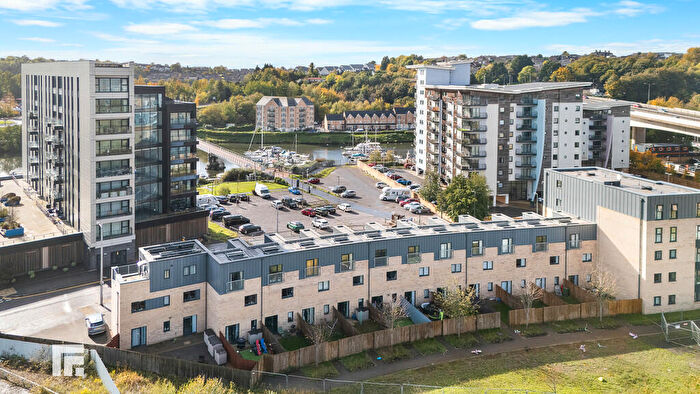
Properties in Llandough have an average house price of £333,237.00 and had 81 Property Transactions within the last 3 years¹.
Llandough is an area in Penarth, Bro Morgannwg - the Vale of Glamorgan with 863 households², where the most expensive property was sold for £1,600,000.00.
Properties for sale in Llandough
Roads and Postcodes in Llandough
Navigate through our locations to find the location of your next house in Llandough, Penarth for sale or to rent.
| Streets | Postcodes |
|---|---|
| Ashgrove | CF64 2PW |
| Canon Walk | CF64 2NE |
| Church View Close | CF64 2NN |
| Cogan Pill Road | CF64 2NB CF64 2NF CF64 2NQ |
| Corbett Road | CF64 2QX |
| Corinthian Close | CF64 2LL |
| Dochdwy Road | CF64 2PB CF64 2PD CF64 2PE CF64 2QD |
| Downfield Close | CF64 2PY |
| Dylan Close | CF64 2PA |
| Eastbrook Road | CF64 2PZ |
| Grassmere Close | CF64 2PT |
| Greenhaven Rise | CF64 2PN |
| Greenway Close | CF64 2LZ |
| Joseph Parry Close | CF64 2PL |
| Keepers Gardens | CF64 2JQ |
| Leckwith Road | CF64 2LY |
| Lewis Road | CF64 2LW CF64 2LX |
| Llandough Hill | CF64 2NA |
| Oakwood Close | CF64 2PU |
| Pant Y Celyn Road | CF64 2PF CF64 2PG CF64 2PH |
| Penarth Road | CF64 1ND |
| Penlan Rise | CF64 2LS |
| Penlan Road | CF64 2LT CF64 2LU CF64 2NY CF64 2XX |
| Pinewood Close | CF64 2PX |
| Spencer Drive | CF64 2LR |
| Summerland Close | CF64 2QA CF64 2QG |
| Summerland Crescent | CF64 2PJ |
| Sycamore Close | CF64 2NP |
| Tuscan Close | CF64 2LN |
| Uplands Crescent | CF64 2PR CF64 2PS |
| Vale View Close | CF64 2QB |
| Vale View Crescent | CF64 2NZ |
| Waverley Close | CF64 2PQ |
| Willowmere | CF64 2LP |
| CF64 2HR CF64 2QJ |
Transport near Llandough
-
Cogan Station
-
Eastbrook Station
-
Dingle Road Station
-
Penarth Station
-
Grangetown (South Glamorgan) Station
-
Dinas Powys Station
-
Cardiff Bay Station
-
Ninian Park Station
-
Cardiff Central Station
-
Cardiff Queen Street Station
- FAQ
- Price Paid By Year
- Property Type Price
Frequently asked questions about Llandough
What is the average price for a property for sale in Llandough?
The average price for a property for sale in Llandough is £333,237. This amount is 15% lower than the average price in Penarth. There are 924 property listings for sale in Llandough.
What streets have the most expensive properties for sale in Llandough?
The streets with the most expensive properties for sale in Llandough are Leckwith Road at an average of £763,625, Church View Close at an average of £528,000 and Canon Walk at an average of £494,262.
What streets have the most affordable properties for sale in Llandough?
The streets with the most affordable properties for sale in Llandough are Cogan Pill Road at an average of £126,590, Corinthian Close at an average of £144,316 and Penlan Rise at an average of £247,000.
Which train stations are available in or near Llandough?
Some of the train stations available in or near Llandough are Cogan, Eastbrook and Dingle Road.
Property Price Paid in Llandough by Year
The average sold property price by year was:
| Year | Average Sold Price | Price Change |
Sold Properties
|
|---|---|---|---|
| 2025 | £384,388 | 14% |
21 Properties |
| 2024 | £330,330 | 13% |
15 Properties |
| 2023 | £288,621 | -14% |
21 Properties |
| 2022 | £329,337 | 24% |
24 Properties |
| 2021 | £249,787 | 6% |
39 Properties |
| 2020 | £234,365 | -2% |
26 Properties |
| 2019 | £238,045 | -3% |
31 Properties |
| 2018 | £246,276 | 3% |
36 Properties |
| 2017 | £239,916 | -7% |
30 Properties |
| 2016 | £257,095 | 11% |
38 Properties |
| 2015 | £229,903 | 19% |
37 Properties |
| 2014 | £186,359 | -27% |
27 Properties |
| 2013 | £235,815 | 21% |
19 Properties |
| 2012 | £186,021 | -1% |
23 Properties |
| 2011 | £188,697 | -7% |
20 Properties |
| 2010 | £202,812 | -7% |
16 Properties |
| 2009 | £216,497 | -8% |
17 Properties |
| 2008 | £233,735 | 22% |
17 Properties |
| 2007 | £182,570 | -13% |
35 Properties |
| 2006 | £206,310 | 24% |
45 Properties |
| 2005 | £157,376 | -1% |
38 Properties |
| 2004 | £159,443 | 6% |
39 Properties |
| 2003 | £149,345 | 19% |
41 Properties |
| 2002 | £120,878 | 25% |
54 Properties |
| 2001 | £90,985 | 8% |
42 Properties |
| 2000 | £83,830 | 6% |
44 Properties |
| 1999 | £78,451 | 10% |
35 Properties |
| 1998 | £70,627 | -1% |
31 Properties |
| 1997 | £71,600 | 20% |
24 Properties |
| 1996 | £57,343 | -52% |
32 Properties |
| 1995 | £87,196 | - |
29 Properties |
Property Price per Property Type in Llandough
Here you can find historic sold price data in order to help with your property search.
The average Property Paid Price for specific property types in the last three years are:
| Property Type | Average Sold Price | Sold Properties |
|---|---|---|
| Semi Detached House | £327,844.00 | 34 Semi Detached Houses |
| Detached House | £554,179.00 | 17 Detached Houses |
| Terraced House | £265,861.00 | 18 Terraced Houses |
| Flat | £136,583.00 | 12 Flats |

