
Houses for sale & to rent in Penarth, Bro Morgannwg - the Vale of Glamorgan
House Prices in Penarth
Properties in Penarth have an average house price of £390,938.00 and had 1,679 Property Transactions within the last 3 years.¹
Penarth is an area in Bro Morgannwg - the Vale of Glamorgan with 12,581 households², where the most expensive property was sold for £2,950,000.00.
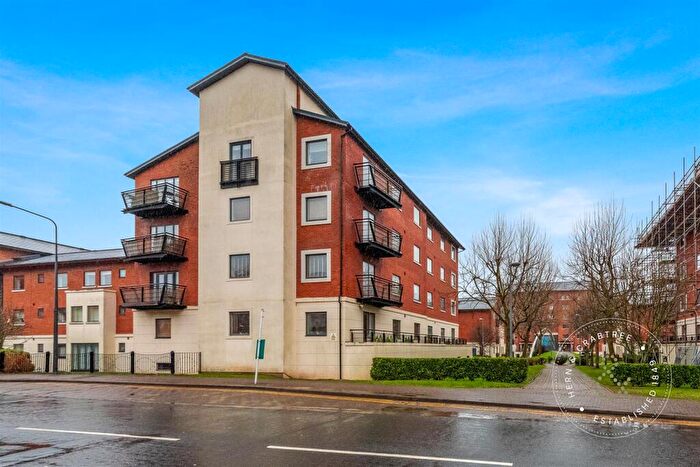
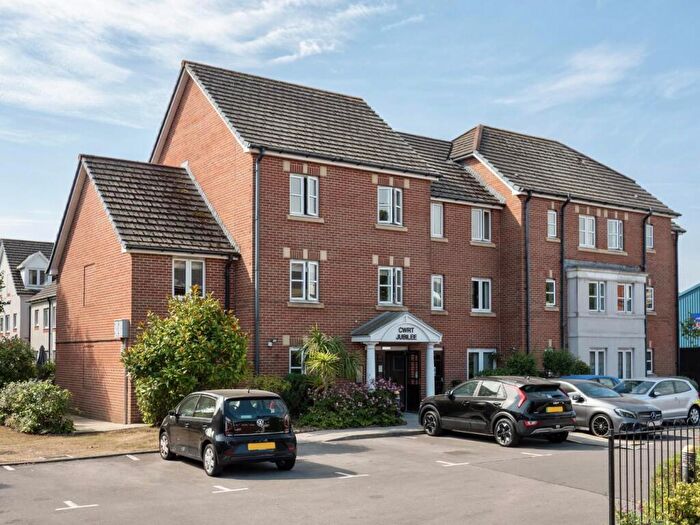
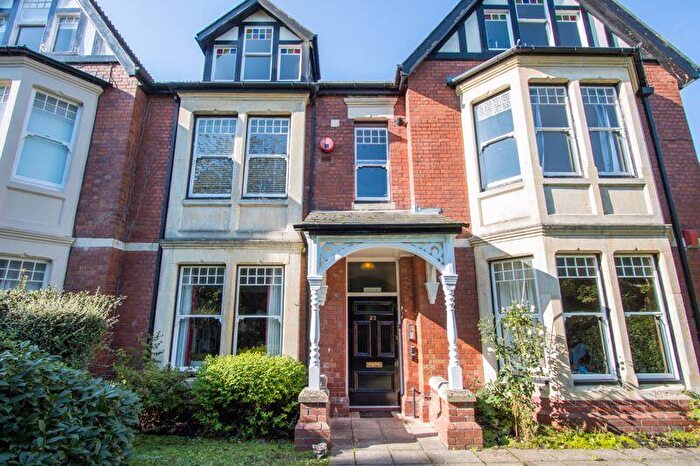
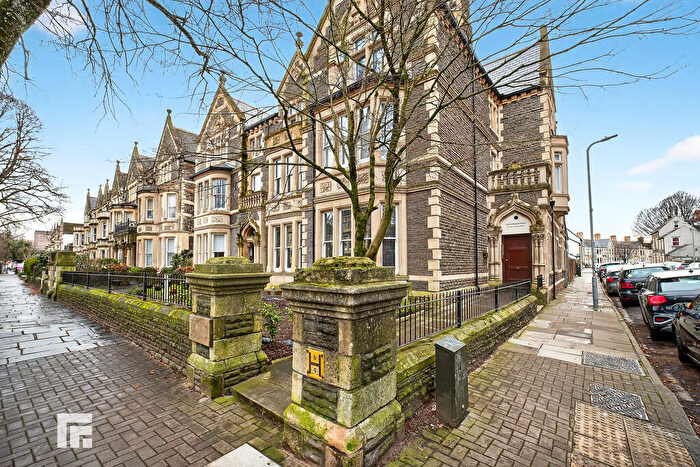
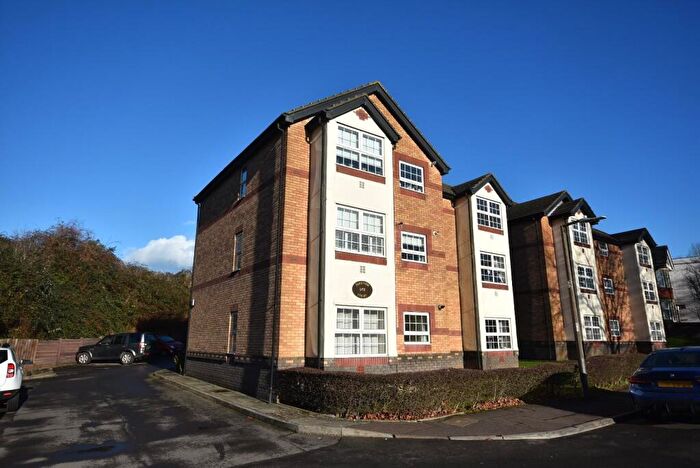
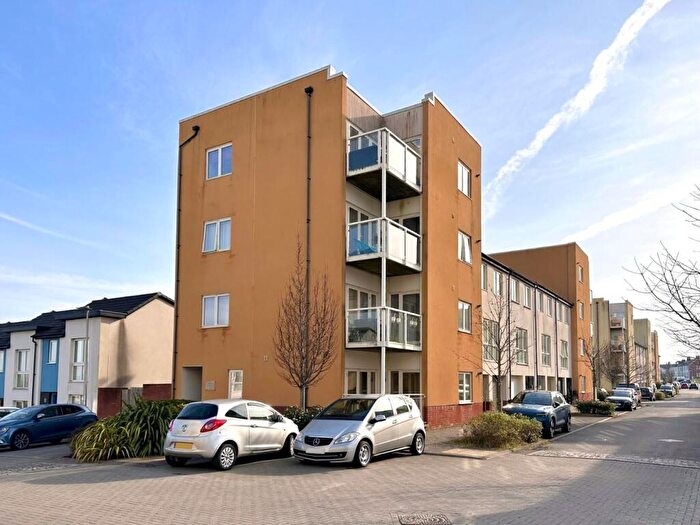
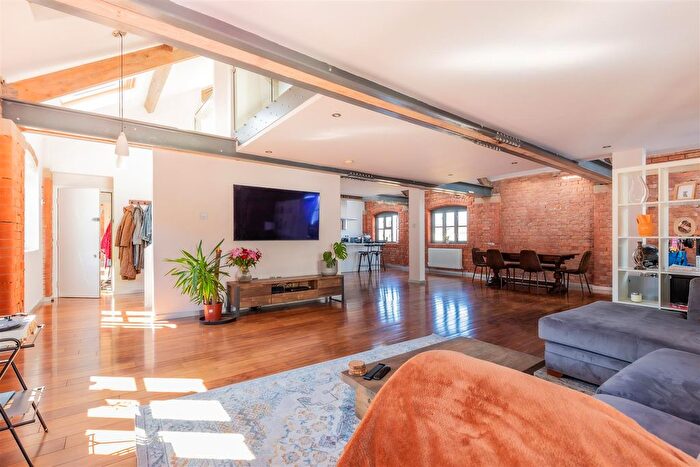
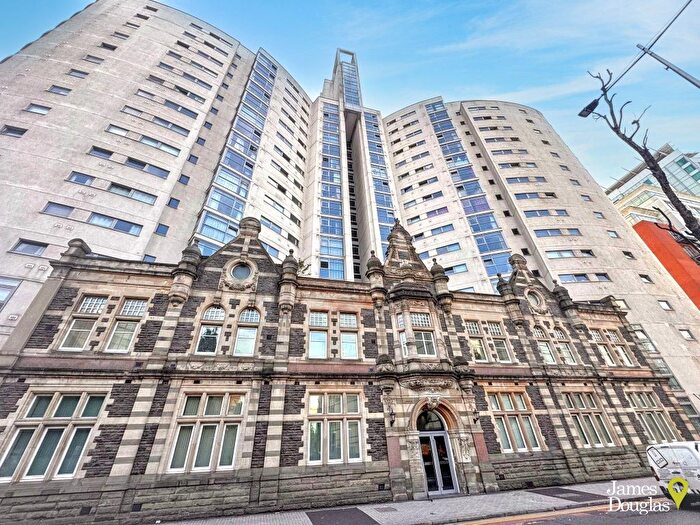
Properties for sale in Penarth
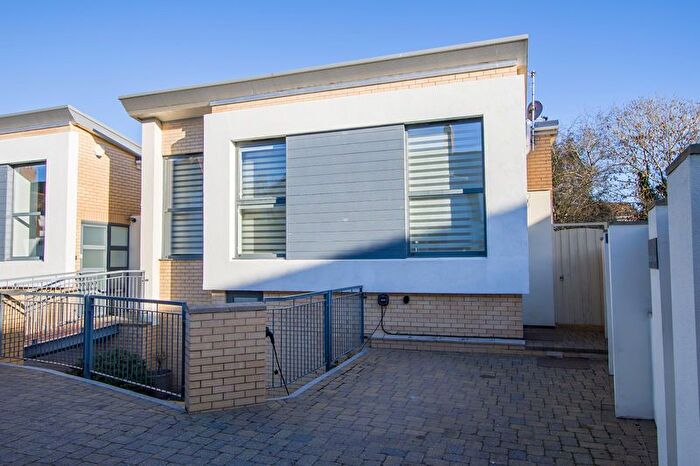

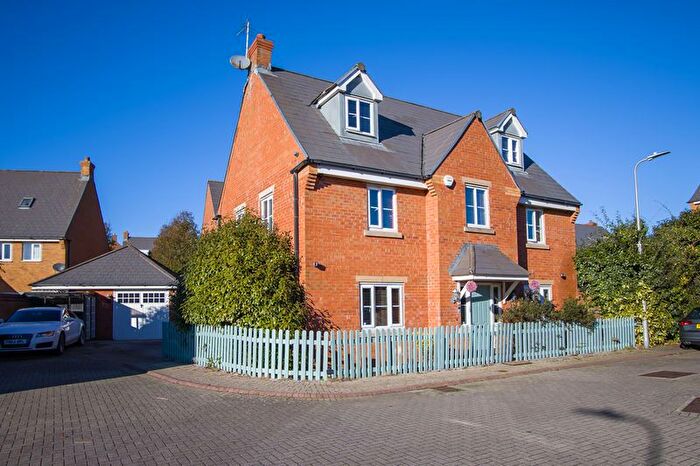
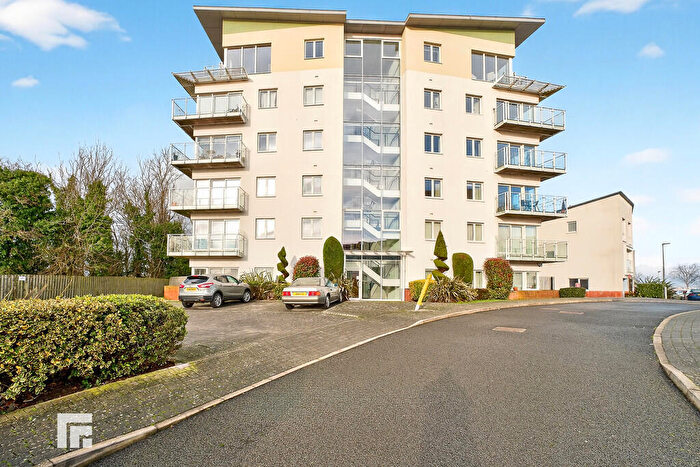
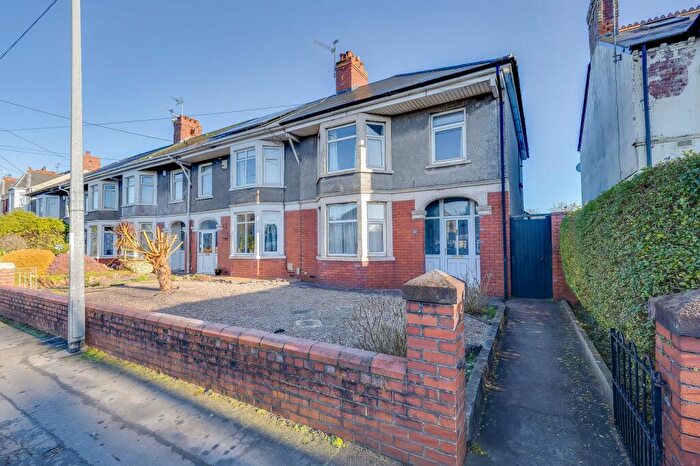
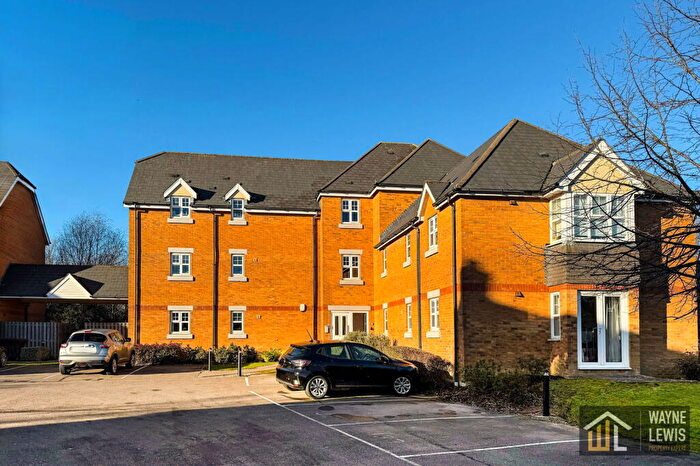
![]()
If you are looking to sell your house, let it out, or receive a property valuation, an expert can help you.
Click the button below to get started.


Neighbourhoods in Penarth
Navigate through our locations to find the location of your next house in Penarth, Bro Morgannwg - the Vale of Glamorgan for sale or to rent.
Transport in Penarth
Please see below transportation links in this area:
-
 Penarth Station
 -
Dingle Road Station
-
Cogan Station
-
Eastbrook Station
-
Dinas Powys Station
-
Grangetown (South Glamorgan) Station
-
Cardiff Bay Station
-
Cardiff Central Station
- FAQ
- Price Paid By Year
- Property Type Price
Frequently asked questions about Penarth
What is the average price for a property for sale in Penarth?
The average price for a property for sale in Penarth is £390,938. This amount is 20% higher than the average price in Bro Morgannwg - the Vale of Glamorgan. There are 9,716 property listings for sale in Penarth.
What locations have the most expensive properties for sale in Penarth?
The locations with the most expensive properties for sale in Penarth are Dinas Powys at an average of £606,666, Plymouth at an average of £597,752 and Stanwell at an average of £437,986.
What locations have the most affordable properties for sale in Penarth?
The locations with the most affordable properties for sale in Penarth are St. Augustines at an average of £323,506, Cornerswell at an average of £332,984 and Llandough at an average of £333,237.
Which train stations are available in or near Penarth?
Some of the train stations available in or near Penarth are Penarth, Dingle Road and Cogan.
Property Price Paid in Penarth by Year
The average sold property price by year was:
| Year | Average Sold Price | Price Change |
Sold Properties
|
|---|---|---|---|
| 2025 | £394,759 | 5% |
305 Properties |
| 2024 | £376,440 | -9% |
433 Properties |
| 2023 | £408,841 | 5% |
400 Properties |
| 2022 | £387,151 | 7% |
541 Properties |
| 2021 | £359,950 | 8% |
652 Properties |
| 2020 | £331,854 | 5% |
424 Properties |
| 2019 | £314,237 | 2% |
512 Properties |
| 2018 | £306,840 | -1% |
572 Properties |
| 2017 | £310,067 | 15% |
568 Properties |
| 2016 | £265,034 | -4% |
672 Properties |
| 2015 | £274,746 | 10% |
610 Properties |
| 2014 | £246,694 | 3% |
616 Properties |
| 2013 | £240,237 | 1% |
548 Properties |
| 2012 | £236,979 | 2% |
483 Properties |
| 2011 | £233,123 | -5% |
410 Properties |
| 2010 | £244,977 | 7% |
419 Properties |
| 2009 | £228,295 | 0,3% |
340 Properties |
| 2008 | £227,592 | 2% |
365 Properties |
| 2007 | £222,587 | -7% |
769 Properties |
| 2006 | £237,426 | 13% |
787 Properties |
| 2005 | £207,457 | 7% |
614 Properties |
| 2004 | £193,043 | 9% |
822 Properties |
| 2003 | £175,176 | 21% |
656 Properties |
| 2002 | £137,992 | 9% |
904 Properties |
| 2001 | £125,188 | 12% |
728 Properties |
| 2000 | £110,358 | 15% |
723 Properties |
| 1999 | £93,928 | 7% |
791 Properties |
| 1998 | £87,808 | 10% |
687 Properties |
| 1997 | £79,290 | 8% |
636 Properties |
| 1996 | £73,092 | -2% |
515 Properties |
| 1995 | £74,639 | - |
398 Properties |
Property Price per Property Type in Penarth
Here you can find historic sold price data in order to help with your property search.
The average Property Paid Price for specific property types in the last three years are:
| Property Type | Average Sold Price | Sold Properties |
|---|---|---|
| Semi Detached House | £454,097.00 | 410 Semi Detached Houses |
| Detached House | £616,370.00 | 308 Detached Houses |
| Terraced House | £368,505.00 | 489 Terraced Houses |
| Flat | £212,213.00 | 472 Flats |