
Houses for sale & to rent in Peterston-super-ely, Pontyclun
House Prices in Peterston-super-ely
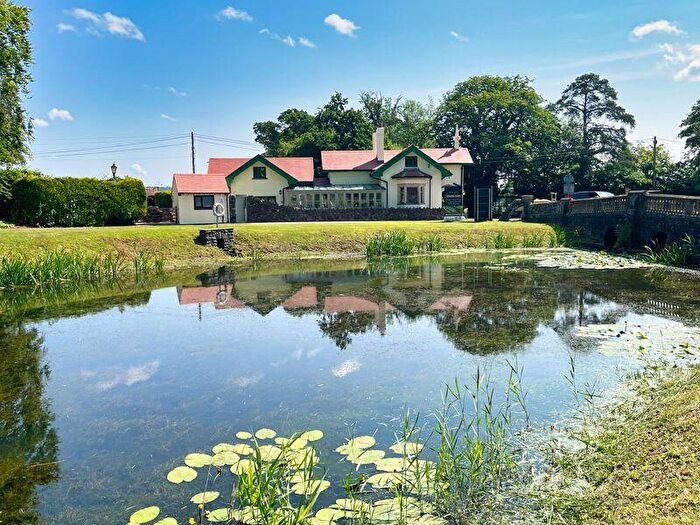
Properties in Peterston-super-ely have an average house price of £468,058.00 and had 17 Property Transactions within the last 3 years¹.
Peterston-super-ely is an area in Pontyclun, Bro Morgannwg - the Vale of Glamorgan with 57 households², where the most expensive property was sold for £645,000.00.
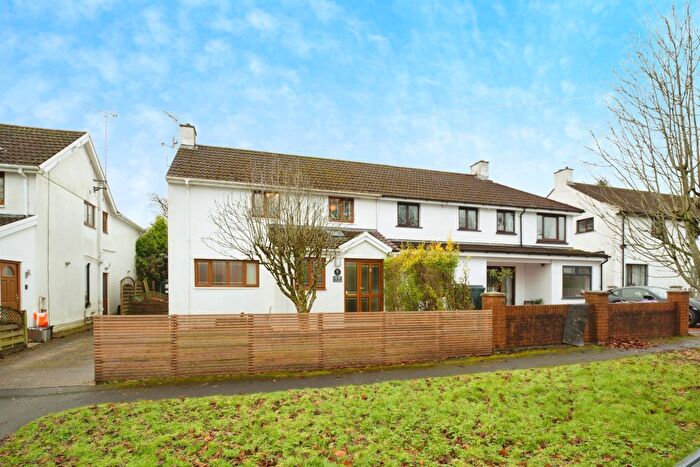
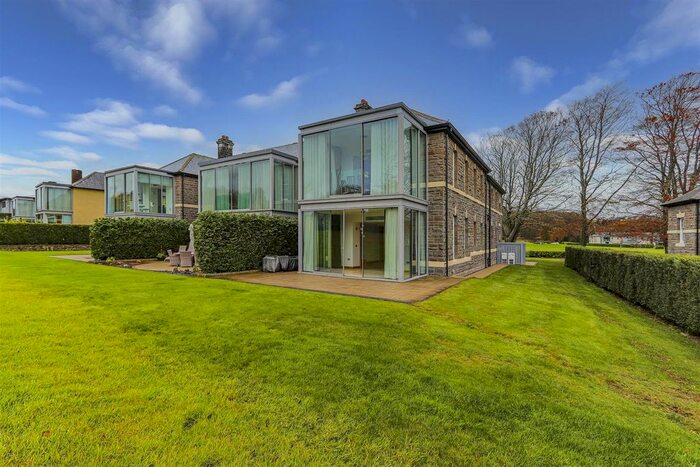
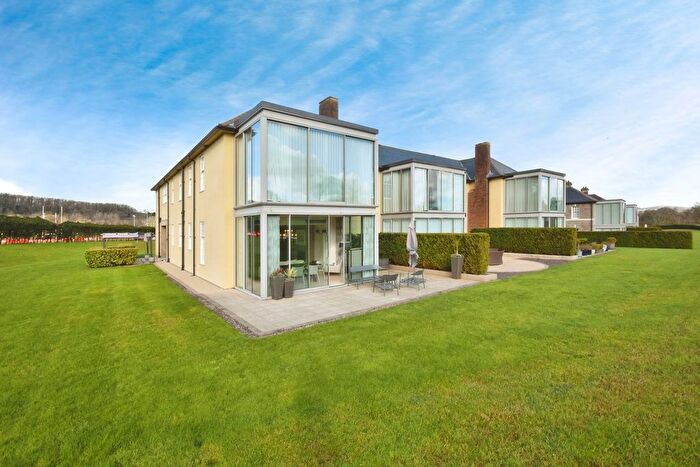
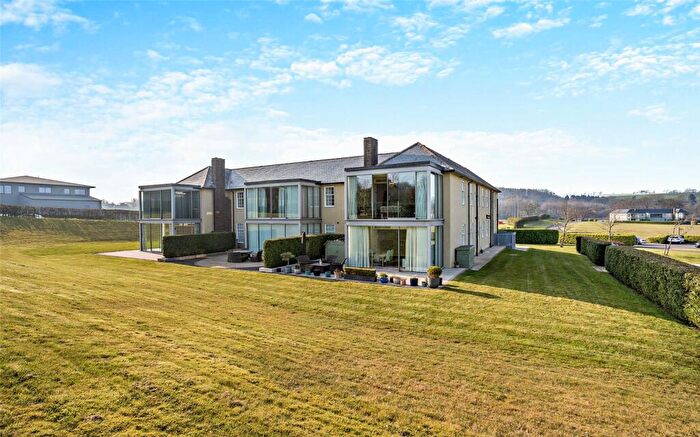
Properties for sale in Peterston-super-ely
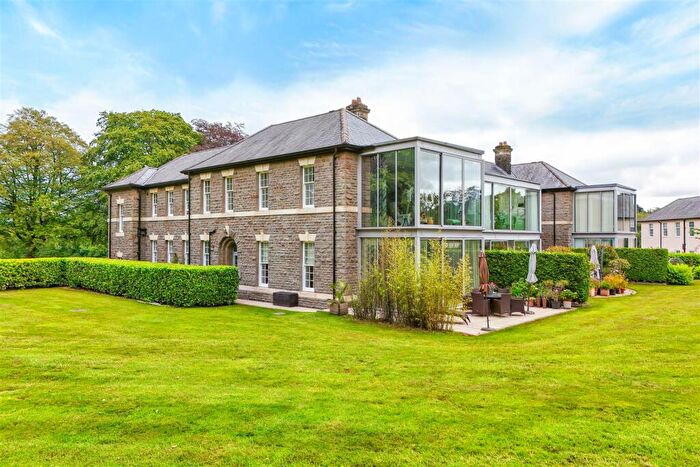


![]()
If you are looking to sell your house, let it out, or receive a property valuation, an expert can help you.
Click the button below to get started.
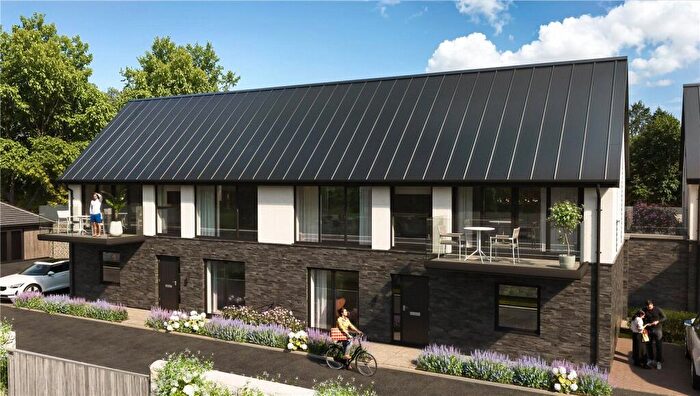
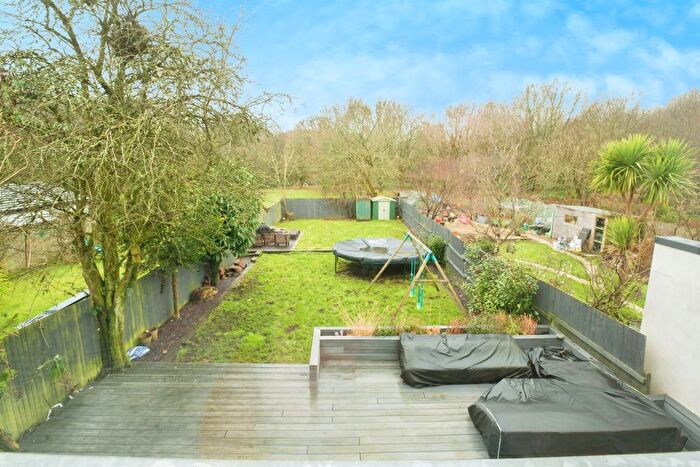
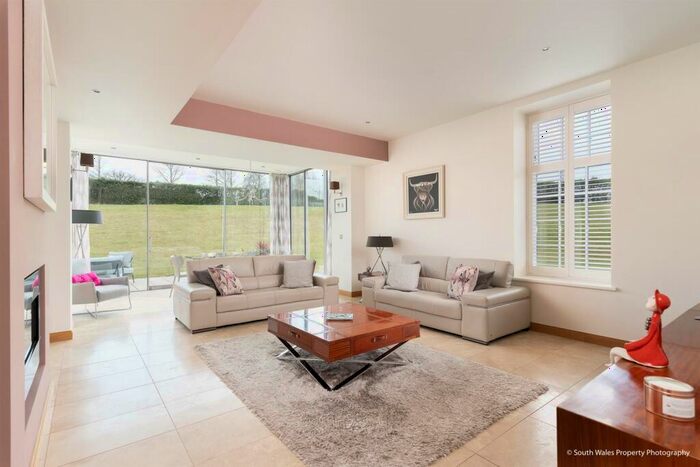
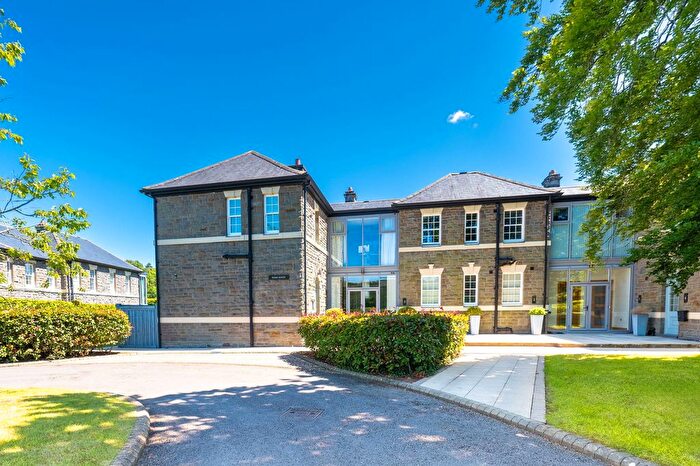
Previously listed properties in Peterston-super-ely
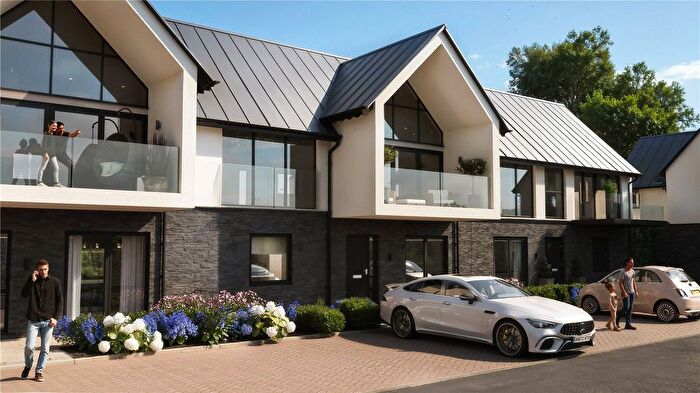

![]()
If you are looking to sell your house, let it out, or receive a property valuation, an expert can help you.
Click the button below to get started.
Roads and Postcodes in Peterston-super-ely
Navigate through our locations to find the location of your next house in Peterston-super-ely, Pontyclun for sale or to rent.
| Streets | Postcodes |
|---|---|
| Hensol Castle Park | CF72 8GD CF72 8GE CF72 8GF CF72 8GH CF72 8GJ CF72 8GN CF72 8GP CF72 8GQ CF72 8GR CF72 8GS |
| Hensol Villas | CF72 8JZ |
| CF72 8JX CF72 8JY CF72 8GG CF72 8XY |
Transport near Peterston-super-ely
-
 Pontyclun Station
 -
Llanharan Station
-
Radyr Station
-
Taffs Well Station
-
Pencoed Station
-
Trefforest Estate Station
-
Danescourt Station
-
Fairwater Station
-
Waun-gron Park Station
-
Coryton Station
- FAQ
- Price Paid By Year
- Property Type Price
Frequently asked questions about Peterston-super-ely
What is the average price for a property for sale in Peterston-super-ely?
The average price for a property for sale in Peterston-super-ely is £468,058. There are 68 property listings for sale in Peterston-super-ely.
Which train stations are available in or near Peterston-super-ely?
Some of the train stations available in or near Peterston-super-ely are Pontyclun, Llanharan and Radyr.
Property Price Paid in Peterston-super-ely by Year
The average sold property price by year was:
| Year | Average Sold Price | Price Change |
Sold Properties
|
|---|---|---|---|
| 2025 | £356,250 | -45% |
4 Properties |
| 2024 | £517,500 | -4% |
2 Properties |
| 2023 | £538,333 | 10% |
3 Properties |
| 2022 | £485,250 | 4% |
8 Properties |
| 2021 | £467,857 | 24% |
7 Properties |
| 2020 | £356,741 | -16% |
6 Properties |
| 2019 | £414,333 | 6% |
3 Properties |
| 2018 | £390,000 | 22% |
2 Properties |
| 2017 | £305,110 | -34% |
1 Property |
| 2016 | £408,750 | -2% |
4 Properties |
| 2015 | £415,312 | 14% |
8 Properties |
| 2014 | £355,666 | -11% |
9 Properties |
| 2013 | £395,653 | 15% |
13 Properties |
| 2012 | £335,625 | -17% |
8 Properties |
| 2011 | £393,833 | 10% |
6 Properties |
| 2010 | £355,878 | 9% |
25 Properties |
| 2009 | £325,000 | 32% |
4 Properties |
| 2008 | £220,000 | -52% |
1 Property |
| 2007 | £335,000 | 41% |
2 Properties |
| 2006 | £199,008 | 15% |
3 Properties |
| 2005 | £170,000 | 6% |
1 Property |
| 2004 | £160,379 | 47% |
6 Properties |
| 2001 | £85,000 | -97% |
1 Property |
| 2000 | £167,500 | 43% |
1 Property |
| 1998 | £95,000 | 49% |
1 Property |
| 1995 | £48,500 | - |
1 Property |
Property Price per Property Type in Peterston-super-ely
Here you can find historic sold price data in order to help with your property search.
The average Property Paid Price for specific property types in the last three years are:
| Property Type | Average Sold Price | Sold Properties |
|---|---|---|
| Flat | £468,058.00 | 17 Flats |