
Houses for sale & to rent in Cathays, Cardiff
House Prices in Cathays
Properties in Cathays have an average house price of £261k and had 592 Property Transactions within the last 3 years¹.
Cathays is an area in Cardiff, Caerdydd - Cardiff with 6,200 households², where the most expensive property was sold for £2.19M.
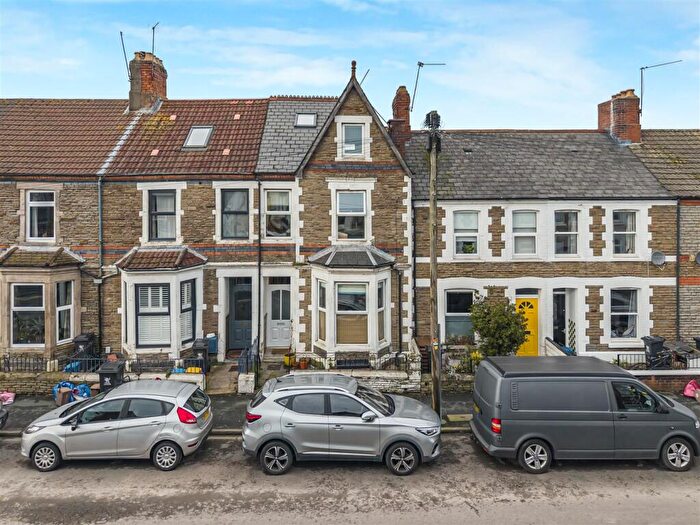
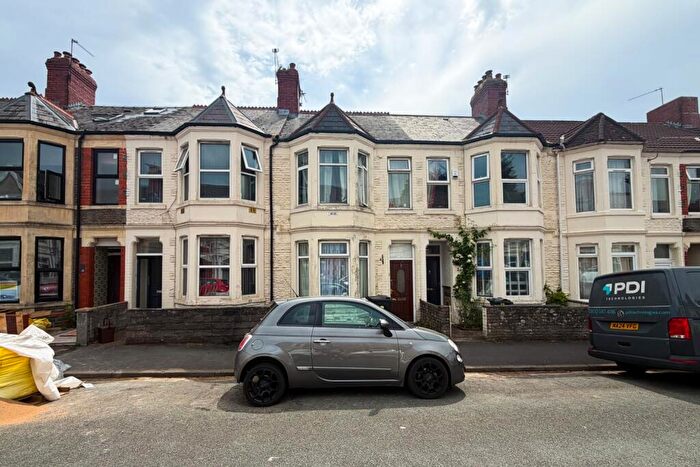
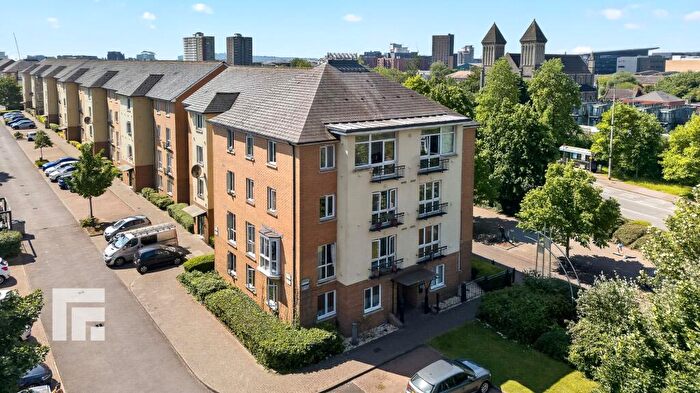
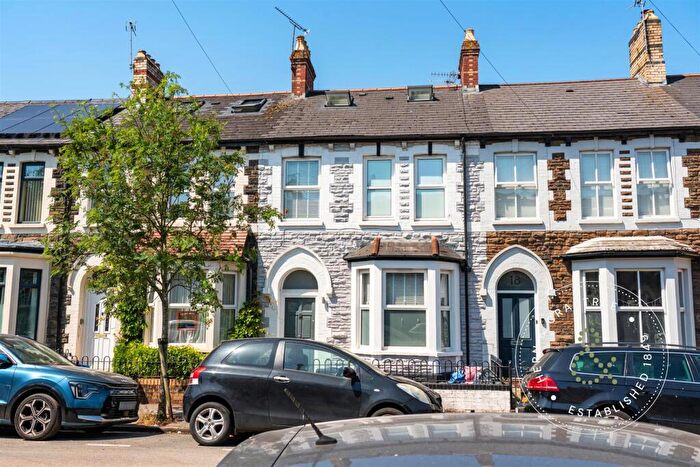
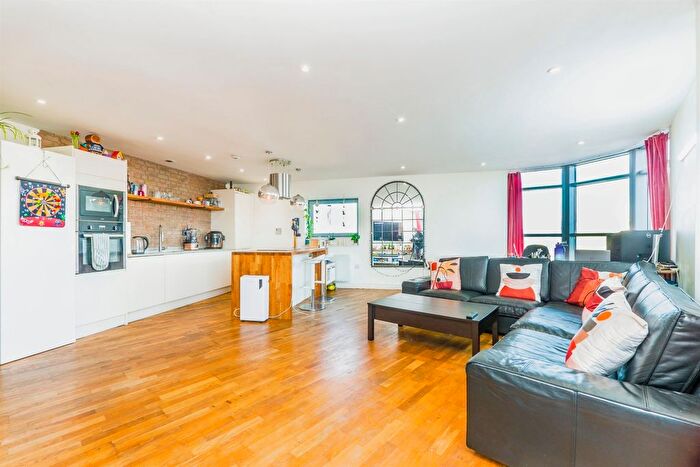
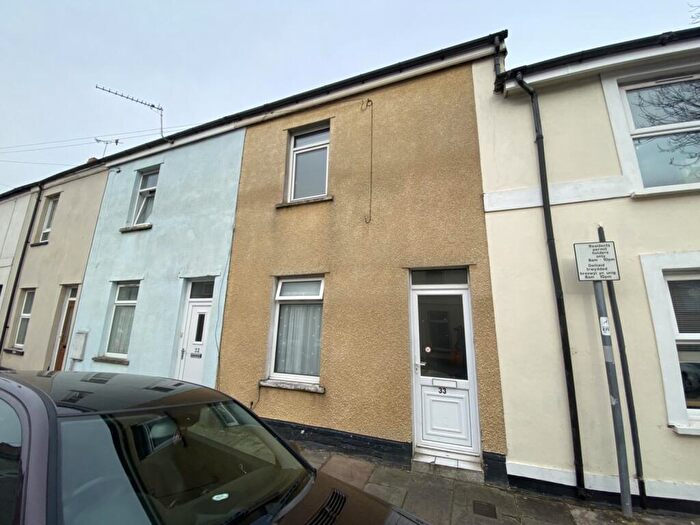
Properties for sale in Cathays
![]()
If you are looking to sell your house, let it out, or receive a property valuation, an expert can help you.
Click the button below to get started.

Roads and Postcodes in Cathays
Navigate through our locations to find the location of your next house in Cathays, Cardiff for sale or to rent.
Transport near Cathays
-
 Cathays Station
 -
Cardiff Queen Street Station
-
Cardiff Central Station
-
Ninian Park Station
-
Grangetown (South Glamorgan) Station
-
Cardiff Bay Station
-
Heath Low Level Station
-
Heath High Level Station
-
Waun-gron Park Station
-
Fairwater Station
- FAQ
- Price Paid By Year
- Property Type Price
Frequently asked questions about Cathays
What is the average price for a property for sale in Cathays?
The average price for a property for sale in Cathays is £261,376. This amount is 10% lower than the average price in Cardiff. There are 2,062 property listings for sale in Cathays.
What streets have the most expensive properties for sale in Cathays?
The streets with the most expensive properties for sale in Cathays are May Street Gardens at an average of £2,194,999, Queen Anne Square at an average of £1,075,000 and North Road at an average of £455,000.
What streets have the most affordable properties for sale in Cathays?
The streets with the most affordable properties for sale in Cathays are Guildhall Place at an average of £85,000, Golate Street at an average of £100,000 and St Mary Street at an average of £111,500.
Which train stations are available in or near Cathays?
Some of the train stations available in or near Cathays are Cathays, Cardiff Queen Street and Cardiff Central.
Property Price Paid in Cathays by Year
The average sold property price by year was:
| Year | Average Sold Price | Price Change |
Sold Properties
|
|---|---|---|---|
| 2026 | £219,533 | -19% |
6 Properties |
| 2025 | £261,671 | -1% |
150 Properties |
| 2024 | £263,867 | 2% |
228 Properties |
| 2023 | £259,640 | 3% |
208 Properties |
| 2022 | £250,892 | 7% |
243 Properties |
| 2021 | £232,287 | 6% |
215 Properties |
| 2020 | £219,450 | -1% |
144 Properties |
| 2019 | £220,984 | 2% |
245 Properties |
| 2018 | £217,134 | 4% |
240 Properties |
| 2017 | £207,880 | 5% |
253 Properties |
| 2016 | £197,717 | 7% |
286 Properties |
| 2015 | £184,857 | 9% |
291 Properties |
| 2014 | £168,175 | 4% |
316 Properties |
| 2013 | £161,603 | 2% |
208 Properties |
| 2012 | £157,571 | -2% |
242 Properties |
| 2011 | £160,237 | -2% |
221 Properties |
| 2010 | £163,702 | 11% |
261 Properties |
| 2009 | £145,784 | -20% |
271 Properties |
| 2008 | £174,584 | -2% |
249 Properties |
| 2007 | £178,625 | 8% |
375 Properties |
| 2006 | £164,407 | -10% |
393 Properties |
| 2005 | £180,921 | 9% |
407 Properties |
| 2004 | £164,034 | 9% |
538 Properties |
| 2003 | £149,889 | 13% |
501 Properties |
| 2002 | £130,249 | 21% |
561 Properties |
| 2001 | £102,697 | 26% |
394 Properties |
| 2000 | £76,031 | 9% |
303 Properties |
| 1999 | £69,172 | 10% |
237 Properties |
| 1998 | £62,422 | 9% |
256 Properties |
| 1997 | £56,682 | 9% |
352 Properties |
| 1996 | £51,353 | 11% |
311 Properties |
| 1995 | £45,853 | - |
212 Properties |
Property Price per Property Type in Cathays
Here you can find historic sold price data in order to help with your property search.
The average Property Paid Price for specific property types in the last three years are:
| Property Type | Average Sold Price | Sold Properties |
|---|---|---|
| Semi Detached House | £327,760.00 | 28 Semi Detached Houses |
| Detached House | £451,585.00 | 14 Detached Houses |
| Terraced House | £287,968.00 | 363 Terraced Houses |
| Flat | £185,577.00 | 187 Flats |