
Houses for sale in Cardiff, Caerdydd - Cardiff
House Prices in Cardiff
Properties in Cardiff have an average house price of £291k and had 13,525 Property Transactions within the last 3 years.¹
Cardiff is an area in Caerdydd - Cardiff with 147,462 households², where the most expensive property was sold for £20M.
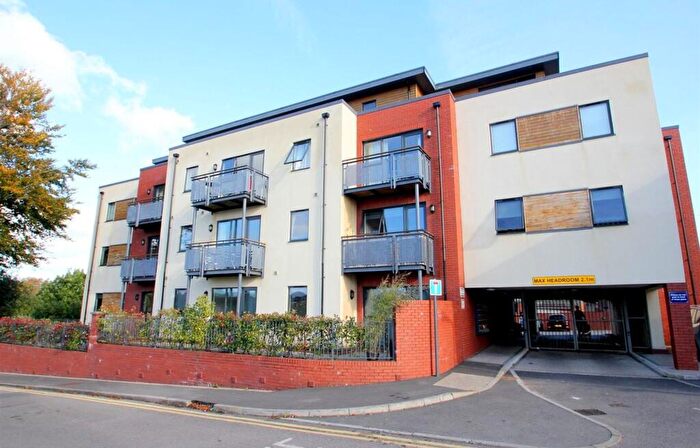
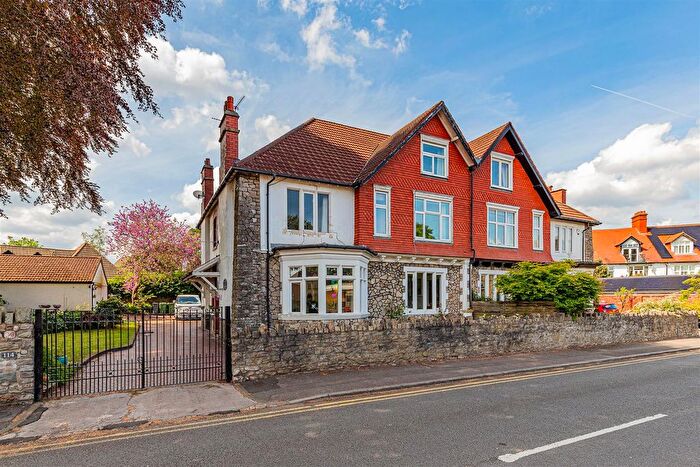
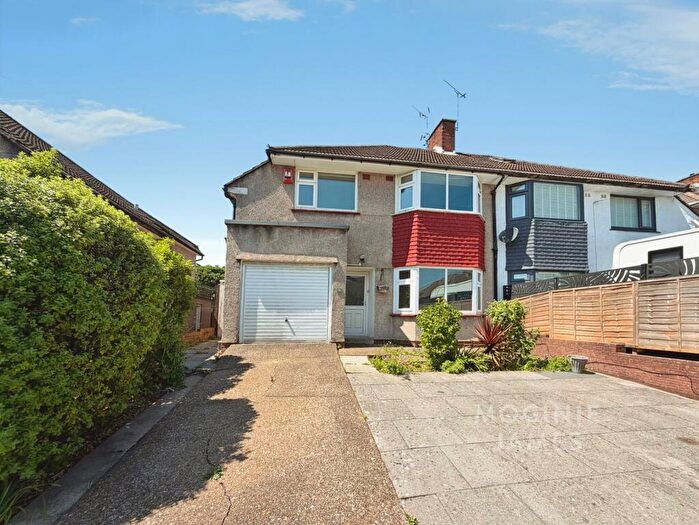
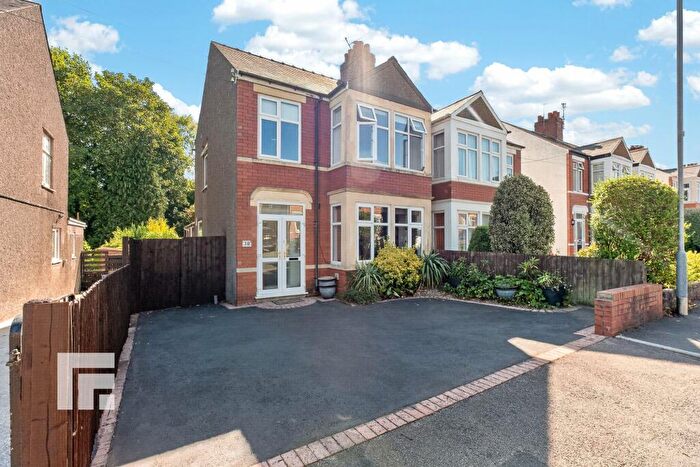
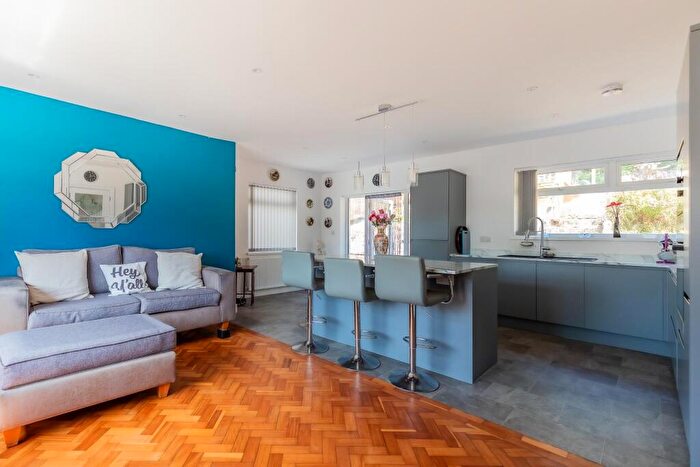
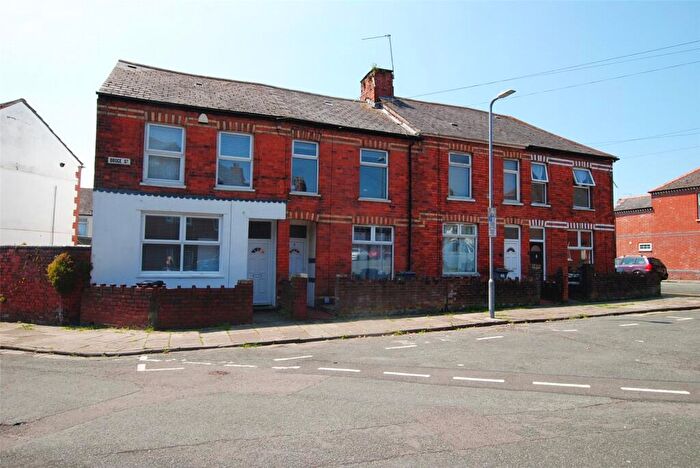
Properties for sale in Cardiff

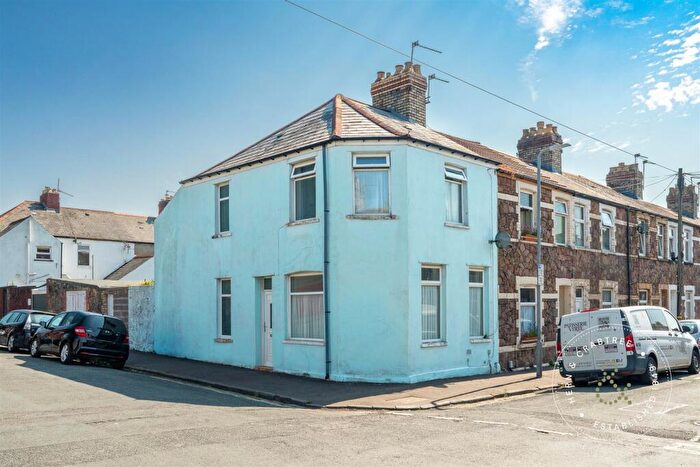
![]()
If you are looking to sell your house, let it out, or receive a property valuation, an expert can help you.
Click the button below to get started.


Neighbourhoods in Cardiff
Navigate through our locations to find the location of your next house in Cardiff, Caerdydd - Cardiff for sale or to rent.
- Adamsdown
- Butetown
- Caerau
- Canton
- Cathays
- Creigiau/st. Fagans
- Cyncoed
- Ely
- Fairwater
- Gabalfa
- Grangetown
- Heath
- Lisvane
- Llandaff
- Llandaff North
- Llanishen
- Llanrumney
- Pentwyn
- Pentyrch
- Penylan
- Plasnewydd
- Pontprennau/old St. Mellons
- Radyr
- Rhiwbina
- Riverside
- Rumney
- Splott
- Trowbridge
- Whitchurch And Tongwynlais
Property price trends in Cardiff
According to the latest Land Registry data, the average home in Cardiff sold for £295,888 in 2026. That figure comes from a substantial record of 178,544 sales logged over the past 31 years.
Prices have moved up over the last three years. Compared with 2023, when the typical sale came in around £285,381, that's a rise of roughly 3.7%.
Looking back five years, average prices are up about 9.7% since 2021, a gain of around £26,054 in cash terms.
Zoom out to the past decade for the fuller picture. Back in 2016, homes here averaged £211,679, so the typical sold price has climbed about 39.8% since then, roughly 3.4% a year. Stretch the view to fifteen years and that annual pace holds at about 3.3%.
Frequently asked questions about Cardiff
What is the average price for a property for sale in Cardiff?
The average price for a property for sale in Cardiff is £291,296. This amount is 0.29% lower than the average price in Caerdydd - Cardiff. There are more than 10,000 property listings for sale in Cardiff.
What locations have the most expensive properties for sale in Cardiff?
The locations with the most expensive properties for sale in Cardiff are Lisvane at an average of £581,106, Cyncoed at an average of £510,916 and Penylan at an average of £400,088.
What locations have the most affordable properties for sale in Cardiff?
The locations with the most affordable properties for sale in Cardiff are Ely at an average of £194,229, Butetown at an average of £197,671 and Adamsdown at an average of £197,903.
Which train stations are available in or near Cardiff?
Some of the train stations available in or near Cardiff are Cathays, Heath Low Level and Heath High Level.
Property Price Paid in Cardiff by Year
The average sold property price by year was:
| Year | Average Sold Price | Price Change |
Sold Properties
|
|---|---|---|---|
| 2026 | £295,888 | -1% |
304 Properties |
| 2025 | £299,465 | 3% |
4,237 Properties |
| 2024 | £289,007 | 1% |
4,723 Properties |
| 2023 | £285,381 | -1% |
4,261 Properties |
| 2022 | £286,907 | 6% |
5,269 Properties |
| 2021 | £269,834 | 9% |
5,992 Properties |
| 2020 | £246,672 | 5% |
4,401 Properties |
| 2019 | £234,872 | 1% |
6,148 Properties |
| 2018 | £231,381 | 5% |
6,182 Properties |
| 2017 | £218,691 | 3% |
5,955 Properties |
Property Price per Property Type in Cardiff
Here you can find historic sold price data in order to help with your property search.
The average Property Paid Price for specific property types in the last three years are:
| Property Type | Average Sold Price | Sold Properties |
|---|---|---|
| Semi Detached House | £335,836.00 | 3,365 Semi Detached Houses |
| Terraced House | £274,452.00 | 5,309 Terraced Houses |
| Detached House | £492,086.00 | 1,641 Detached Houses |
| Flat | £169,815.00 | 3,210 Flats |
Transport in Cardiff
Please see below transportation links in this area:
