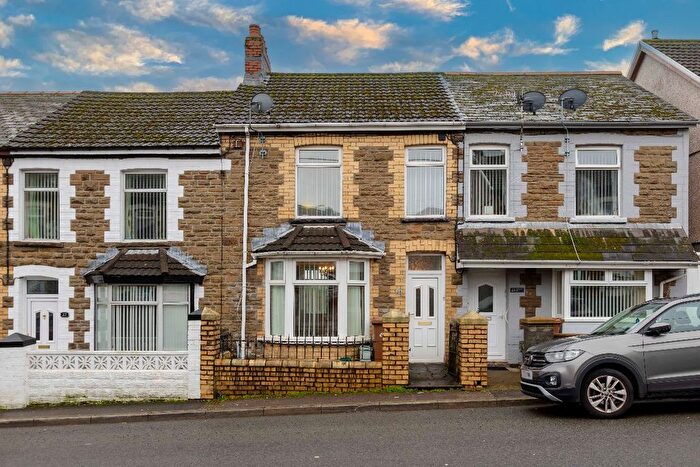
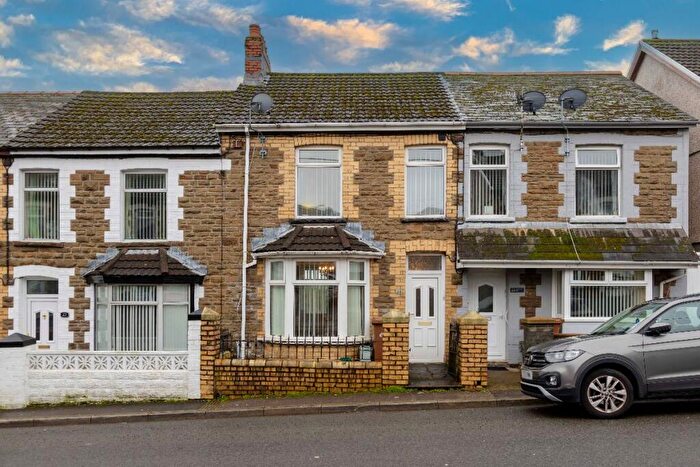
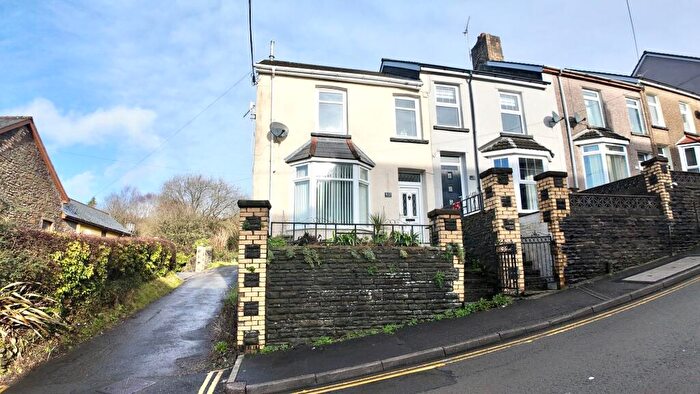
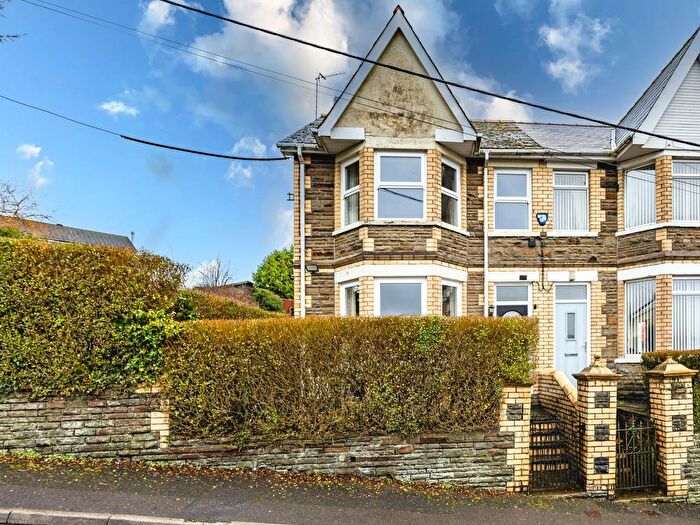
Houses for sale & to rent in Aberbargoed, Bargoed
House Prices in Aberbargoed
Properties in Aberbargoed have an average house price of £159,777.00 and had 105 Property Transactions within the last 3 years¹.
Aberbargoed is an area in Bargoed, Caerffili - Caerphilly with 1,490 households², where the most expensive property was sold for £334,995.00.
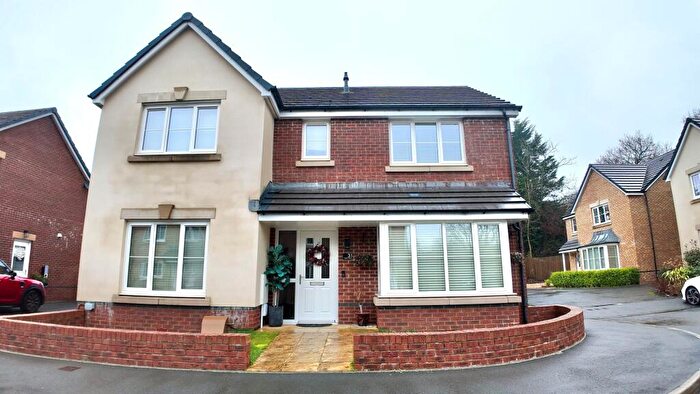
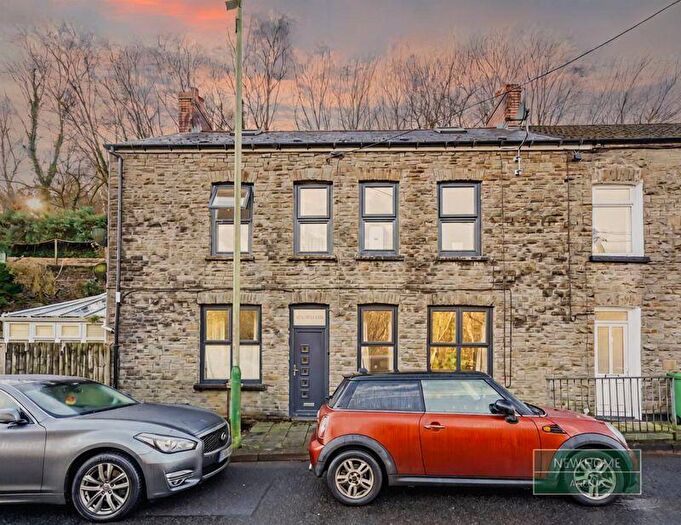
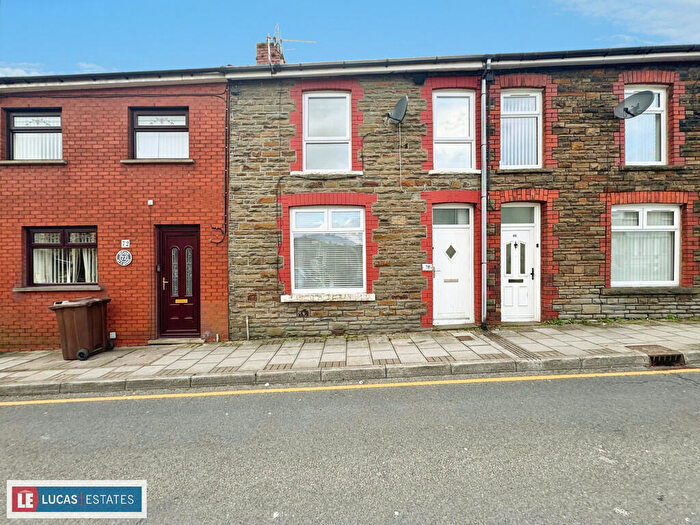
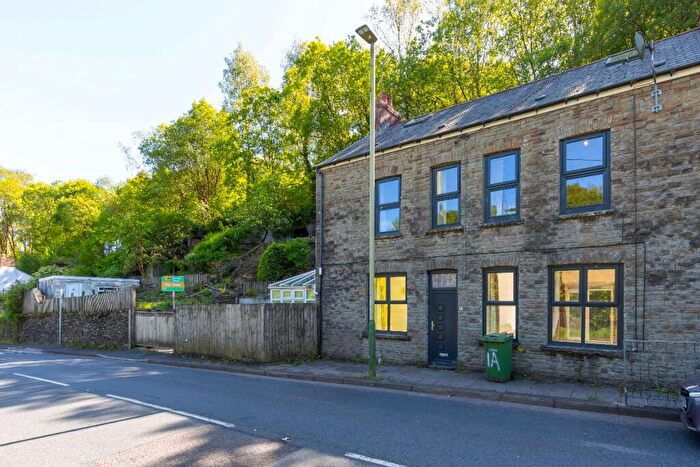
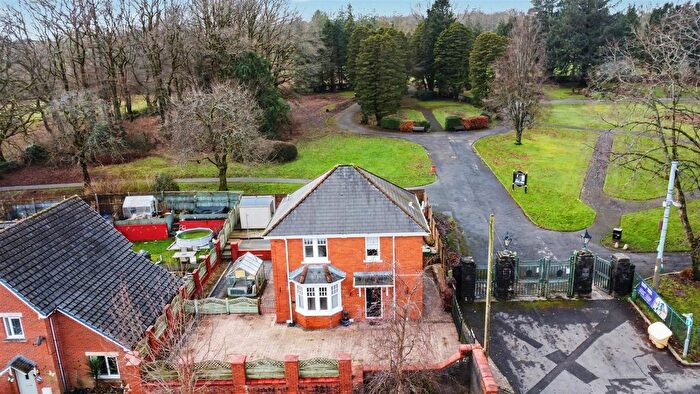
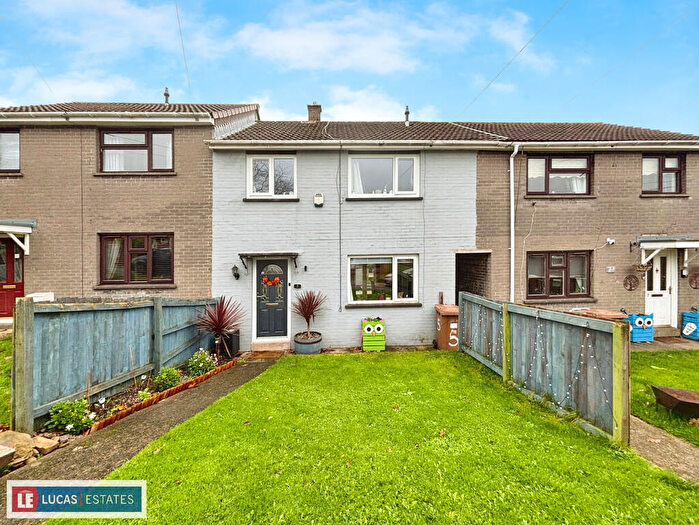
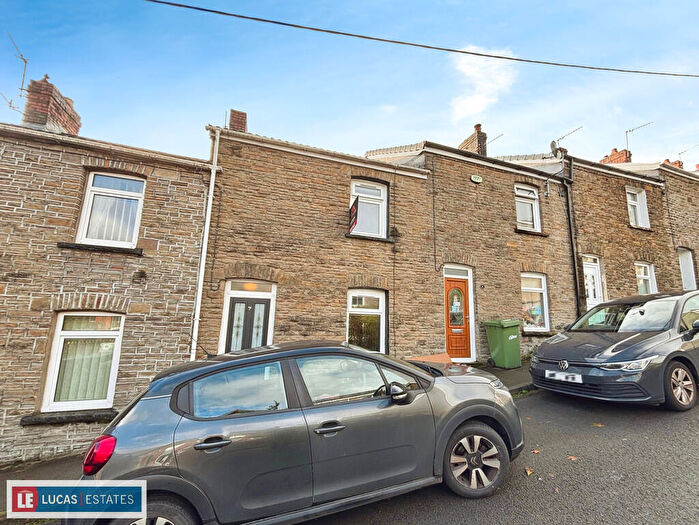
Properties for sale in Aberbargoed
Roads and Postcodes in Aberbargoed
Navigate through our locations to find the location of your next house in Aberbargoed, Bargoed for sale or to rent.
| Streets | Postcodes |
|---|---|
| Angel Lane | CF81 9FY |
| Bedwellty Road | CF81 9AE CF81 9AW CF81 9AX CF81 9AY CF81 9AZ CF81 9BA CF81 9DN CF81 9AF |
| Beech Avenue | CF81 9EF |
| Bowen Industrial Estate | CF81 9AB CF81 9EP |
| Bryn-y-pwll | CF81 9EQ |
| Byron Road | CF81 9FZ |
| Chapel Street | CF81 9BZ |
| Church Street | CF81 9FE CF81 9FF |
| Close Ysbyty | CF81 9DE |
| Coed Y Moeth Road | CF81 9DR CF81 9DS |
| Commercial Street | CF81 9BT CF81 9BU CF81 9BW CF81 9EU CF81 9EW CF81 9EX CF81 9EY CF81 9FG CF81 9FH CF81 9EN |
| Commin Road | CF81 9BL |
| Cwm Road | CF81 9BN |
| Cwmsyfiog Road | CF81 9AD |
| Cwrt Coch Street | CF81 9EZ CF81 9FA |
| Cwrt Neuadd Wen | CF81 9DL |
| Duffryn Street | CF81 9ET |
| Elm Street | CF81 9FB CF81 9FD |
| Euro Business Park | CF81 9AG |
| George Street | CF81 9FQ |
| Glenview | CF81 9AJ |
| Gwaelod Y Waun Villas | CF81 9FX |
| Heathfield Walk | CF81 9BR |
| Heol Tir Y Llan | CF81 9FJ |
| Heol Ysgol Newydd | CF81 9DD |
| Highfield Crescent | CF81 9DW CF81 9DX |
| Lewis Street | CF81 9DY CF81 9DZ CF81 9EA |
| Lon Ty Gwyn | CF81 9AN |
| Marsh Court | CF81 9BF |
| Milton Close | CF81 9FS |
| Mount Pleasant Street | CF81 9BY |
| Neuaddwen Street | CF81 9BD |
| New Road | CF81 9BP |
| Pant Street | CF81 9BB |
| Pant Y Fid Road | CF81 9DT CF81 9DU |
| Pengam Road | CF81 9FT CF81 9FU CF81 9FW |
| Quarry Row | CF81 9AH |
| Rhiwamoth Street | CF81 9BG |
| Rockleigh Avenue | CF81 9BQ |
| Sannan Street | CF81 9BH CF81 9BJ |
| School Street | CF81 9DA |
| Shelley Close | CF81 9FR |
| St Margarets Way | CF81 9GB |
| The Laurels | CF81 9BX |
| Thomas Street | CF81 9DP CF81 9DQ |
| Thorn Villas | CF81 9FN |
| Tredegar Terrace | CF81 9ES |
| Ty Fry Road | CF81 9FL |
| Ty Graig Terrace | CF81 9AU |
| Ty Llwyd Walk | CF81 9BS |
| West View Villas | CF81 9ER |
| William Forbes Bungalows | CF81 9DB |
| William Street | CF81 9FP |
| Y Ffordd Wen | CF81 9EE |
| Yew Street | CF81 9BE |
| CF81 9EB CF81 9ED CF81 9EG |
Transport near Aberbargoed
- FAQ
- Price Paid By Year
- Property Type Price
Frequently asked questions about Aberbargoed
What is the average price for a property for sale in Aberbargoed?
The average price for a property for sale in Aberbargoed is £159,777. This amount is 8% higher than the average price in Bargoed. There are 483 property listings for sale in Aberbargoed.
What streets have the most expensive properties for sale in Aberbargoed?
The streets with the most expensive properties for sale in Aberbargoed are Thorn Villas at an average of £280,000, Y Ffordd Wen at an average of £276,166 and Marsh Court at an average of £261,426.
What streets have the most affordable properties for sale in Aberbargoed?
The streets with the most affordable properties for sale in Aberbargoed are Neuaddwen Street at an average of £102,500, Cwrt Coch Street at an average of £102,611 and Pant Street at an average of £103,000.
Which train stations are available in or near Aberbargoed?
Some of the train stations available in or near Aberbargoed are Bargoed, Gilfach Fargoed and Brithdir.
Property Price Paid in Aberbargoed by Year
The average sold property price by year was:
| Year | Average Sold Price | Price Change |
Sold Properties
|
|---|---|---|---|
| 2025 | £171,014 | 0,1% |
19 Properties |
| 2024 | £170,925 | 16% |
43 Properties |
| 2023 | £143,664 | -23% |
43 Properties |
| 2022 | £176,249 | 7% |
41 Properties |
| 2021 | £164,577 | 8% |
61 Properties |
| 2020 | £151,031 | 26% |
59 Properties |
| 2019 | £112,478 | 10% |
39 Properties |
| 2018 | £101,462 | -9% |
32 Properties |
| 2017 | £110,536 | 17% |
37 Properties |
| 2016 | £91,195 | -19% |
33 Properties |
| 2015 | £108,200 | -35% |
45 Properties |
| 2014 | £146,381 | 52% |
46 Properties |
| 2013 | £70,778 | -33% |
16 Properties |
| 2012 | £94,093 | 9% |
16 Properties |
| 2011 | £85,667 | -1% |
23 Properties |
| 2010 | £86,535 | 15% |
27 Properties |
| 2009 | £73,842 | -58% |
27 Properties |
| 2008 | £116,985 | 0,2% |
52 Properties |
| 2007 | £116,737 | 15% |
63 Properties |
| 2006 | £99,402 | 25% |
35 Properties |
| 2005 | £74,373 | 2% |
45 Properties |
| 2004 | £72,814 | 32% |
37 Properties |
| 2003 | £49,684 | 22% |
44 Properties |
| 2002 | £38,830 | 11% |
51 Properties |
| 2001 | £34,448 | -11% |
38 Properties |
| 2000 | £38,165 | -1% |
41 Properties |
| 1999 | £38,360 | 2% |
57 Properties |
| 1998 | £37,442 | 28% |
32 Properties |
| 1997 | £27,116 | 3% |
21 Properties |
| 1996 | £26,322 | -20% |
27 Properties |
| 1995 | £31,500 | - |
18 Properties |
Property Price per Property Type in Aberbargoed
Here you can find historic sold price data in order to help with your property search.
The average Property Paid Price for specific property types in the last three years are:
| Property Type | Average Sold Price | Sold Properties |
|---|---|---|
| Semi Detached House | £168,647.00 | 28 Semi Detached Houses |
| Detached House | £292,692.00 | 17 Detached Houses |
| Terraced House | £117,979.00 | 60 Terraced Houses |

