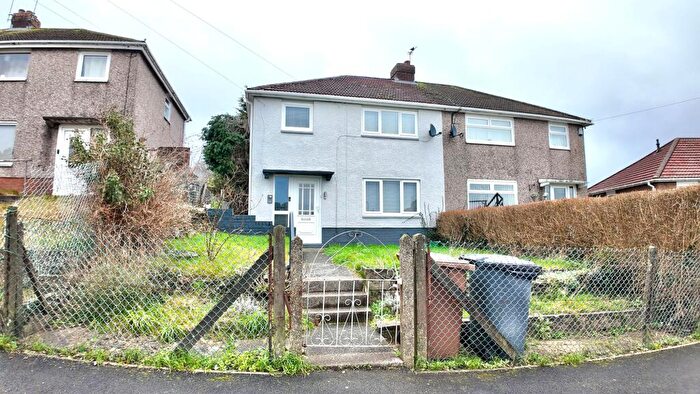
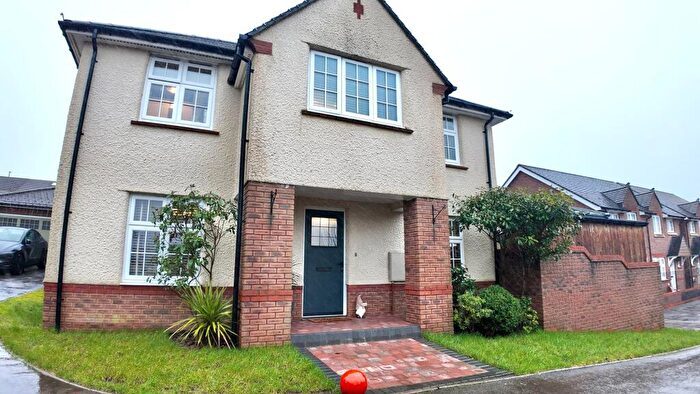
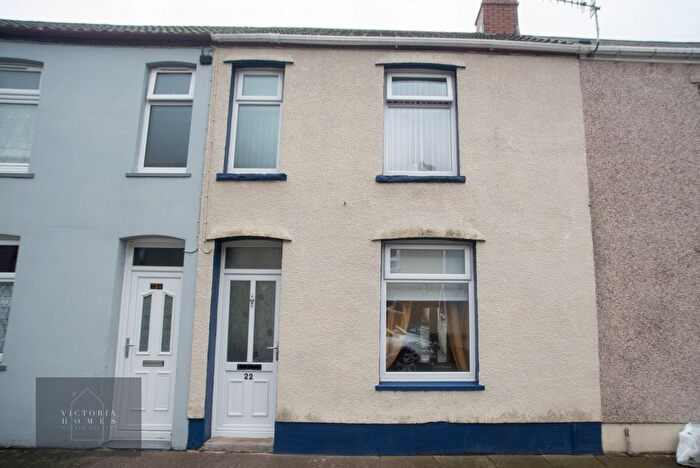
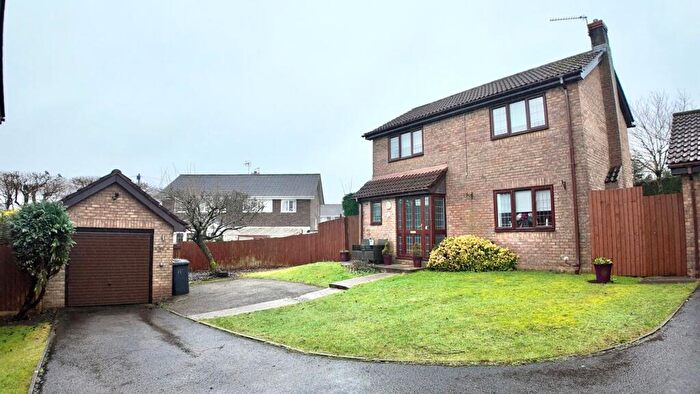
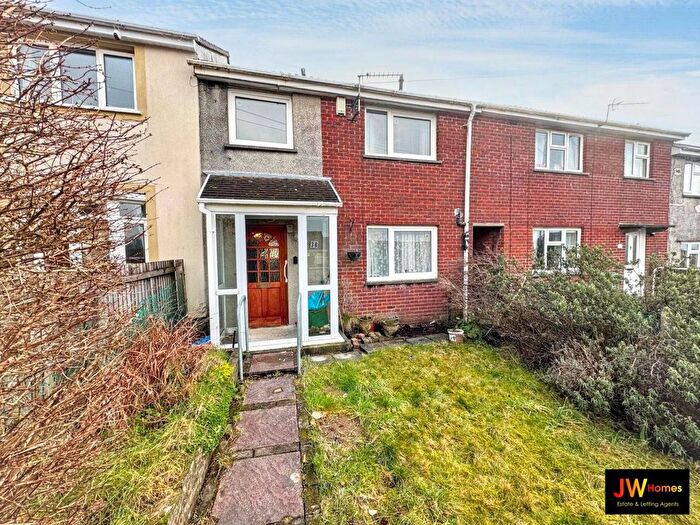
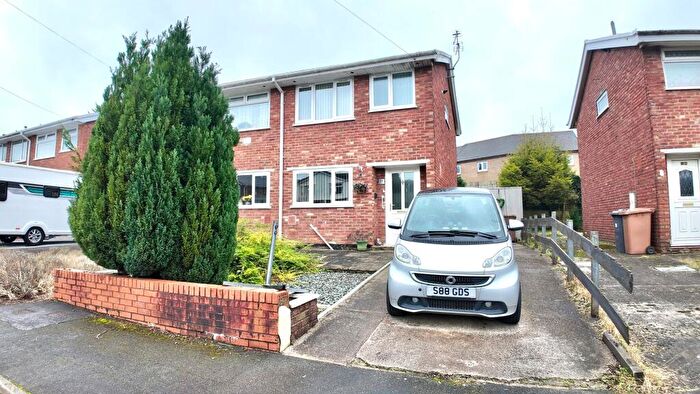
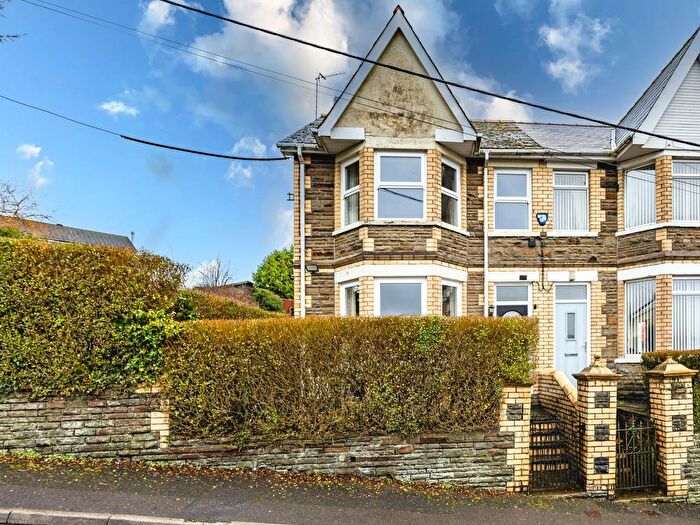
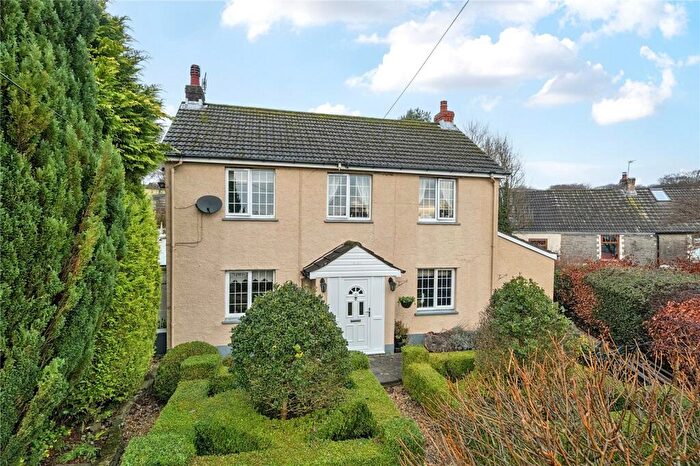
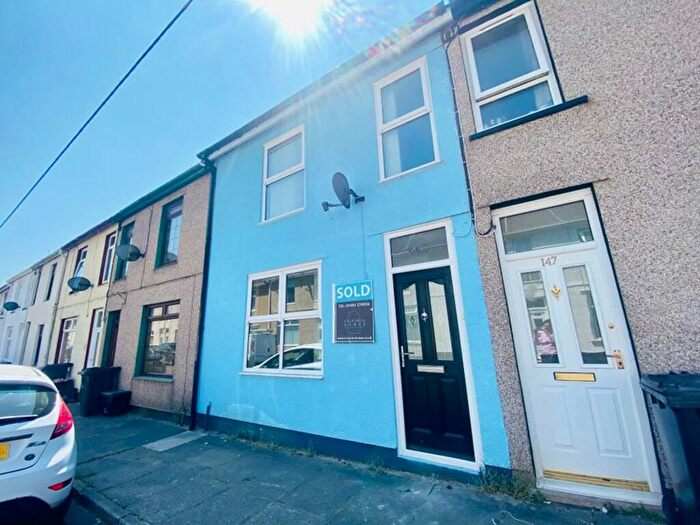
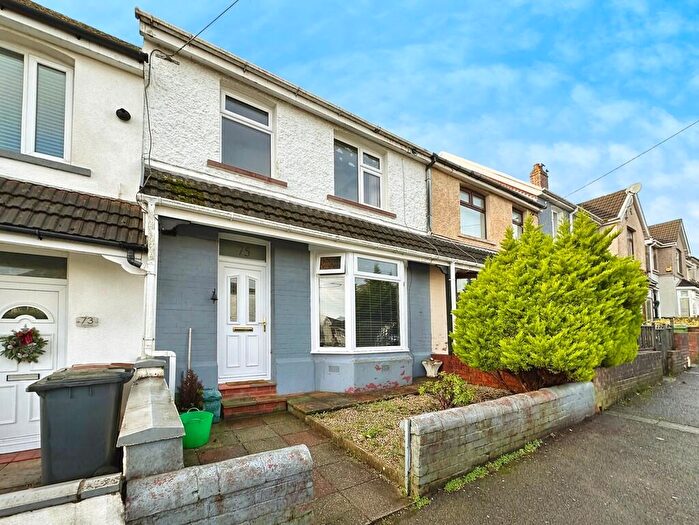
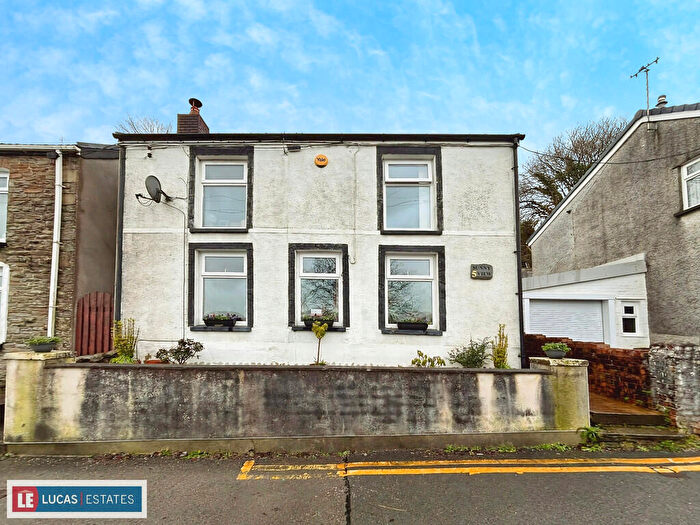
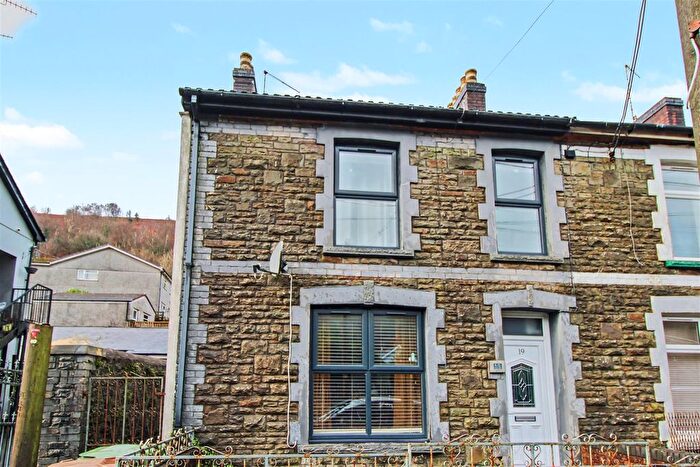
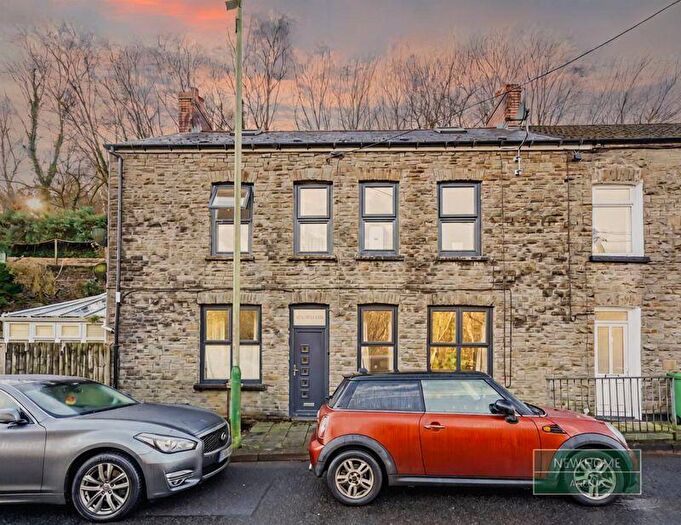
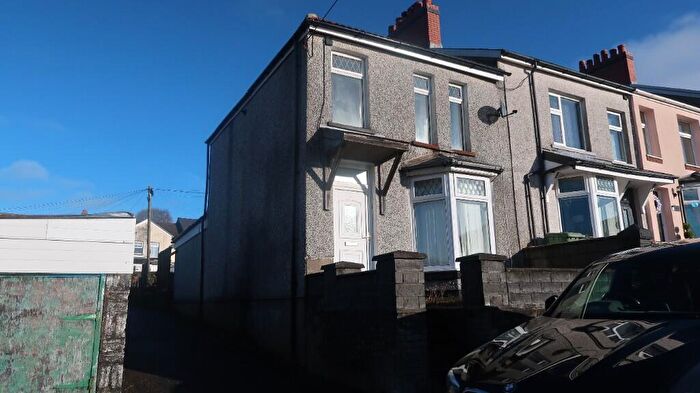
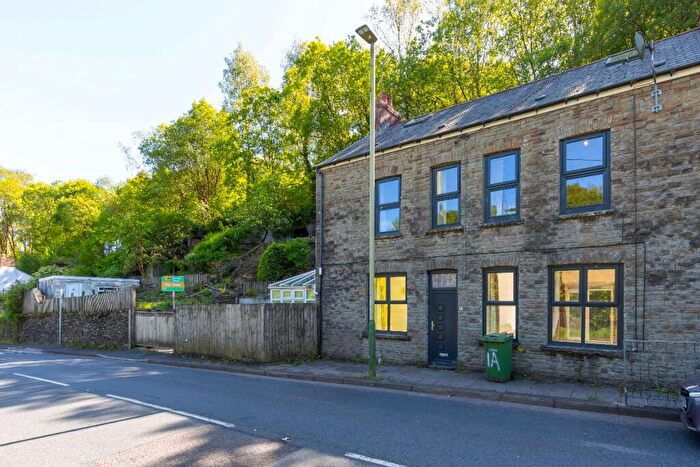
Houses for sale & to rent in Argoed, Blackwood
House Prices in Argoed
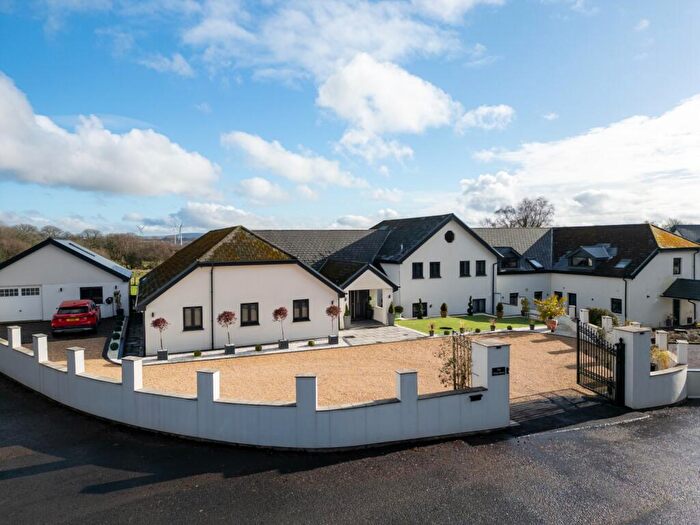
Properties in Argoed have an average house price of £171,117.00 and had 82 Property Transactions within the last 3 years¹.
Argoed is an area in Blackwood, Caerffili - Caerphilly with 1,106 households², where the most expensive property was sold for £520,000.00.
Properties for sale in Argoed
Roads and Postcodes in Argoed
Navigate through our locations to find the location of your next house in Argoed, Blackwood for sale or to rent.
| Streets | Postcodes |
|---|---|
| Abernant Crescent | NP12 0QL |
| Abernant Road | NP12 0PR NP12 0PS NP12 0QH NP12 0QJ |
| Ancient Druid Cottages | NP12 0SD |
| Banalog Terrace | NP12 0SF NP12 0SG |
| Berllanllwyd Avenue | NP12 0QQ |
| Bryn Crescent | NP12 0QG |
| Bryn Road | NP12 0QA NP12 0QB NP12 0QE NP12 0QF |
| Cherry Trees | NP12 0QW |
| Commins Close | NP12 0QT |
| Courtabella | NP12 0HT |
| Cwm Road | NP12 0HJ |
| Gellir Felin | NP12 0HS |
| Gelynos Avenue | NP12 0AT |
| George Street | NP12 0AW |
| Glanyravon Cottages | NP12 0SN |
| Glen View | NP12 0SQ |
| Great Western Cottages | NP12 0SB |
| Greenfield Terrace | NP12 0HL |
| Grwyne Place | NP12 0HE |
| Grwyne Terrace | NP12 0HD |
| Heol Tynewydd | NP12 0BJ |
| Heol Y Bedw Hirion | NP12 0SU |
| High Street | NP12 0HG NP12 0HQ NP12 0HH |
| Hillside Avenue | NP12 0PT |
| James Street | NP12 0QN NP12 0QP |
| John Street | NP12 0QS |
| Lawrence Avenue | NP12 0PW |
| Llwynbach Terrace | NP12 0SH |
| Lower James Street | NP12 0HW |
| Maesruddud Lane | NP12 0AE |
| Manmoel Crossing | NP12 0AX |
| Manmoel Road | NP12 0GA NP12 0HY |
| Markham Terrace | NP12 0RB |
| Monmouth Walk | NP12 0QR |
| Mountain View | NP12 0QU |
| New Road | NP12 0AN NP12 0AR NP12 0AS NP12 0HF |
| Newport Road | NP12 0BN |
| Pantycefn Road | NP12 0PX NP12 0QD NP12 0QX |
| Pen Deri Farm Lane | NP12 0HU |
| Pen Rhiw Gwaith Lane | NP12 0ST |
| Pentre Cottages | NP12 0RN |
| Penylan Road | NP12 0AU NP12 0AY NP12 0AZ |
| Penywerlod Road | NP12 0PY NP12 0PZ |
| Penywerlod Terrace | NP12 0RE |
| Pont Gwaith Yr Haearn Farm Lane | NP12 0RP |
| Railway Terrace | NP12 0SJ NP12 0SP NP12 0SW NP12 0SR |
| Rock Villas | NP12 0AD |
| Springfield Terrace | NP12 0SE |
| Sunnyview | NP12 0AJ NP12 0AL |
| The Rock | NP12 0AA NP12 0AB NP12 1DD |
| The Village | NP12 0RJ |
| The Villas | NP12 0PU |
| Upper James Street | NP12 0HP |
| William Street | NP12 0SL |
| Woodland Houses | NP12 0RZ |
| Woodland Terrace | NP12 0HB |
| Woodville Terrace | NP12 0AP |
| Wyrloed Cottages | NP12 0RL |
| NP12 0BA NP12 0HR NP12 0JA NP12 0RA NP12 0RW NP12 0RX NP12 0GD NP12 0HA NP12 0JD NP12 0RH NP12 0RQ NP12 0SA NP12 0SS |
Transport near Argoed
-
Brithdir Station
-
Bargoed Station
-
Gilfach Fargoed Station
-
Tir-Phil Station
-
Pengam Station
-
Llanhilleth Station
- FAQ
- Price Paid By Year
- Property Type Price
Frequently asked questions about Argoed
What is the average price for a property for sale in Argoed?
The average price for a property for sale in Argoed is £171,117. This amount is 15% lower than the average price in Blackwood. There are 2,206 property listings for sale in Argoed.
What streets have the most expensive properties for sale in Argoed?
The streets with the most expensive properties for sale in Argoed are Banalog Terrace at an average of £510,000, Cherry Trees at an average of £285,000 and Greenfield Terrace at an average of £265,000.
What streets have the most affordable properties for sale in Argoed?
The streets with the most affordable properties for sale in Argoed are Llwynbach Terrace at an average of £87,000, The Villas at an average of £96,833 and Grwyne Place at an average of £104,250.
Which train stations are available in or near Argoed?
Some of the train stations available in or near Argoed are Brithdir, Bargoed and Gilfach Fargoed.
Property Price Paid in Argoed by Year
The average sold property price by year was:
| Year | Average Sold Price | Price Change |
Sold Properties
|
|---|---|---|---|
| 2025 | £188,604 | 15% |
24 Properties |
| 2024 | £160,234 | -5% |
32 Properties |
| 2023 | £168,369 | -13% |
26 Properties |
| 2022 | £189,748 | 23% |
38 Properties |
| 2021 | £145,761 | 7% |
38 Properties |
| 2020 | £135,215 | 25% |
30 Properties |
| 2019 | £100,933 | -9% |
40 Properties |
| 2018 | £109,762 | -16% |
32 Properties |
| 2017 | £126,795 | 11% |
26 Properties |
| 2016 | £113,074 | -1% |
27 Properties |
| 2015 | £114,317 | 17% |
33 Properties |
| 2014 | £94,313 | 7% |
23 Properties |
| 2013 | £87,667 | 14% |
31 Properties |
| 2012 | £75,493 | -38% |
16 Properties |
| 2011 | £103,908 | -3% |
17 Properties |
| 2010 | £107,482 | -1% |
17 Properties |
| 2009 | £108,785 | -43% |
21 Properties |
| 2008 | £155,345 | 20% |
30 Properties |
| 2007 | £124,393 | 11% |
42 Properties |
| 2006 | £110,902 | 8% |
37 Properties |
| 2005 | £101,878 | 26% |
25 Properties |
| 2004 | £74,977 | 23% |
44 Properties |
| 2003 | £57,464 | 22% |
44 Properties |
| 2002 | £44,926 | 11% |
48 Properties |
| 2001 | £39,773 | 5% |
49 Properties |
| 2000 | £37,915 | -24% |
28 Properties |
| 1999 | £47,002 | 22% |
44 Properties |
| 1998 | £36,832 | 11% |
29 Properties |
| 1997 | £32,913 | 10% |
29 Properties |
| 1996 | £29,772 | -10% |
24 Properties |
| 1995 | £32,886 | - |
22 Properties |
Property Price per Property Type in Argoed
Here you can find historic sold price data in order to help with your property search.
The average Property Paid Price for specific property types in the last three years are:
| Property Type | Average Sold Price | Sold Properties |
|---|---|---|
| Semi Detached House | £179,793.00 | 36 Semi Detached Houses |
| Detached House | £324,875.00 | 8 Detached Houses |
| Terraced House | £130,527.00 | 38 Terraced Houses |

