
Houses for sale in St. James, Cardiff
House Prices in St. James
Properties in St. James have an average house price of £700k and had 5 Property Transactions within the last 3 years¹.
St. James is an area in Cardiff, Caerffili - Caerphilly with 78 households², where the most expensive property was sold for £1.25M.
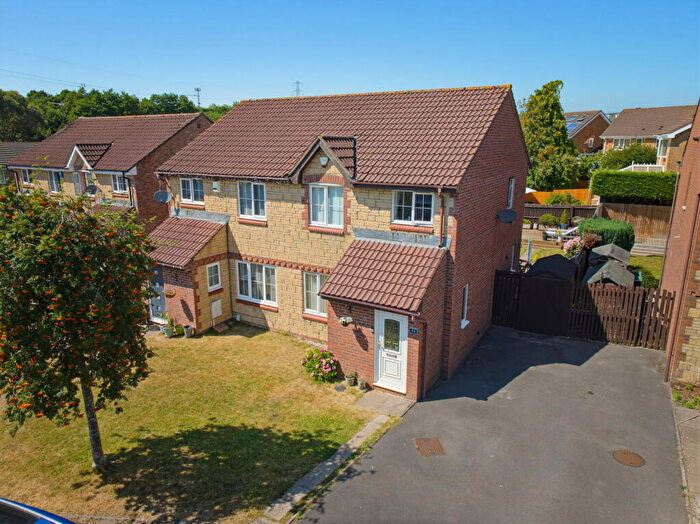
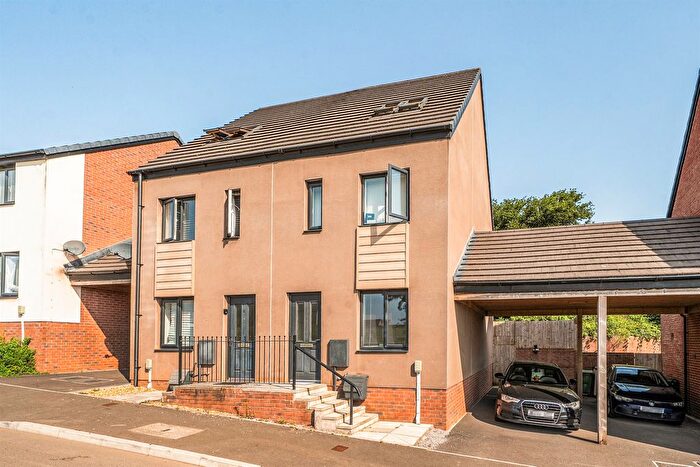
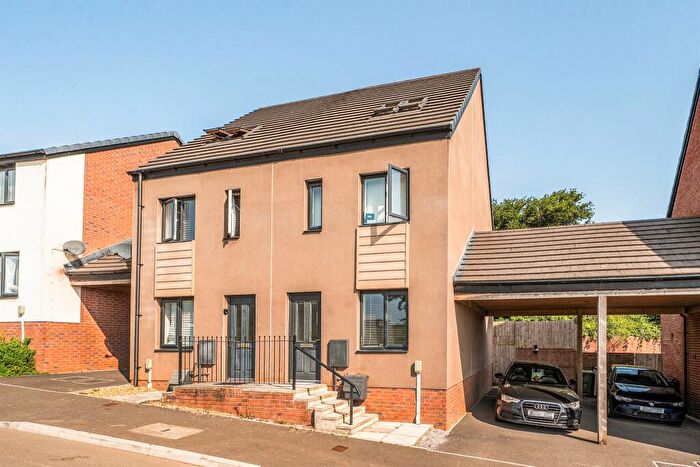
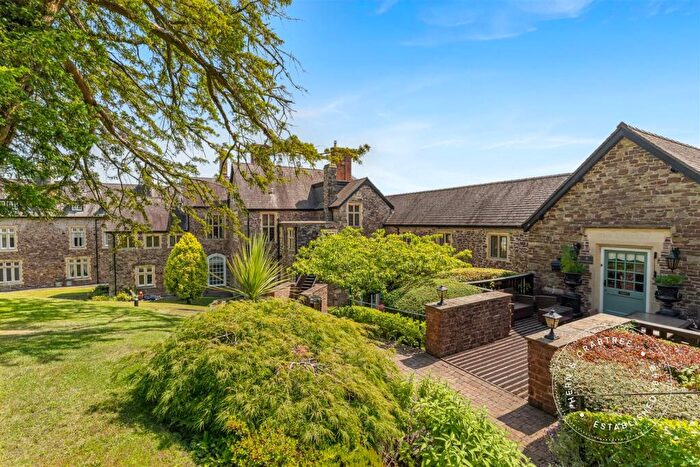
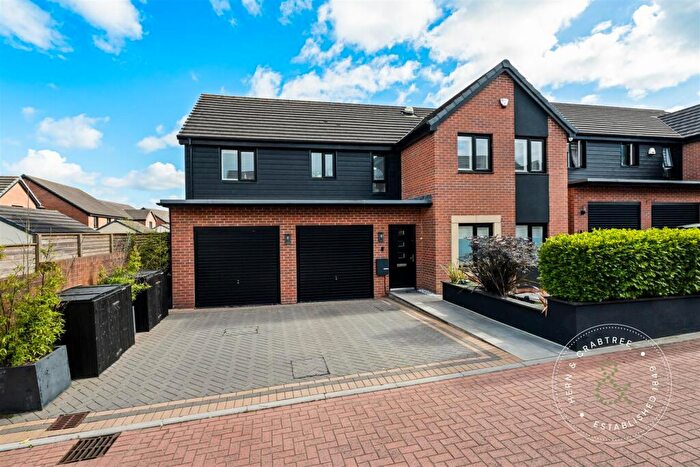
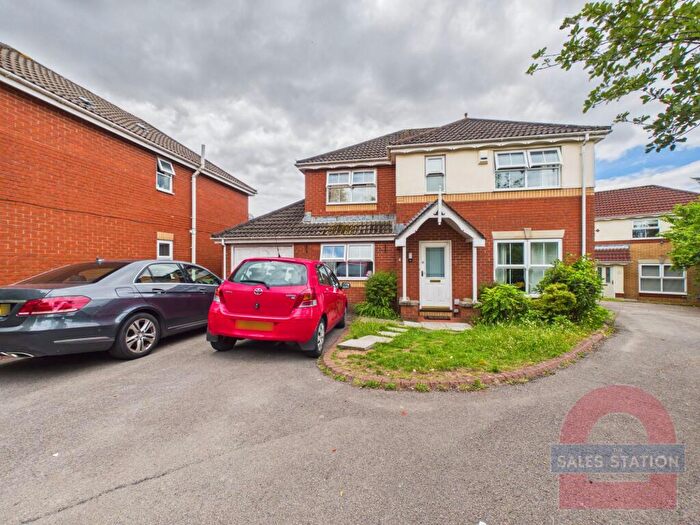
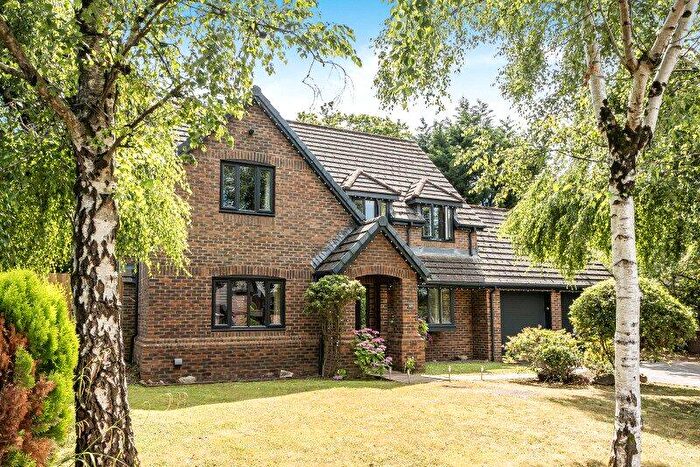
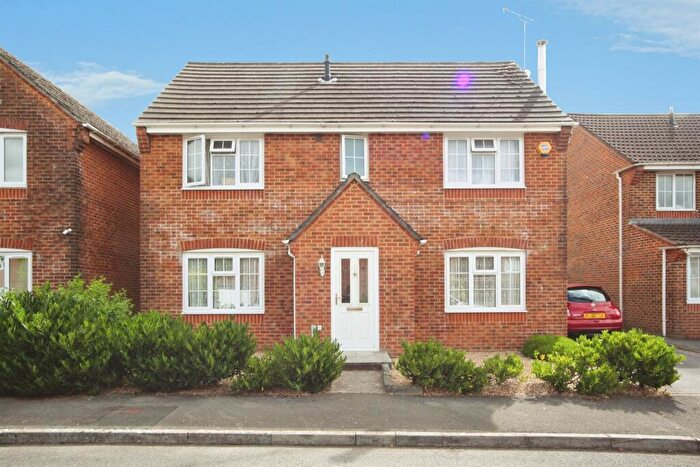
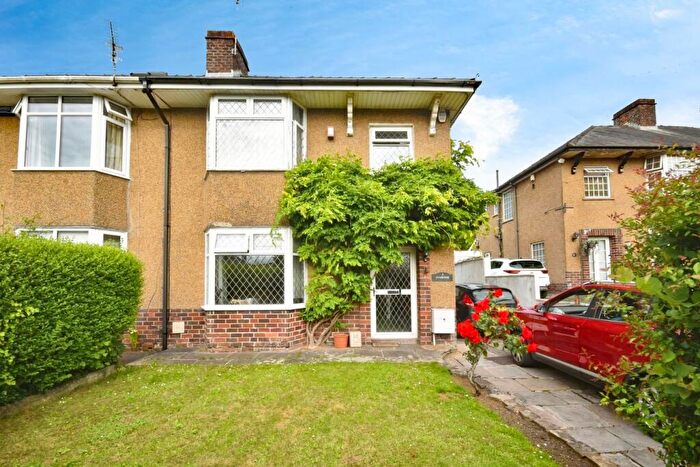
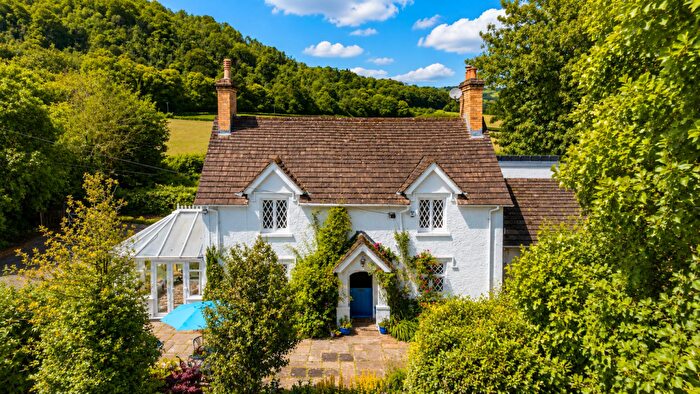
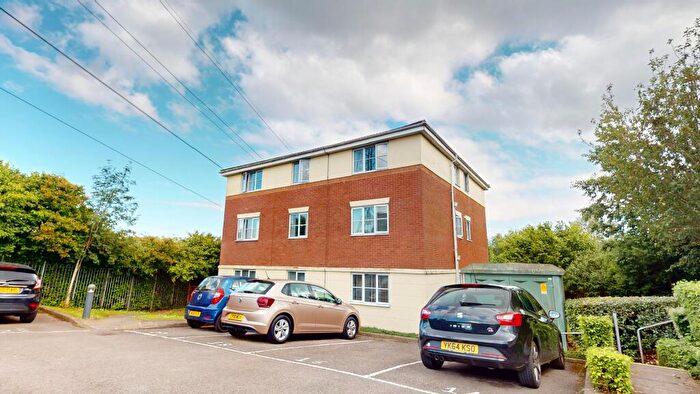
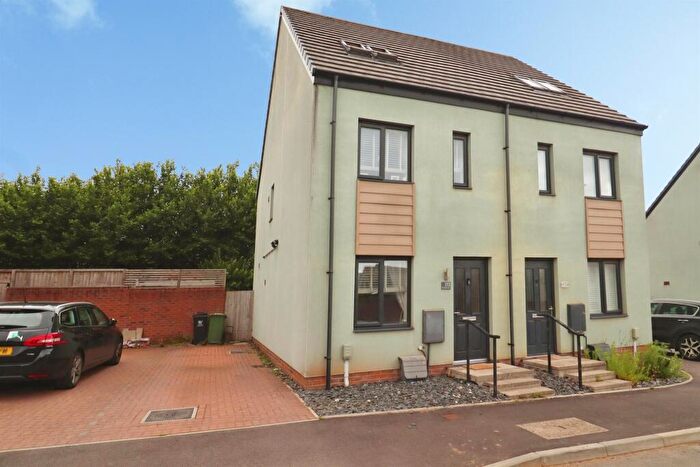
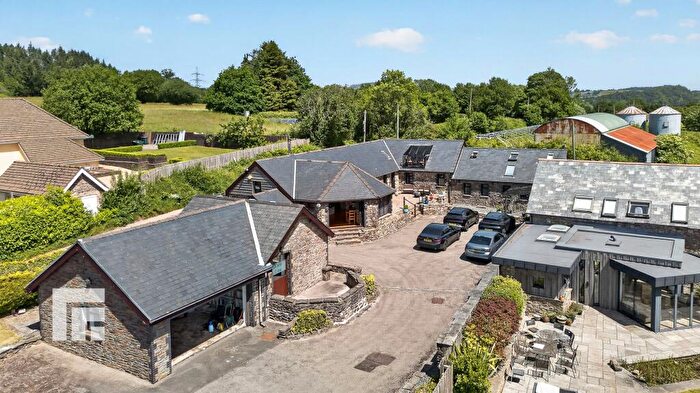
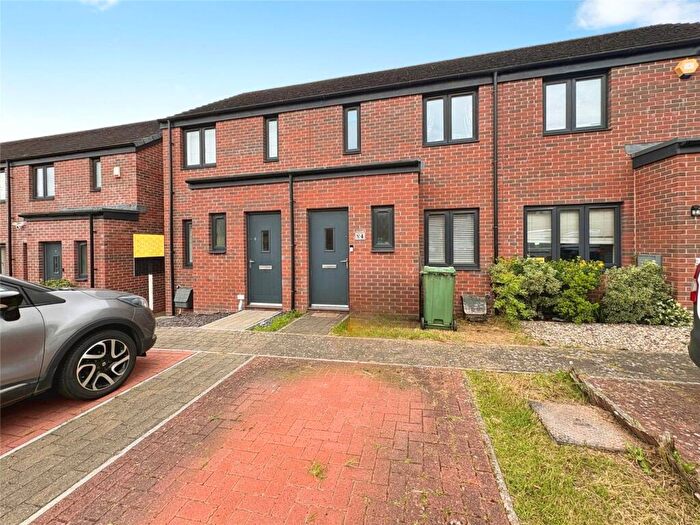
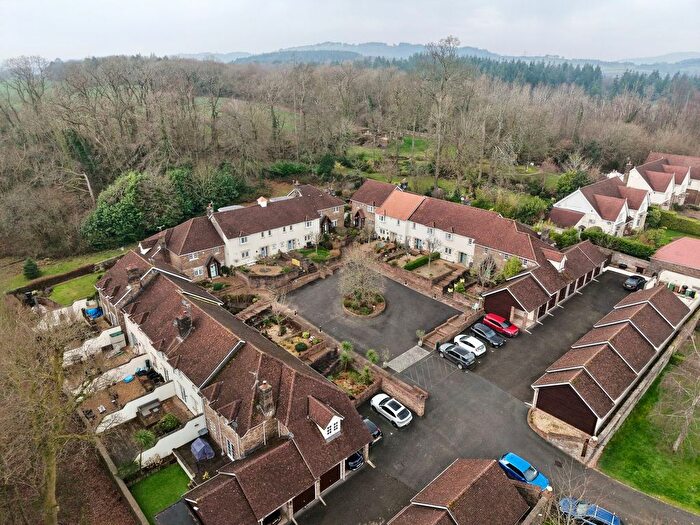
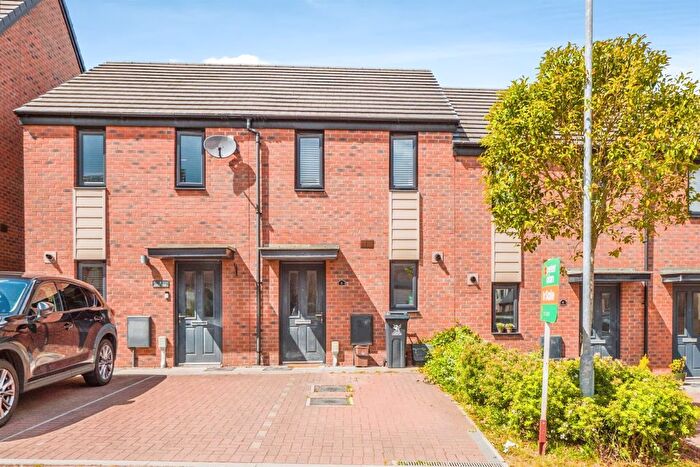
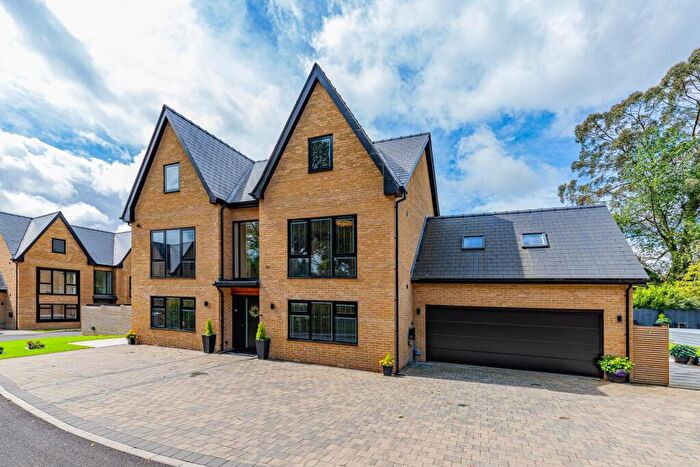
Properties for sale in St. James
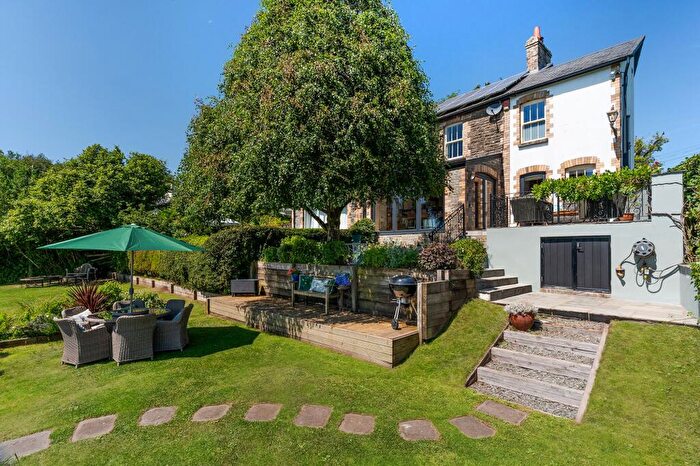
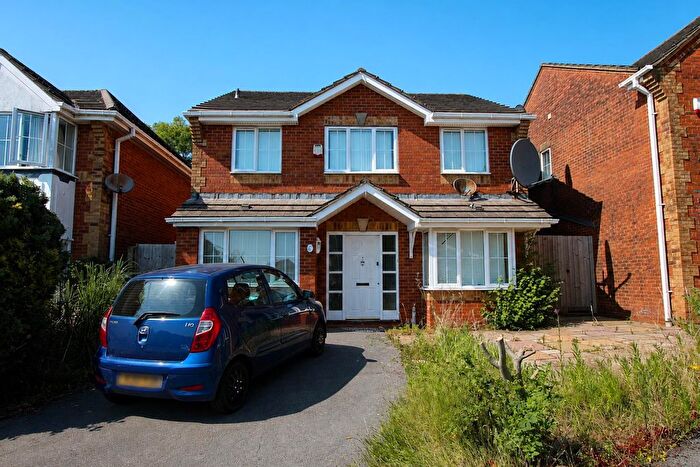
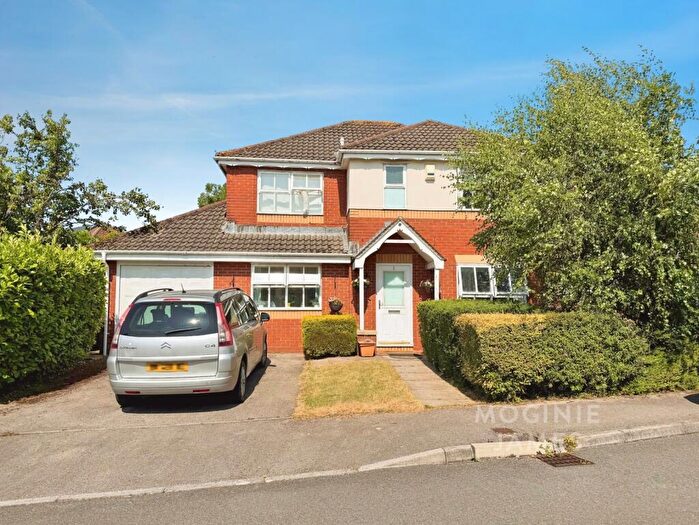
![]()
If you are looking to sell your house, let it out, or receive a property valuation, an expert can help you.
Click the button below to get started.

Roads and Postcodes in St. James
Navigate through our locations to find the location of your next house in St. James, Cardiff for sale or to rent.
| Streets | Postcodes |
|---|---|
| Cefn Mably Park | CF3 6AA |
| Cefn Porth Road | CF14 0LB CF14 0LE |
| Minorca Cottages | CF3 6XX |
| Tai Derwen | CF3 6XR |
| CF3 6LP |
Property price trends in St. James
According to the latest Land Registry data, the average home in St. James sold for £530,000 in 2024. That figure comes from 131 sales logged over the past 28 years.
Prices have continued to climb over the last three years. Compared with 2021, when the typical sale came in around £360,000, that's a rise of roughly 47.2%.
Looking back five years, average prices are down about 20.1% since 2019, a drop of around £133,125 in cash terms.
Zoom out to the past decade for the fuller picture. Back in 2014, homes here averaged £524,737, so the typical sold price has climbed about 1% since then, roughly 0.1% a year. Stretch the view to fifteen years and that annual pace eases back to about -4.1%.
Frequently asked questions about St. James
What is the average price for a property for sale in St. James?
The average price for a property for sale in St. James is £700,000. This amount is 28% higher than the average price in Cardiff. There are 735 property listings for sale in St. James.
Which train stations are available in or near St. James?
Some of the train stations available in or near St. James are Lisvane and Thornhill, Llanishen and Risca and Pontymister.
Property Price Paid in St. James by Year
The average sold property price by year was:
| Year | Average Sold Price | Price Change |
Sold Properties
|
|---|---|---|---|
| 2024 | £530,000 | -53% |
2 Properties |
| 2023 | £813,333 | 56% |
3 Properties |
| 2021 | £360,000 | -35% |
1 Property |
| 2020 | £487,000 | -36% |
5 Properties |
| 2019 | £663,125 | -15% |
8 Properties |
| 2018 | £765,250 | 42% |
4 Properties |
| 2017 | £440,968 | -10% |
8 Properties |
| 2016 | £486,250 | 13% |
6 Properties |
| 2015 | £421,250 | -25% |
4 Properties |
| 2014 | £524,737 | -2% |
4 Properties |
Property Price per Property Type in St. James
Here you can find historic sold price data in order to help with your property search.
The average Property Paid Price for specific property types in the last three years are:
| Property Type | Average Sold Price | Sold Properties |
|---|---|---|
| Semi Detached House | £600,000.00 | 1 Semi Detached House |
| Flat | £550,000.00 | 3 Flats |
| Detached House | £1,250,000.00 | 1 Detached House |
