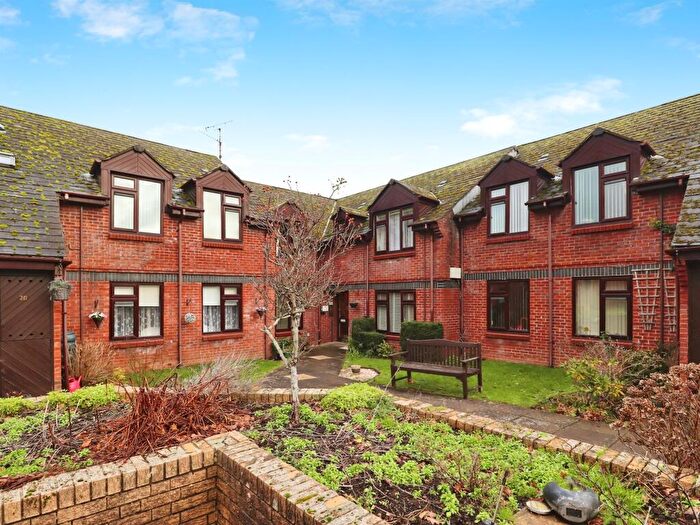
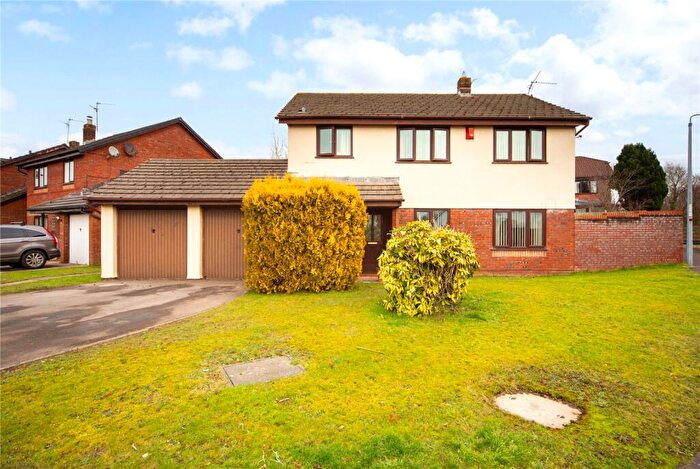
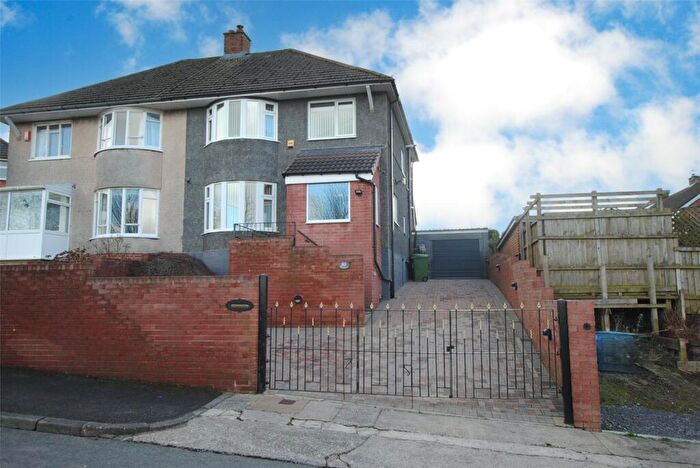
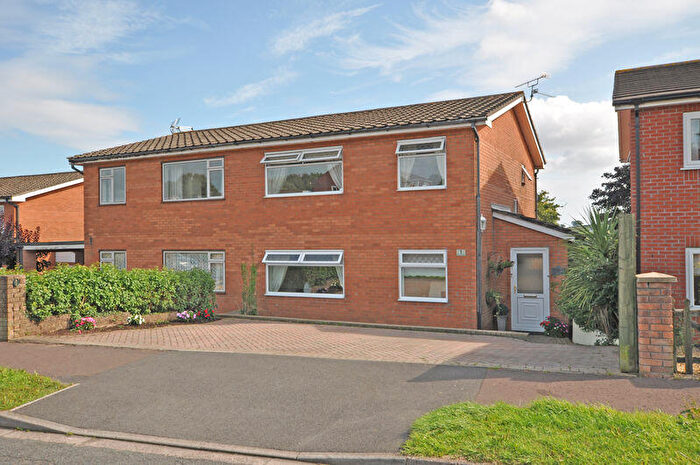
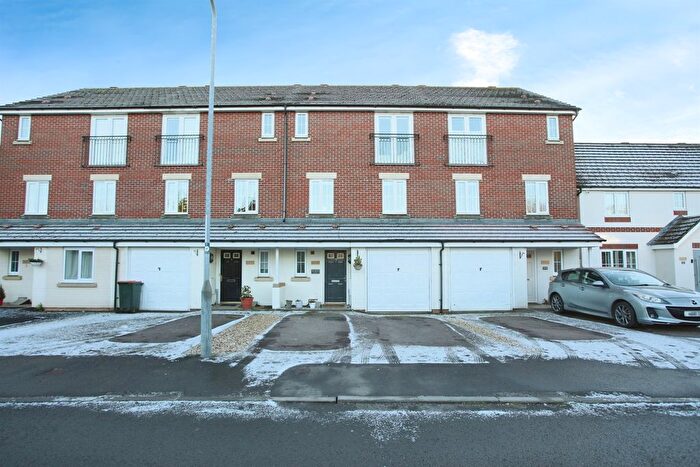
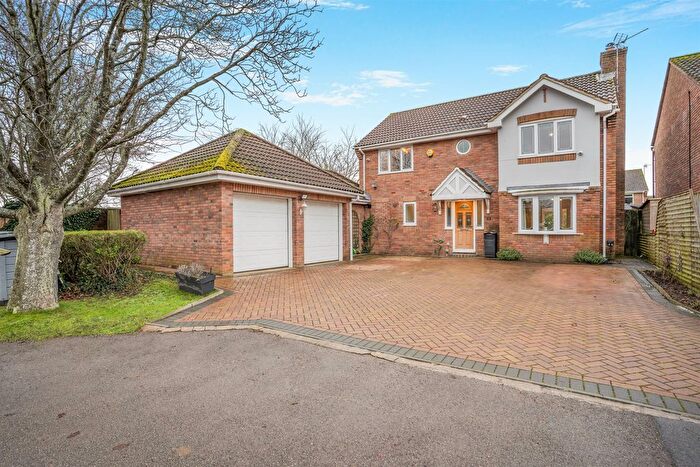
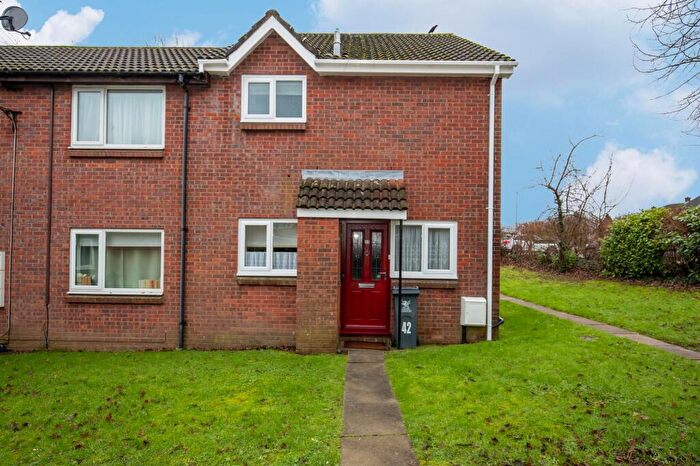
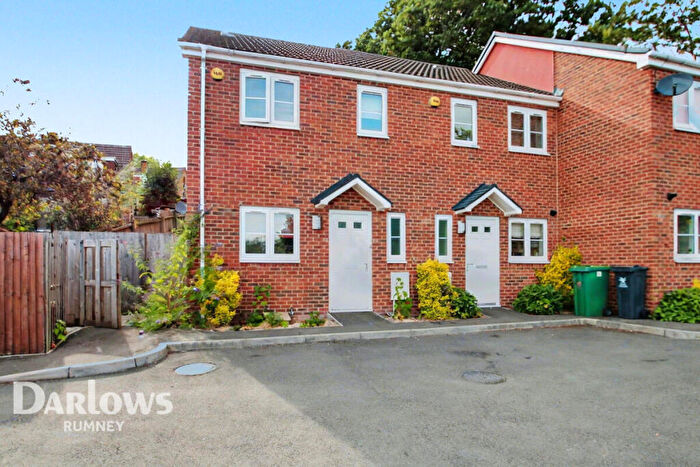
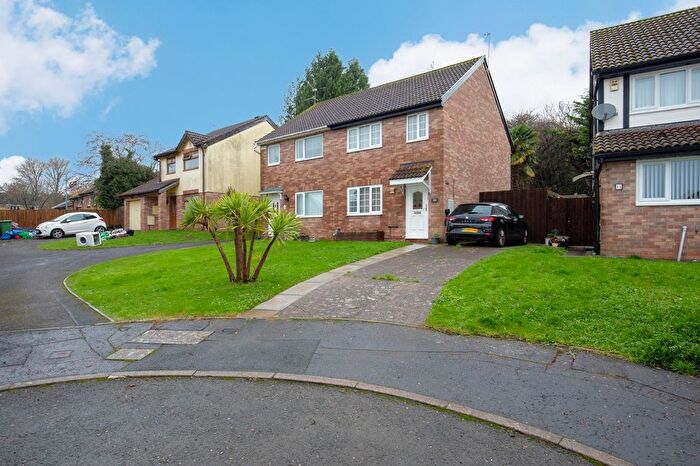
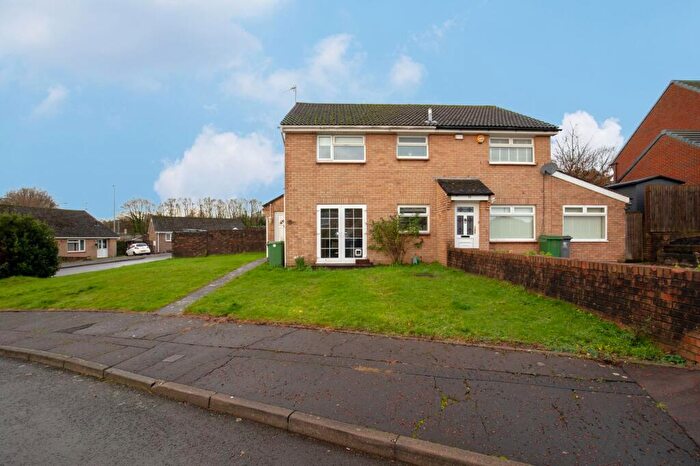
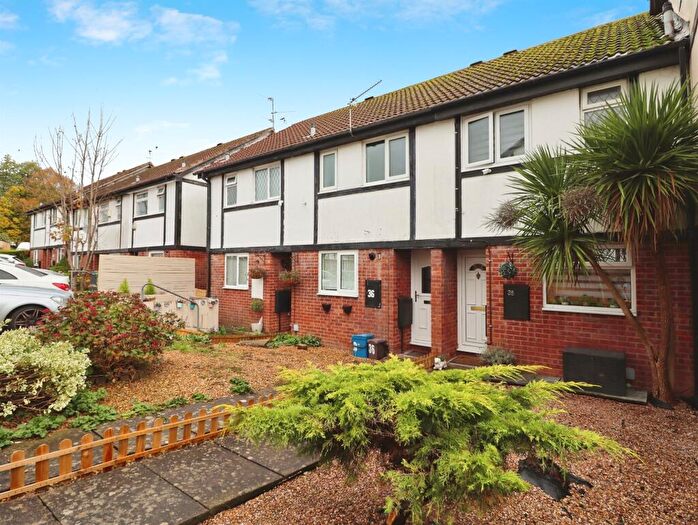
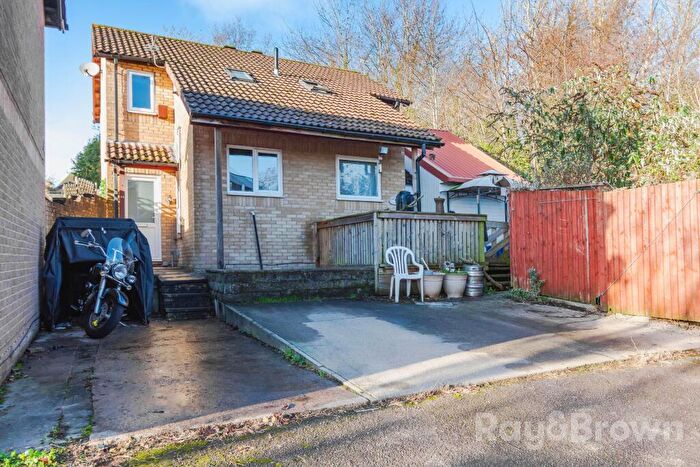
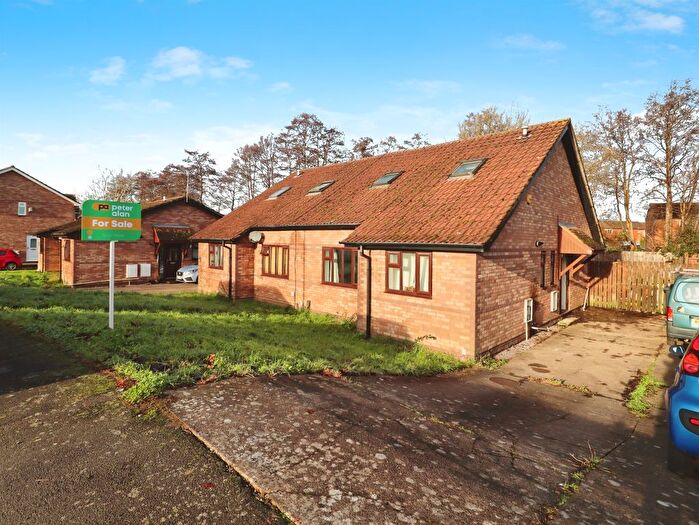
Houses for sale & to rent in Marshfield, Cardiff
House Prices in Marshfield
Properties in Marshfield have an average house price of £438,249.00 and had 127 Property Transactions within the last 3 years¹.
Marshfield is an area in Cardiff, Casnewydd - Newport with 1,289 households², where the most expensive property was sold for £1,550,000.00.
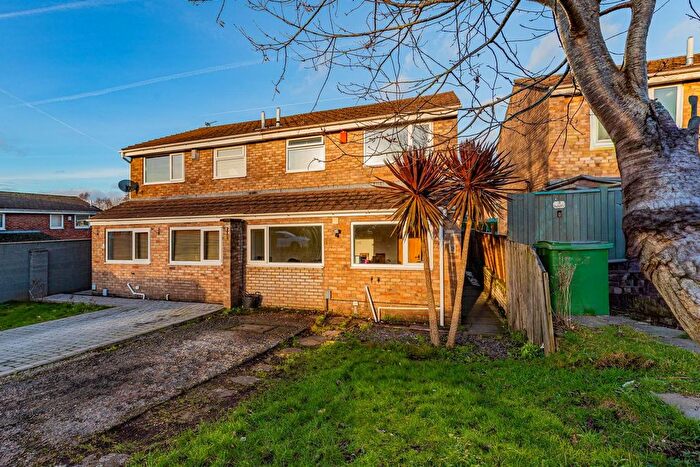
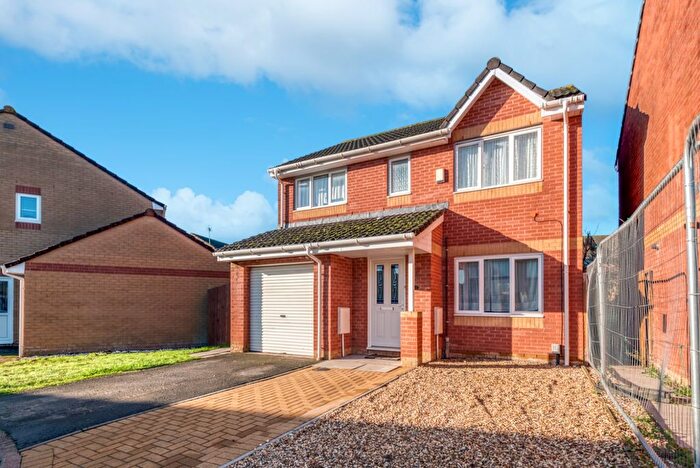
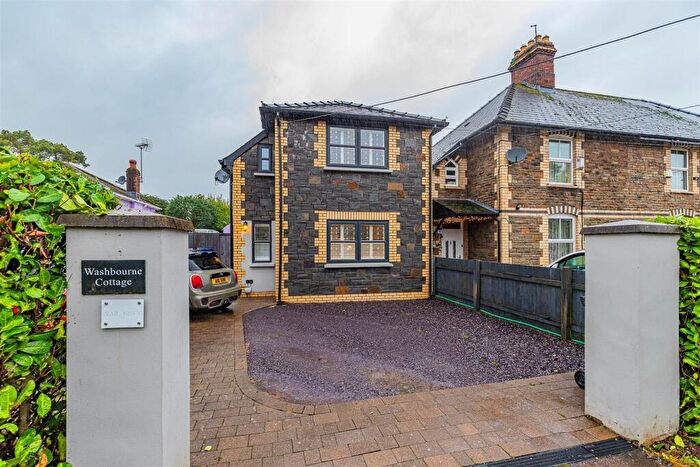
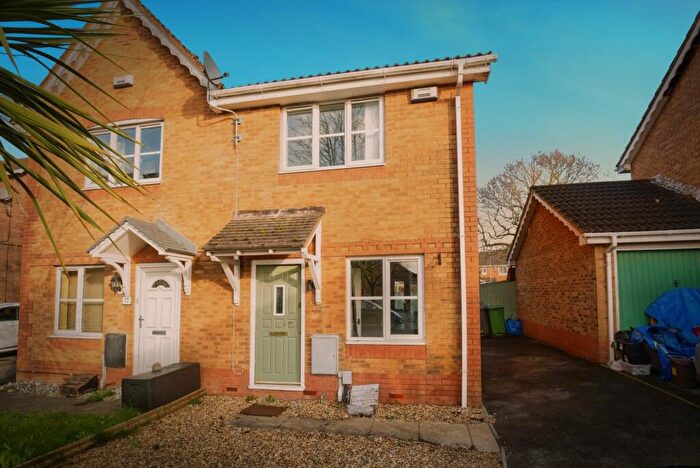
Properties for sale in Marshfield
Roads and Postcodes in Marshfield
Navigate through our locations to find the location of your next house in Marshfield, Cardiff for sale or to rent.
| Streets | Postcodes |
|---|---|
| Acorn Place | CF3 2WE |
| Afon Close | CF3 6XU |
| Bakers Court | CF3 2UJ |
| Bakery Lane | CF3 2LF |
| Began Road | CF3 6XL |
| Blacktown Gardens | CF3 2SF |
| Bridge Terrace | CF3 6YZ |
| Broad Street Common | CF3 2TN |
| Cae Brandi | CF3 2TZ |
| Cambrian Close | CF3 2TB |
| Cambrian Crescent | CF3 2TD |
| Cambrian Drive | CF3 2TE |
| Cambrian Gardens | CF3 2TF |
| Cambrian Grove | CF3 2US |
| Cambrian Way | CF3 2WB |
| Castleton Gardens | CF3 2WD |
| Castleton Rise | CF3 2WA |
| Catherine Drive | CF3 2XB |
| Channel View | CF3 2UP |
| Church Close | CF3 2TP |
| Church Lane | CF3 2UF |
| Coal Pit Lane | CF3 6WQ |
| Craig Yr Haul Drive | CF3 2SA CF3 2SE |
| Craig Yr Haul Lane | CF3 2NJ |
| Druidstone Road | CF3 6XE CF3 6XF |
| Green Lane | CF3 2TS CF3 2WF |
| Groes Fawr Close | CF3 2AH |
| Herbert Close | CF3 2UD |
| Mallards Reach | CF3 2NL CF3 2NN CF3 2PR |
| Marshfield Road | CF3 2TT CF3 2TU CF3 2UH CF3 2UU CF3 2UW |
| Marysfield Close | CF3 2TY |
| Meadow View | CF3 2TQ |
| Mill Lane | CF3 2UT |
| Newport Road | CF3 2UN CF3 2UQ CF3 2UR CF3 2WH |
| Oakfields | CF3 2EZ |
| Old Green Court | CF3 2UE |
| Orchard Close | CF3 2UA |
| Pentwyn Terrace | CF3 2TW CF3 2UL |
| Sandy Lane | CF3 2UX |
| Springfields | CF3 2LG |
| St Davids Court | CF3 2TH |
| St Mellons Road | CF3 2TX |
| St Peters Crescent | CF3 2TR |
| The Grange | CF3 2TG |
| The Hollies | CF3 2UG |
| The Meadows | CF3 2AY CF3 2DY |
| The Shires | CF3 2AW CF3 2AX CF3 2AZ |
| Ty Mawr Lane | CF3 2YF |
| Tyla Lane | CF3 6XG |
| Tynewydd Drive | CF3 2SB |
| Vicarage Court | CF3 2NA |
| Vicarage Gardens | CF3 2PS |
| Walk Farm Drive | CF3 2UY |
| Wellfield Court | CF3 2TJ |
| Wellfield Road | CF3 2UB |
| Wentloog Rise | CF3 2SD |
| Whitethorn Way | CF3 2TL |
| Woodfield Close | CF3 2TA |
| CF3 6XS CF3 6XT CF3 2XR CF3 2XS CF3 6US CF3 6XW |
Transport near Marshfield
-
Pye Corner Station
-
Rogerstone Station
-
Llanishen Station
-
Newport (Gwent) Station
-
Heath High Level Station
-
Lisvane and Thornhill Station
-
Heath Low Level Station
-
Risca and Pontymister Station
- FAQ
- Price Paid By Year
- Property Type Price
Frequently asked questions about Marshfield
What is the average price for a property for sale in Marshfield?
The average price for a property for sale in Marshfield is £438,249. There are 1,684 property listings for sale in Marshfield.
What streets have the most expensive properties for sale in Marshfield?
The streets with the most expensive properties for sale in Marshfield are Castleton Rise at an average of £900,000, Groes Fawr Close at an average of £670,000 and Craig Yr Haul Drive at an average of £575,000.
What streets have the most affordable properties for sale in Marshfield?
The streets with the most affordable properties for sale in Marshfield are Bakers Court at an average of £190,000, Pentwyn Terrace at an average of £199,500 and Marysfield Close at an average of £221,083.
Which train stations are available in or near Marshfield?
Some of the train stations available in or near Marshfield are Pye Corner, Rogerstone and Llanishen.
Property Price Paid in Marshfield by Year
The average sold property price by year was:
| Year | Average Sold Price | Price Change |
Sold Properties
|
|---|---|---|---|
| 2025 | £372,477 | -8% |
22 Properties |
| 2024 | £402,984 | -16% |
33 Properties |
| 2023 | £467,500 | -2% |
28 Properties |
| 2022 | £478,970 | 23% |
44 Properties |
| 2021 | £370,659 | -2% |
59 Properties |
| 2020 | £376,829 | 14% |
56 Properties |
| 2019 | £324,053 | -8% |
48 Properties |
| 2018 | £348,585 | 8% |
42 Properties |
| 2017 | £319,343 | -11% |
65 Properties |
| 2016 | £353,292 | 13% |
41 Properties |
| 2015 | £306,180 | 2% |
58 Properties |
| 2014 | £299,813 | 5% |
82 Properties |
| 2013 | £286,019 | 9% |
38 Properties |
| 2012 | £260,946 | -13% |
28 Properties |
| 2011 | £294,134 | -4% |
32 Properties |
| 2010 | £304,458 | 12% |
28 Properties |
| 2009 | £267,898 | -3% |
38 Properties |
| 2008 | £274,637 | 0,4% |
39 Properties |
| 2007 | £273,596 | -0,5% |
70 Properties |
| 2006 | £274,952 | 14% |
81 Properties |
| 2005 | £235,193 | -8% |
90 Properties |
| 2004 | £254,459 | 20% |
89 Properties |
| 2003 | £203,423 | 17% |
44 Properties |
| 2002 | £169,524 | 12% |
64 Properties |
| 2001 | £149,489 | 16% |
56 Properties |
| 2000 | £125,069 | 12% |
57 Properties |
| 1999 | £109,763 | -2% |
64 Properties |
| 1998 | £111,622 | 9% |
34 Properties |
| 1997 | £101,229 | 9% |
98 Properties |
| 1996 | £91,761 | -7% |
109 Properties |
| 1995 | £98,335 | - |
71 Properties |
Property Price per Property Type in Marshfield
Here you can find historic sold price data in order to help with your property search.
The average Property Paid Price for specific property types in the last three years are:
| Property Type | Average Sold Price | Sold Properties |
|---|---|---|
| Semi Detached House | £331,550.00 | 20 Semi Detached Houses |
| Detached House | £514,684.00 | 85 Detached Houses |
| Terraced House | £239,931.00 | 22 Terraced Houses |

