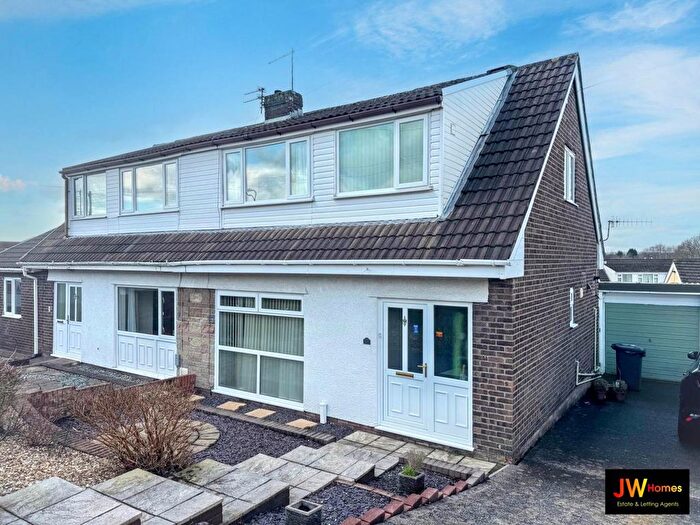
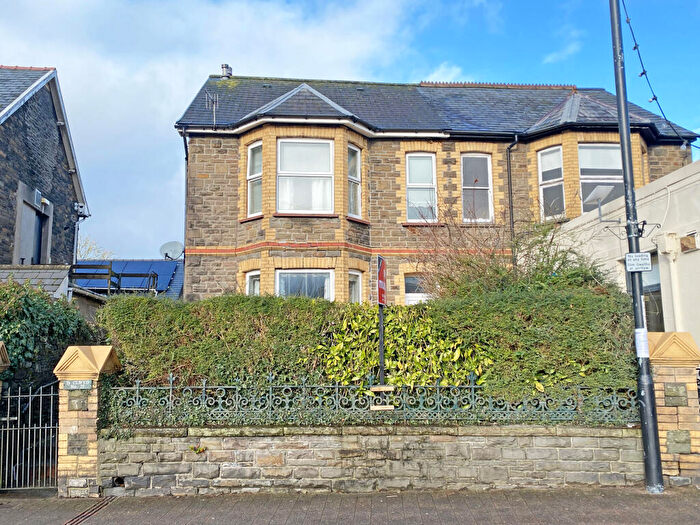
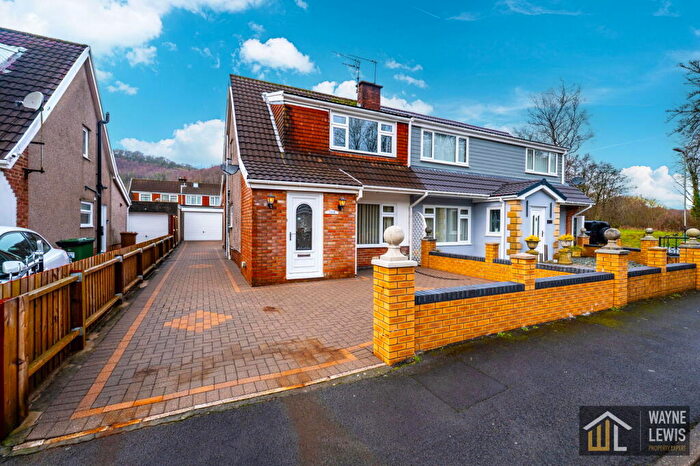
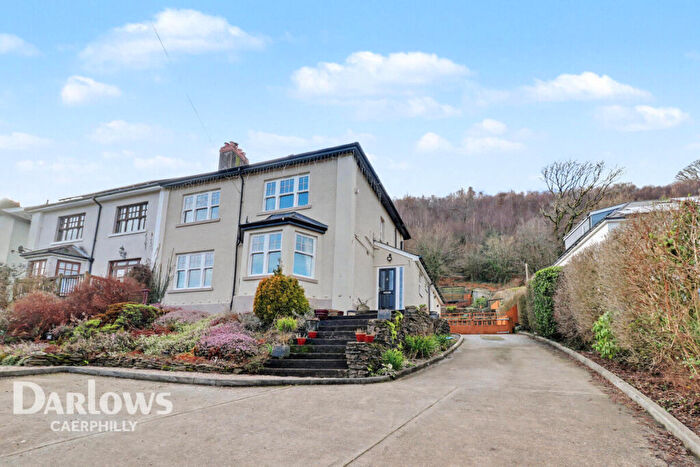
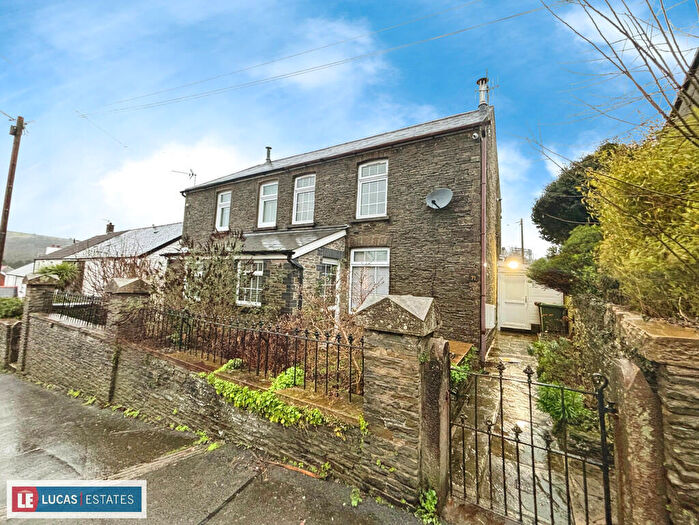
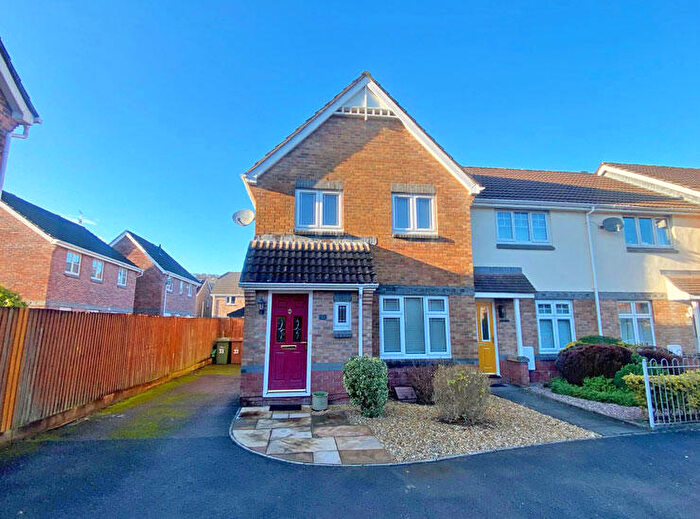
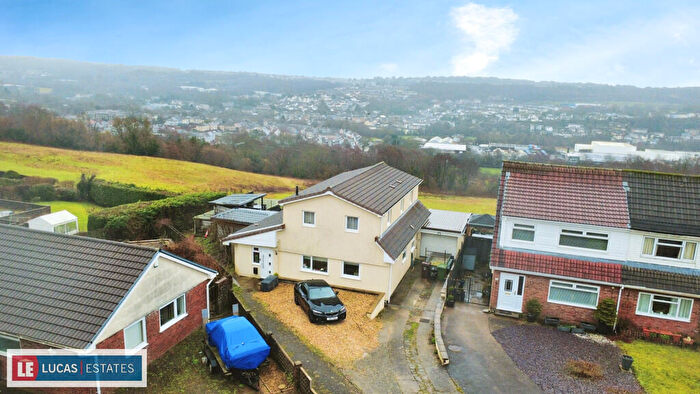
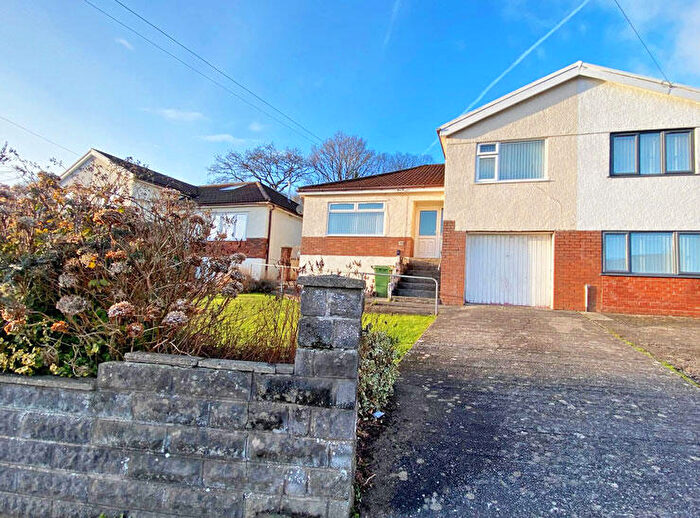
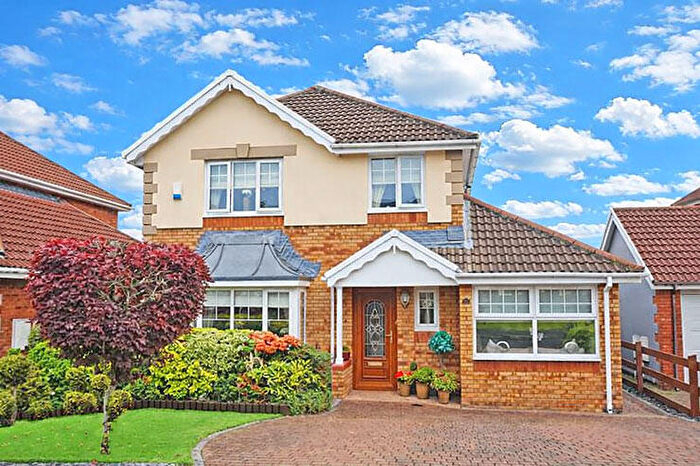
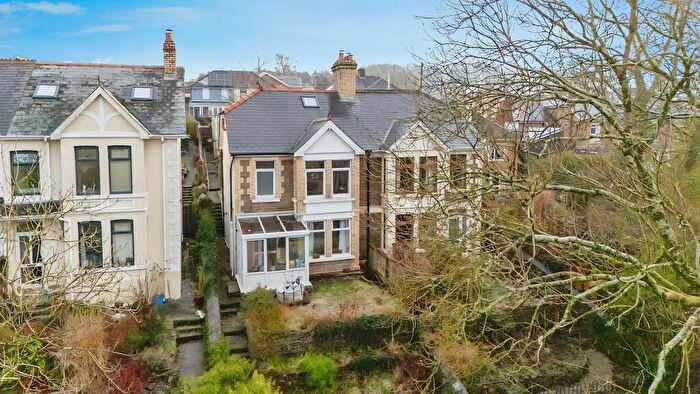
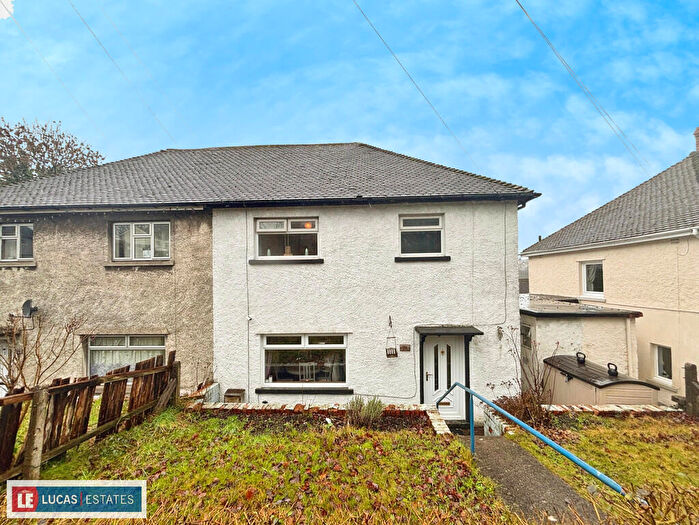
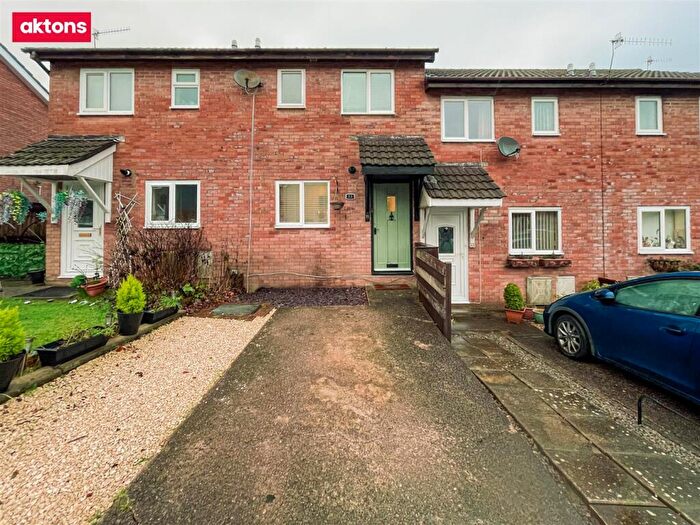
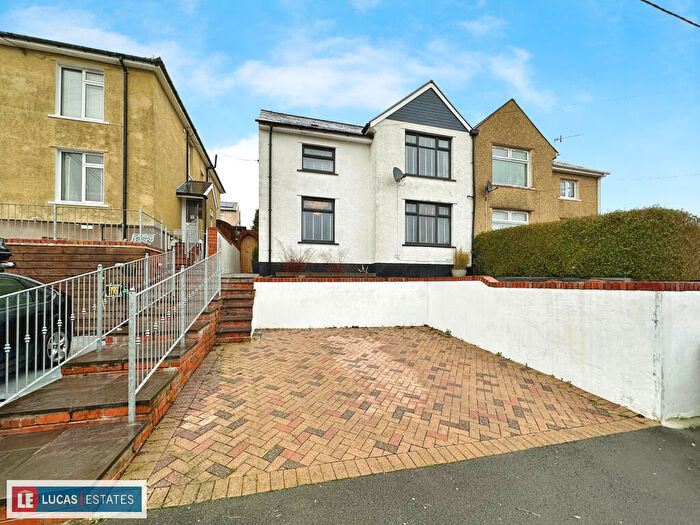
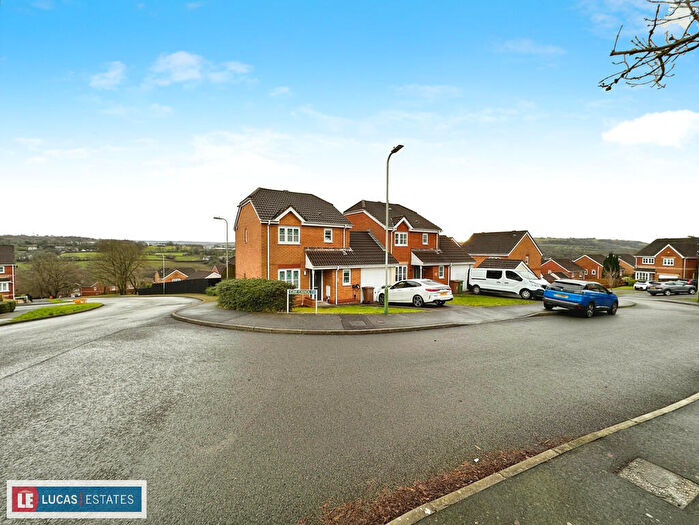
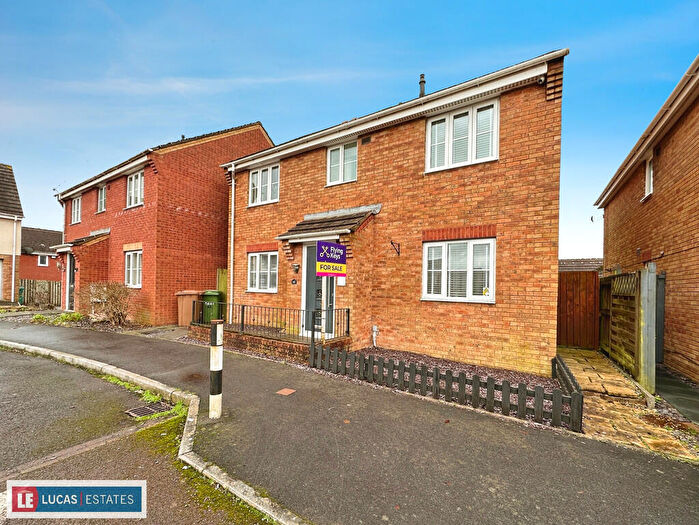
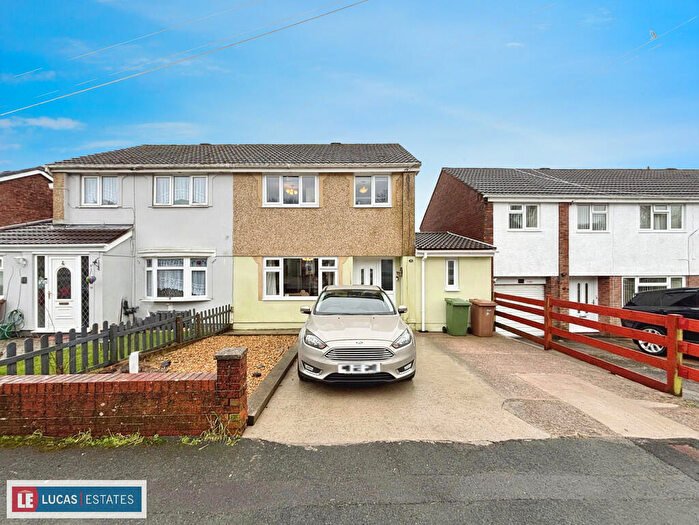
Houses for sale & to rent in Maesycwmmer, Hengoed
House Prices in Maesycwmmer
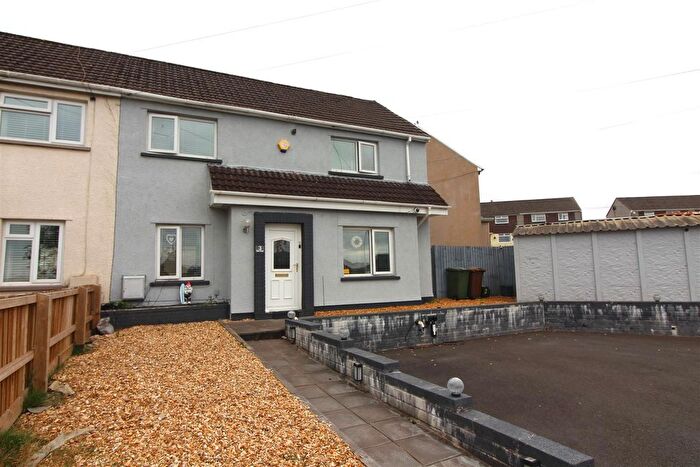
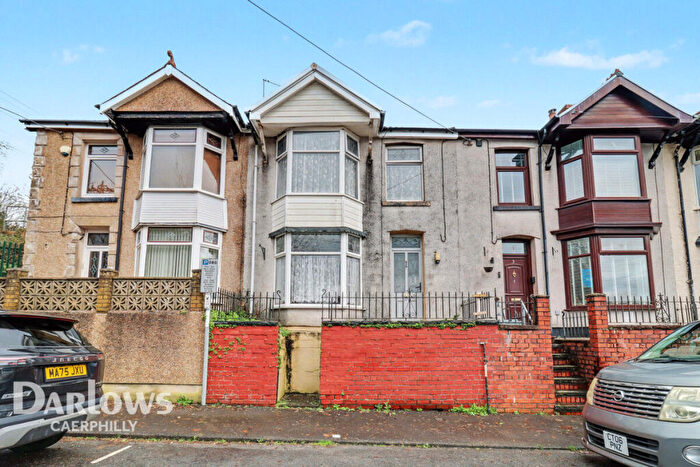
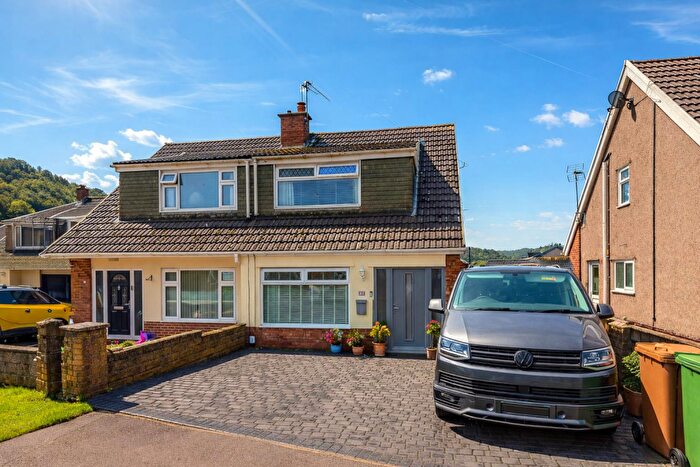
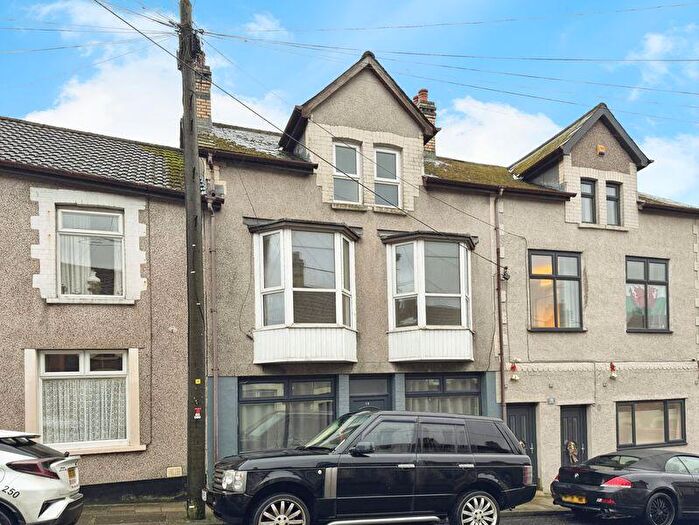
Properties in Maesycwmmer have an average house price of £203,001.00 and had 90 Property Transactions within the last 3 years¹.
Maesycwmmer is an area in Hengoed, Caerffili - Caerphilly with 935 households², where the most expensive property was sold for £443,000.00.
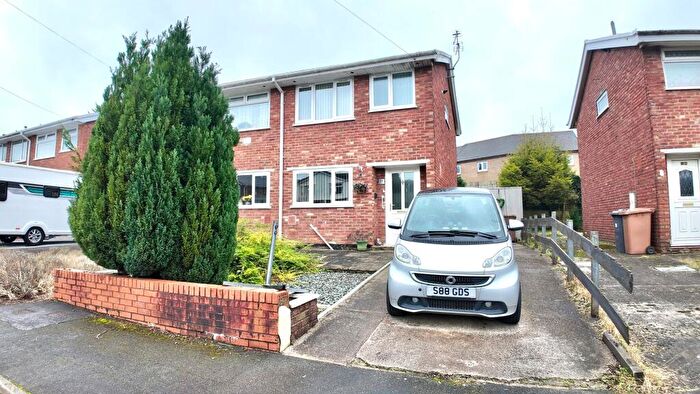
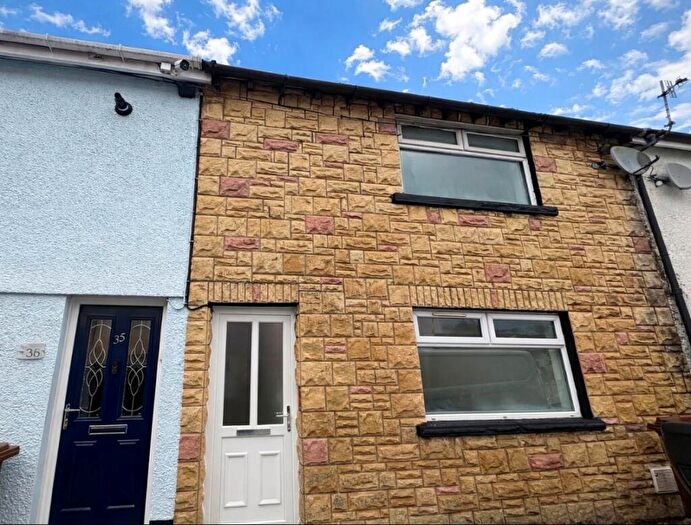
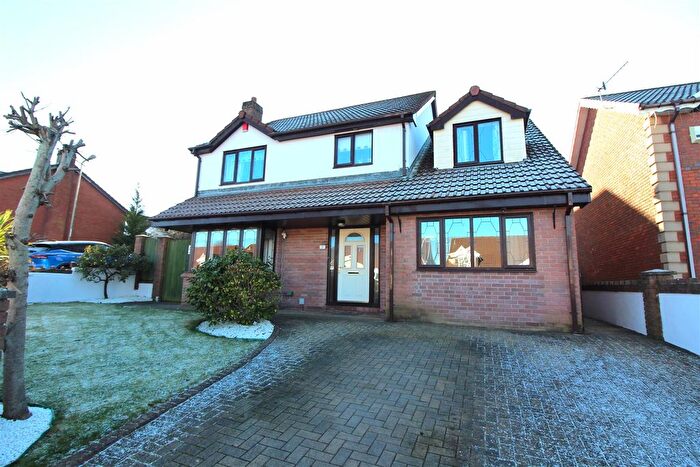
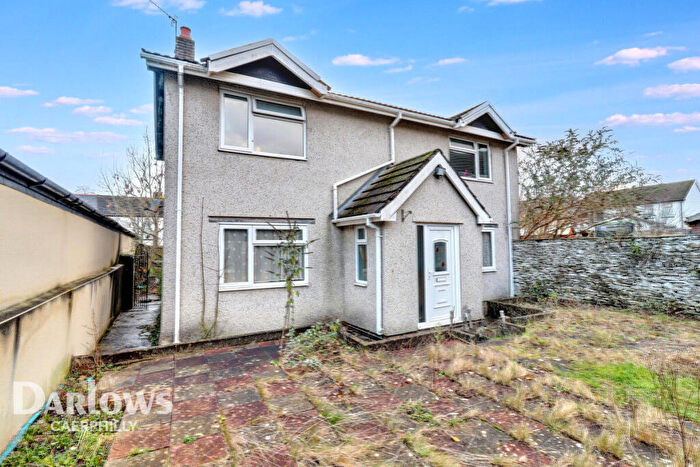
Properties for sale in Maesycwmmer
Roads and Postcodes in Maesycwmmer
Navigate through our locations to find the location of your next house in Maesycwmmer, Hengoed for sale or to rent.
| Streets | Postcodes |
|---|---|
| Alder Avenue | CF82 7TT CF82 7TW |
| Brookland Close | CF82 7RH |
| Butchers Cottages | CF82 7PL |
| Chave Terrace | CF82 7RZ |
| Distribution Way | CF82 7TS |
| Dyffryn Business Park | CF82 7YY |
| Erasmus Terrace | CF82 7QG |
| Ffordd Trefynwy | NP12 2QY |
| Gellideg Close | CF82 7RR |
| Gellideg Heights | CF82 7RL |
| Gellideg Isaf Rise | CF82 7RB |
| Gellideg Lane | CF82 7SD CF82 7SH CF82 7TX |
| Gellideg Street | CF82 7QJ |
| Gellideg Uchaf Way | CF82 7SZ |
| Glen Coed | CF82 7QD |
| Glen View | CF82 7PX |
| Gwerna Crescent | CF82 7QB |
| Hawtin Park | NP12 2EU |
| Hazel Close | CF82 7UB |
| Hill View | CF82 7QE |
| Jenkin Street | CF82 7QH |
| Land Associated With | CF82 7QT |
| Lon Rhymni | NP12 2QZ |
| Lon Tredegar | NP12 2RD |
| Main Road | CF82 7PJ CF82 7PP CF82 7RN CF82 7RP |
| Maple Drive | CF82 7UA |
| Mount Pleasant | CF82 7RX |
| North Avenue | CF82 7RY |
| Old Church Lane | CF82 7SE |
| Pandy Lane | CF82 7SY CF82 7TZ |
| Park Road | CF82 7PZ CF82 7QA |
| Pleasant View | CF82 7PY |
| Provident Cottages | CF82 7SA |
| Rhodfa Sirhywi | NP12 2RE |
| Shirdale Close | CF82 7QL |
| Springfield Road | CF82 7QP |
| Springfield View | CF82 7QW |
| St Annes Gardens | CF82 7QQ CF82 7QR CF82 7QS |
| St Davids Road | CF82 7QU |
| Summerfield Hall Lane | CF82 7RG |
| Sycamore Close | CF82 7RJ |
| Tabor Road | CF82 7PU CF82 7SB |
| The Boot | CF82 7PR |
| The Bridge | CF82 7ED |
| The Crescent | CF82 7QF |
| Thomas Street | CF82 7PH CF82 7PN |
| Twyn Shon Ifan | CF82 7SP CF82 7SQ |
| Underwood Avenue | CF82 7PT |
| Vale View | CF82 7PW |
| Viaduct Lane | CF82 7PE |
| Victoria Road | CF82 7RE CF82 7RF CF82 7GX |
| West Avenue | CF82 7QN |
| Willow Way | CF82 7TR |
| Y Glyn | CF82 7PF |
| CF82 7SN CF81 9YD CF81 9YE CF82 7ZR CF82 9AZ CF82 9BP CF82 9BQ CF82 9BW CF82 9ZZ NP12 2QA |
Transport near Maesycwmmer
- FAQ
- Price Paid By Year
- Property Type Price
Frequently asked questions about Maesycwmmer
What is the average price for a property for sale in Maesycwmmer?
The average price for a property for sale in Maesycwmmer is £203,001. This amount is 1% higher than the average price in Hengoed. There are 1,500 property listings for sale in Maesycwmmer.
What streets have the most expensive properties for sale in Maesycwmmer?
The streets with the most expensive properties for sale in Maesycwmmer are Gellideg Close at an average of £443,000, Underwood Avenue at an average of £335,000 and Gellideg Isaf Rise at an average of £311,250.
What streets have the most affordable properties for sale in Maesycwmmer?
The streets with the most affordable properties for sale in Maesycwmmer are West Avenue at an average of £114,000, Chave Terrace at an average of £125,000 and Vale View at an average of £130,000.
Which train stations are available in or near Maesycwmmer?
Some of the train stations available in or near Maesycwmmer are Hengoed, Ystrad Mynach and Pengam.
Property Price Paid in Maesycwmmer by Year
The average sold property price by year was:
| Year | Average Sold Price | Price Change |
Sold Properties
|
|---|---|---|---|
| 2025 | £231,666 | 18% |
24 Properties |
| 2024 | £188,947 | -5% |
38 Properties |
| 2023 | £197,506 | 1% |
28 Properties |
| 2022 | £194,709 | -8% |
34 Properties |
| 2021 | £209,738 | 2% |
51 Properties |
| 2020 | £204,593 | 8% |
36 Properties |
| 2019 | £187,718 | 22% |
96 Properties |
| 2018 | £147,281 | 4% |
62 Properties |
| 2017 | £142,022 | -18% |
39 Properties |
| 2016 | £167,526 | 21% |
36 Properties |
| 2015 | £132,311 | -3% |
22 Properties |
| 2014 | £136,690 | 2% |
22 Properties |
| 2013 | £133,678 | 11% |
14 Properties |
| 2012 | £118,450 | -5% |
22 Properties |
| 2011 | £124,699 | -23% |
20 Properties |
| 2010 | £152,803 | 30% |
14 Properties |
| 2009 | £106,446 | -40% |
14 Properties |
| 2008 | £149,496 | 11% |
14 Properties |
| 2007 | £133,353 | -18% |
31 Properties |
| 2006 | £156,825 | 21% |
29 Properties |
| 2005 | £124,613 | 22% |
29 Properties |
| 2004 | £97,203 | 6% |
27 Properties |
| 2003 | £91,193 | 36% |
44 Properties |
| 2002 | £58,360 | -17% |
54 Properties |
| 2001 | £68,197 | 25% |
69 Properties |
| 2000 | £51,060 | 5% |
60 Properties |
| 1999 | £48,425 | -6% |
46 Properties |
| 1998 | £51,345 | -3% |
32 Properties |
| 1997 | £52,796 | 31% |
29 Properties |
| 1996 | £36,280 | -14% |
26 Properties |
| 1995 | £41,349 | - |
17 Properties |
Property Price per Property Type in Maesycwmmer
Here you can find historic sold price data in order to help with your property search.
The average Property Paid Price for specific property types in the last three years are:
| Property Type | Average Sold Price | Sold Properties |
|---|---|---|
| Semi Detached House | £198,689.00 | 45 Semi Detached Houses |
| Detached House | £296,750.00 | 20 Detached Houses |
| Terraced House | £135,766.00 | 25 Terraced Houses |

