
Houses for sale in Hengoed, Caerffili - Caerphilly
House Prices in Hengoed
Properties in Hengoed have an average house price of £201k and had 757 Property Transactions within the last 3 years.¹
Hengoed is an area in Caerffili - Caerphilly with 8,625 households², where the most expensive property was sold for £660k.
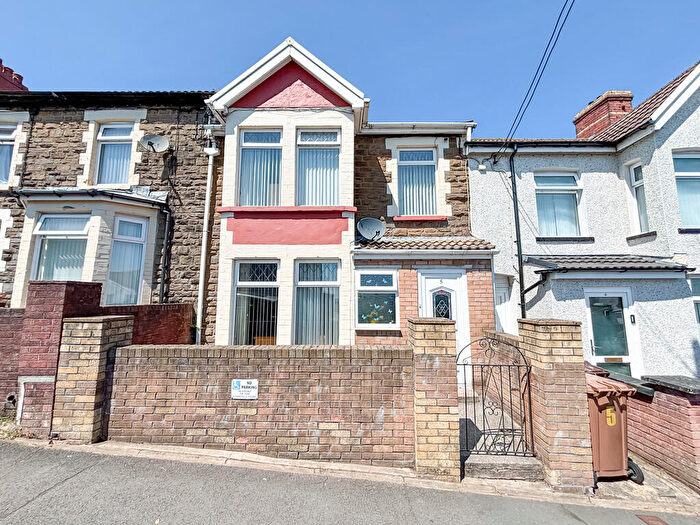
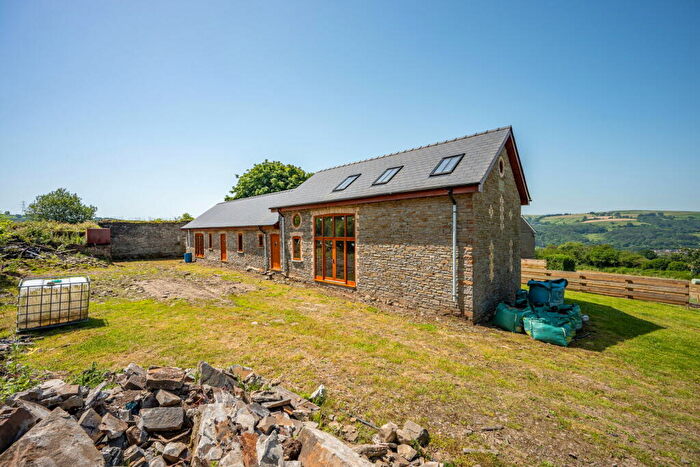
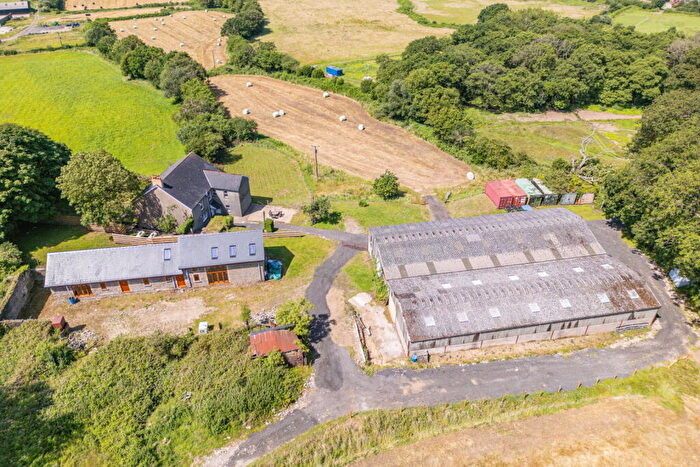
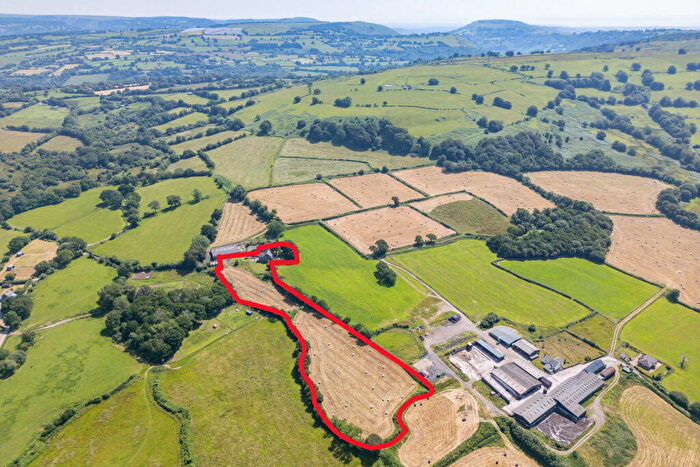
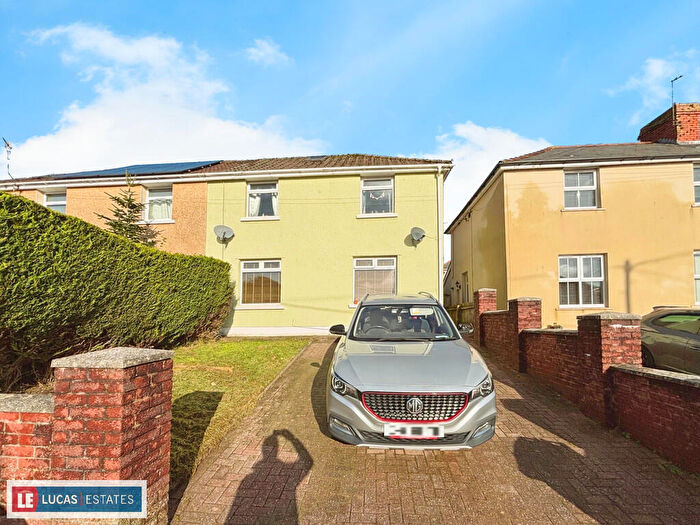
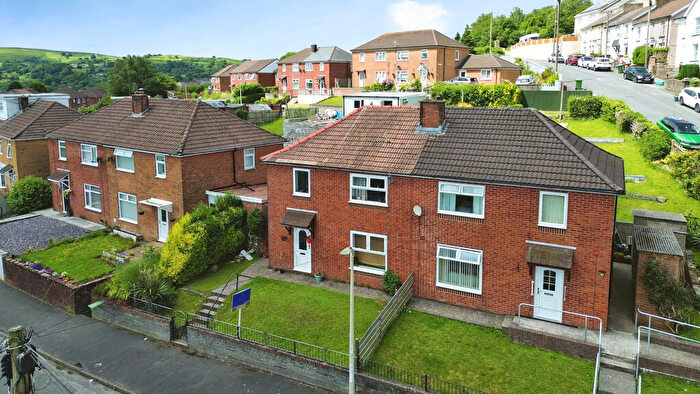
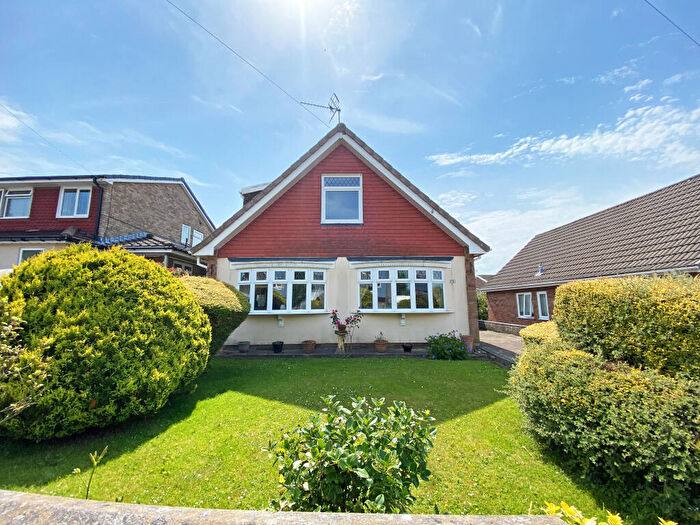
Properties for sale in Hengoed
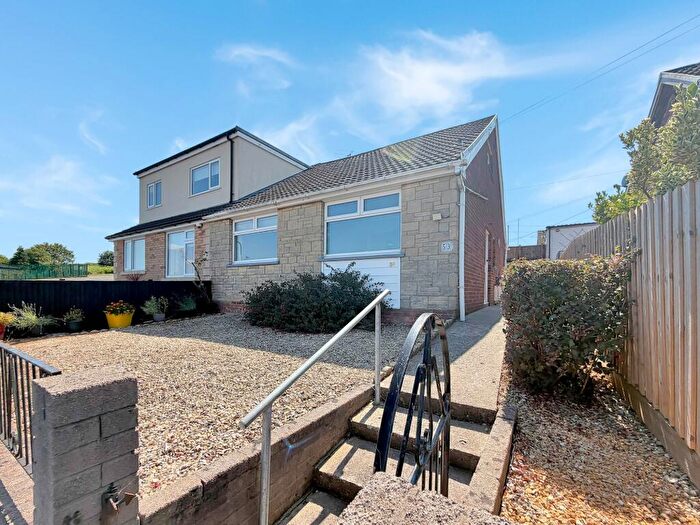
![]()
If you are looking to sell your house, let it out, or receive a property valuation, an expert can help you.
Click the button below to get started.
Neighbourhoods in Hengoed
Navigate through our locations to find the location of your next house in Hengoed, Caerffili - Caerphilly for sale or to rent.
Property price trends in Hengoed
According to the latest Land Registry data, the average home in Hengoed sold for £225,545 in 2026. That figure comes from a substantial record of 9,609 sales logged over the past 31 years.
Prices have continued to climb over the last three years. Compared with 2023, when the typical sale came in around £196,686, that's a rise of roughly 14.7%.
Looking back five years, average prices are up about 26.3% since 2021, a gain of around £46,990 in cash terms.
Zoom out to the past decade for the fuller picture. Back in 2016, homes here averaged £141,554, so the typical sold price has climbed about 59.3% since then, roughly 4.8% a year. Stretch the view to fifteen years and that annual pace eases back to about 3.9%.
Frequently asked questions about Hengoed
What is the average price for a property for sale in Hengoed?
The average price for a property for sale in Hengoed is £201,352. This amount is 3% higher than the average price in Caerffili - Caerphilly. There are 2,934 property listings for sale in Hengoed.
What locations have the most expensive properties for sale in Hengoed?
The locations with the most expensive properties for sale in Hengoed are Ystrad Mynach at an average of £210,054 and Maesycwmmer at an average of £204,981.
What locations have the most affordable properties for sale in Hengoed?
The locations with the most affordable properties for sale in Hengoed are St. Cattwg at an average of £194,019 and Hengoed at an average of £196,572.
Which train stations are available in or near Hengoed?
Some of the train stations available in or near Hengoed are Hengoed, Ystrad Mynach and Pengam.
Property Price Paid in Hengoed by Year
The average sold property price by year was:
| Year | Average Sold Price | Price Change |
Sold Properties
|
|---|---|---|---|
| 2026 | £225,545 | 5% |
21 Properties |
| 2025 | £213,337 | 10% |
235 Properties |
| 2024 | £192,558 | -2% |
239 Properties |
| 2023 | £196,686 | 2% |
262 Properties |
| 2022 | £192,739 | 7% |
298 Properties |
| 2021 | £178,555 | 10% |
385 Properties |
| 2020 | £161,247 | 1% |
211 Properties |
| 2019 | £159,830 | 8% |
363 Properties |
| 2018 | £146,584 | -2% |
329 Properties |
| 2017 | £149,246 | 5% |
361 Properties |
Property Price per Property Type in Hengoed
Here you can find historic sold price data in order to help with your property search.
The average Property Paid Price for specific property types in the last three years are:
| Property Type | Average Sold Price | Sold Properties |
|---|---|---|
| Semi Detached House | £192,732.00 | 322 Semi Detached Houses |
| Detached House | £300,872.00 | 173 Detached Houses |
| Terraced House | £149,782.00 | 235 Terraced Houses |
| Flat | £115,348.00 | 27 Flats |
Transport in Hengoed
Please see below transportation links in this area:
