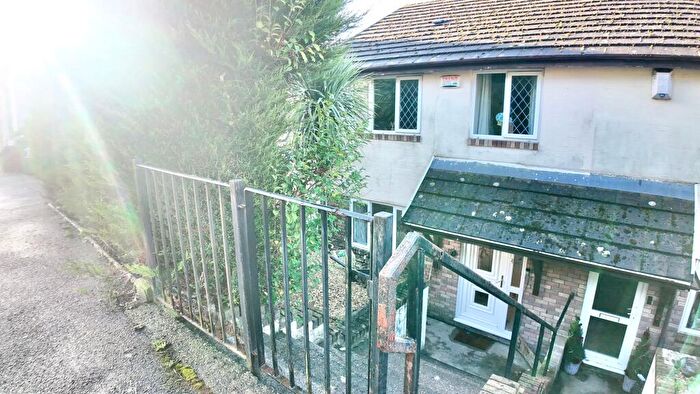
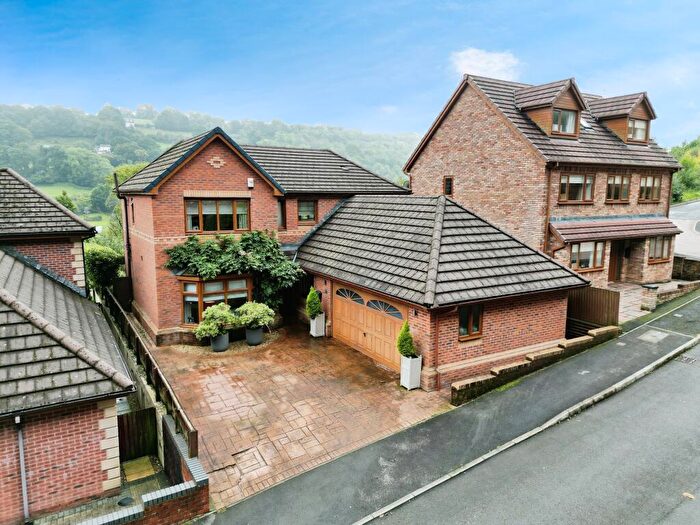
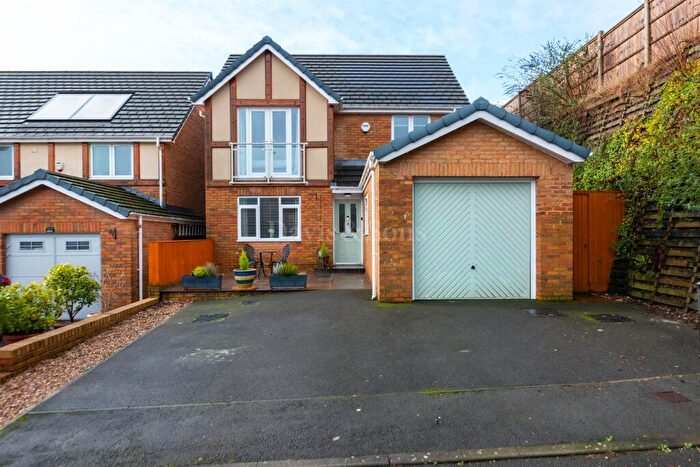
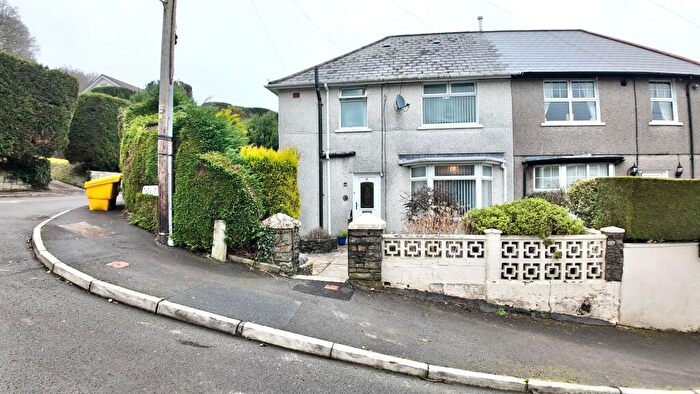
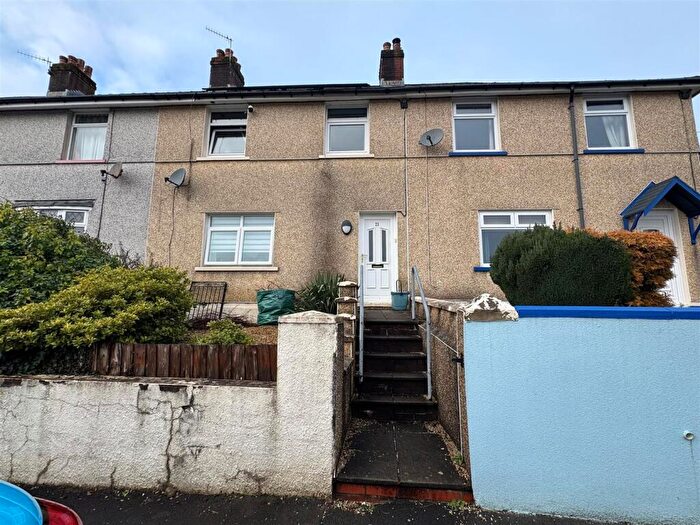
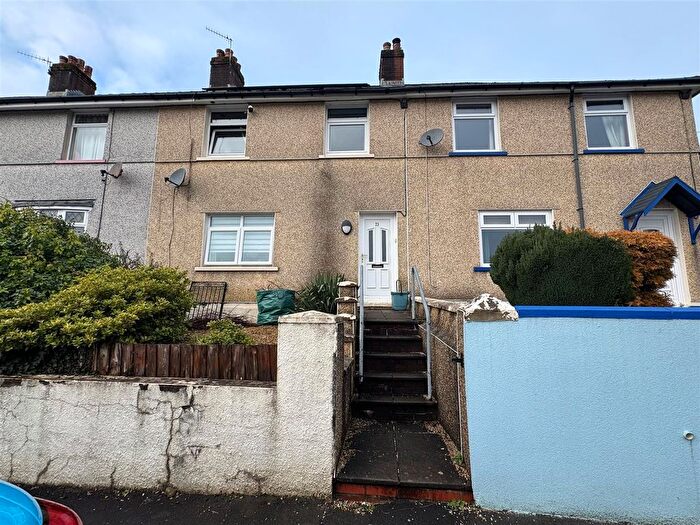
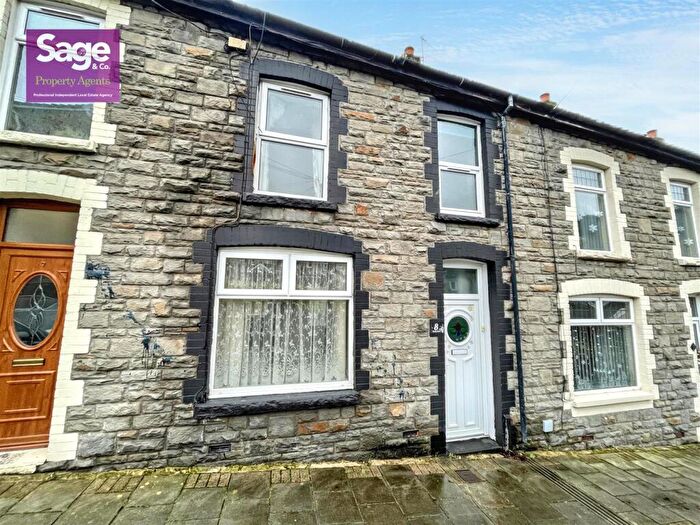
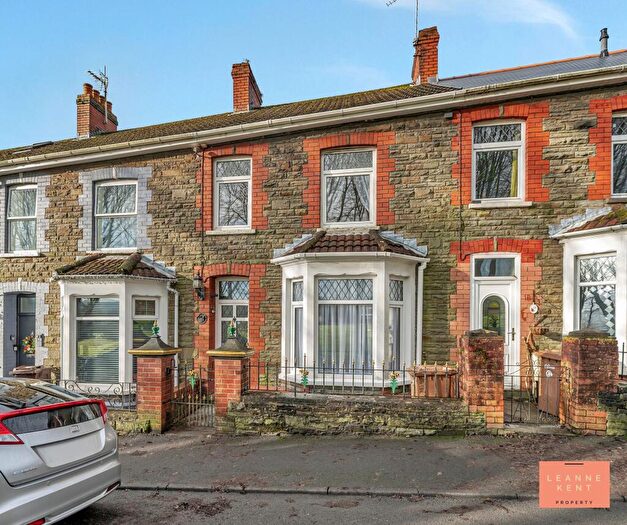
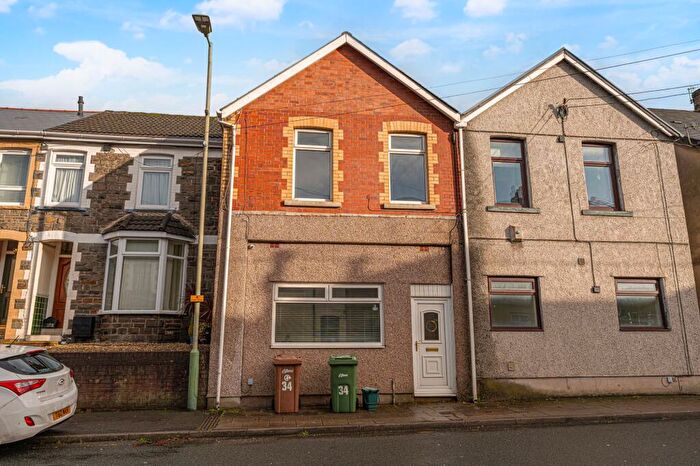
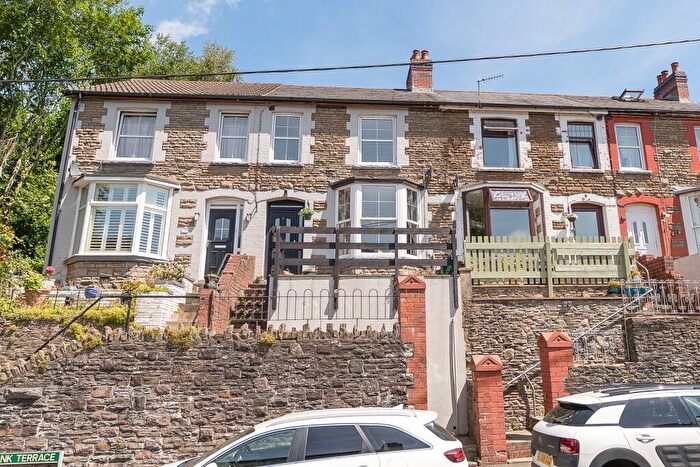
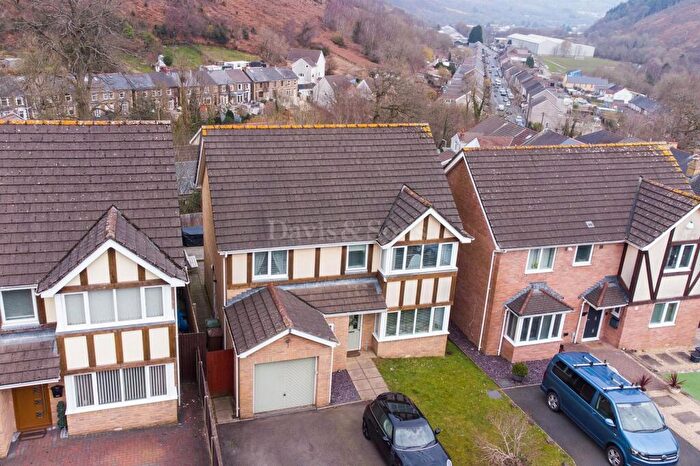
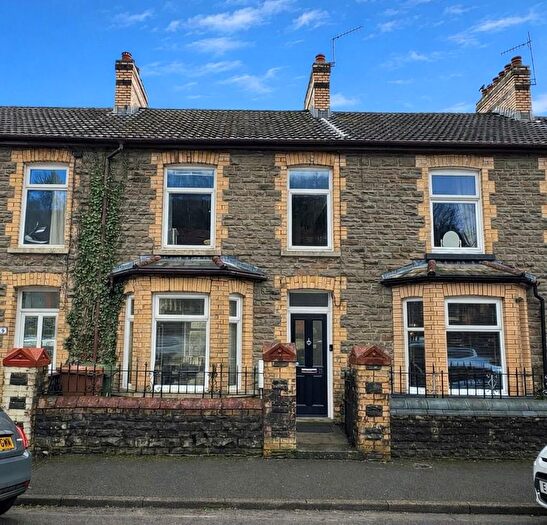
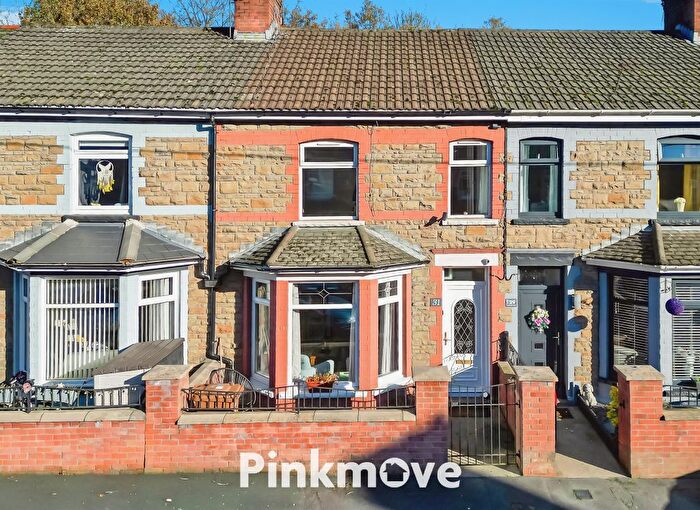
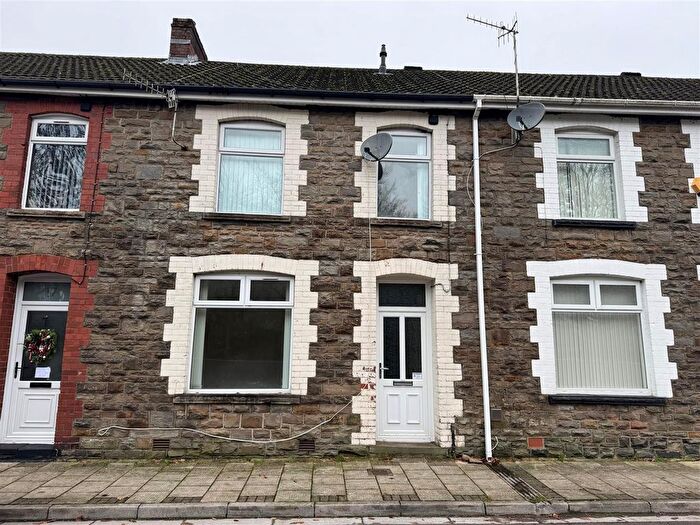
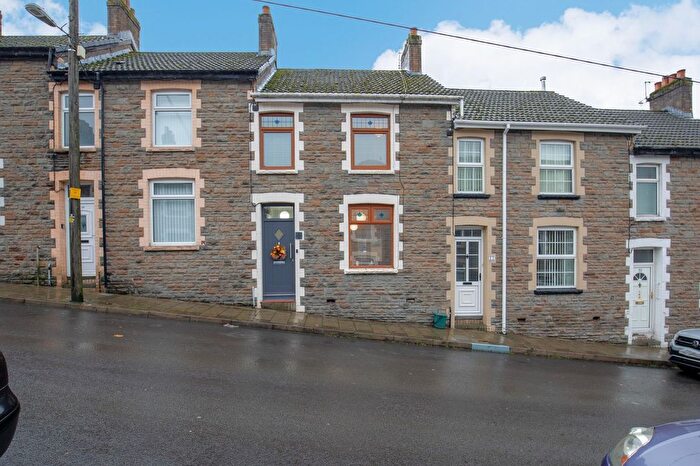
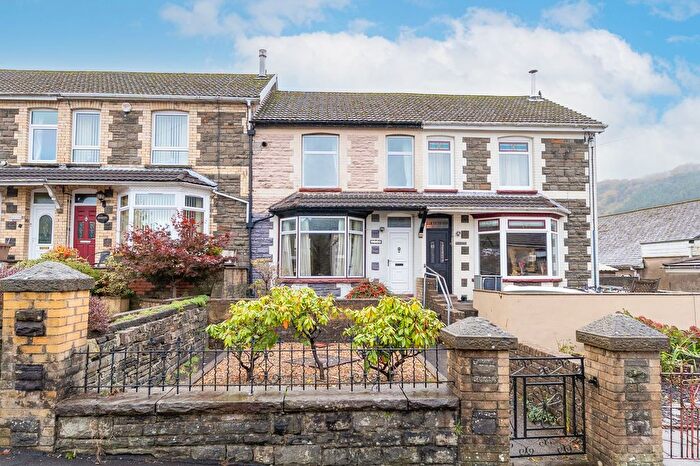
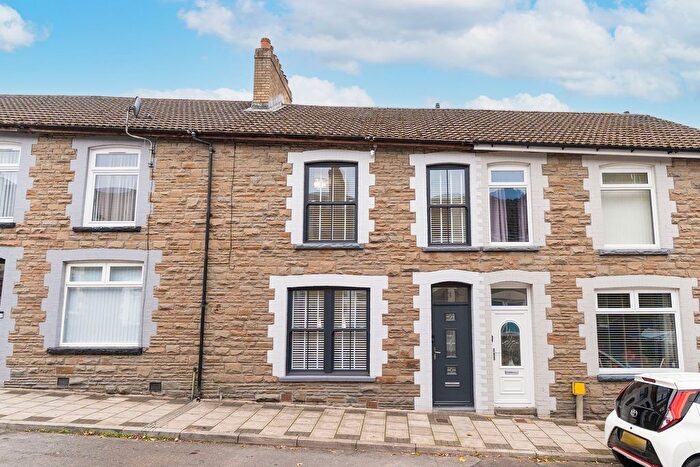
Houses for sale & to rent in Ynysddu, Newport
House Prices in Ynysddu
Properties in Ynysddu have an average house price of £157,740.00 and had 130 Property Transactions within the last 3 years¹.
Ynysddu is an area in Newport, Caerffili - Caerphilly with 1,457 households², where the most expensive property was sold for £425,000.00.
Properties for sale in Ynysddu
Previously listed properties in Ynysddu
Roads and Postcodes in Ynysddu
Navigate through our locations to find the location of your next house in Ynysddu, Newport for sale or to rent.
| Streets | Postcodes |
|---|---|
| Alexandra Road | NP11 7JY NP11 7JZ NP11 7LA NP11 7JF |
| Arthur Street | NP11 7GX |
| Beechwood Avenue | NP11 7QF |
| Bridge Street | NP11 7JU |
| Bridge View | NP11 7HG |
| Brynderwen | NP11 7JP |
| Caerllwyn Terrace | NP11 7LE |
| Chapel View | NP11 7GT |
| Commercial Buildings | NP11 7HT |
| Commercial Road | NP11 7HN NP11 7HW |
| Commercial Street | NP11 7JN |
| Cross Keys | NP11 7PT |
| Cwmfelinfach | NP11 7HP NP11 7HX NP11 7JD NP11 7JE NP11 7JX |
| Cwrt Y Babell | NP11 7NR |
| Duffryn Road | NP11 7QU |
| Duffryn Terrace | NP11 7QN |
| Dyffryn Farm Lane | NP11 7RB |
| Falcon Terrace | NP11 7QY |
| Firbank Terrace | NP11 7HU |
| George Street | NP11 7QG |
| Glannant Street | NP11 7HB |
| Glenview Terrace | NP11 7LG |
| Glyn Terrace | NP11 7JL |
| Graig View | NP11 7JG |
| Greenfield Terrace | NP11 7LH |
| Hafod Tudor Terrace | NP11 7QQ |
| High Street | NP11 7JH NP11 7JJ |
| Hillview | NP11 7GW |
| Islwyn Close | NP11 7LL |
| Islwyn Road | NP11 7QD NP11 7QH NP11 7QJ NP11 7QL NP11 7BP |
| Islwyn Road South Lane | NP11 7RF |
| Islwyn Street | NP11 7HA NP11 7HY |
| John Street | NP11 7JT |
| King Street | NP11 7HL |
| Llanarth Street | NP11 7QW |
| Llanarth Villas | NP11 7QX |
| Llwyn Derwen | NP11 7BN |
| Llys Deri | NP11 7JA |
| Maindee Road | NP11 7HQ NP11 7HR |
| Maindee Road Lane | NP11 7BJ |
| Melin Street | NP11 7GZ |
| Mill Street | NP11 7HH |
| Morrisville | NP11 7QZ |
| Mount Pleasant | NP11 7JQ |
| Myrtle Cottages | NP11 7LB |
| New Road | NP11 7GU |
| Nine Mile Point Court | NP11 7GN |
| Nine Mile Point Industrial Estate | NP11 7HZ |
| Nine Mile Point Road | NP11 7QP NP11 7QT |
| North Blackvein Industrial Estate | NP11 7PX |
| Penllwyn Street | NP11 7HE |
| Pioneer Terrace | NP11 7HS |
| Pontgam Terrace | NP11 7LD |
| Prince Street | NP11 7QR |
| Railway Cottages | NP11 7PU |
| South Blackvein Industrial Estate | NP11 7RE |
| Stanley Street | NP11 7HF |
| Station Avenue | NP11 7JS |
| Syndicate Terrace | NP11 7HD |
| The Gardens | NP11 7LN |
| Troed Y Rhiw Road | NP11 7QS |
| Twyn Gwyn Farm Lane | NP11 7BA |
| Twyn Gwyn Road | NP11 7AU NP11 7AY |
| Twyngwyn Road | NP11 7AW NP11 7AX |
| Wattsville | NP11 7BD NP11 7RA |
| Western Terrace | NP11 7HJ |
| William Street | NP11 7GY |
| Woodland View | NP11 7QE |
| Woodside Walk | NP11 7NZ |
| Ynys Hywel Lane | NP11 7NY |
| NP11 7BB NP11 7JR NP11 7JW NP11 7LF NP11 7LJ |
Transport near Ynysddu
- FAQ
- Price Paid By Year
- Property Type Price
Frequently asked questions about Ynysddu
What is the average price for a property for sale in Ynysddu?
The average price for a property for sale in Ynysddu is £157,740. This amount is 9% lower than the average price in Newport. There are 278 property listings for sale in Ynysddu.
What streets have the most expensive properties for sale in Ynysddu?
The streets with the most expensive properties for sale in Ynysddu are Woodside Walk at an average of £269,500, Railway Cottages at an average of £243,000 and Pontgam Terrace at an average of £180,750.
What streets have the most affordable properties for sale in Ynysddu?
The streets with the most affordable properties for sale in Ynysddu are Station Avenue at an average of £90,000, Hafod Tudor Terrace at an average of £110,000 and Penllwyn Street at an average of £120,333.
Which train stations are available in or near Ynysddu?
Some of the train stations available in or near Ynysddu are Crosskeys, Llanbradach and Hengoed.
Property Price Paid in Ynysddu by Year
The average sold property price by year was:
| Year | Average Sold Price | Price Change |
Sold Properties
|
|---|---|---|---|
| 2025 | £171,588 | 10% |
33 Properties |
| 2024 | £154,238 | 1% |
46 Properties |
| 2023 | £151,938 | -2% |
51 Properties |
| 2022 | £155,326 | 17% |
72 Properties |
| 2021 | £129,454 | 1% |
65 Properties |
| 2020 | £128,019 | -0,5% |
33 Properties |
| 2019 | £128,636 | -26% |
61 Properties |
| 2018 | £161,764 | 30% |
48 Properties |
| 2017 | £112,513 | 11% |
49 Properties |
| 2016 | £100,459 | 7% |
49 Properties |
| 2015 | £93,055 | -0,5% |
39 Properties |
| 2014 | £93,488 | 8% |
46 Properties |
| 2013 | £85,857 | -5% |
27 Properties |
| 2012 | £90,385 | -14% |
30 Properties |
| 2011 | £103,113 | -14% |
35 Properties |
| 2010 | £117,609 | 7% |
36 Properties |
| 2009 | £108,942 | -22% |
27 Properties |
| 2008 | £132,513 | 16% |
45 Properties |
| 2007 | £111,862 | -7% |
61 Properties |
| 2006 | £119,284 | 20% |
70 Properties |
| 2005 | £95,220 | 22% |
50 Properties |
| 2004 | £74,661 | 28% |
47 Properties |
| 2003 | £53,410 | 14% |
56 Properties |
| 2002 | £45,915 | 8% |
66 Properties |
| 2001 | £42,113 | 14% |
62 Properties |
| 2000 | £36,099 | -2% |
65 Properties |
| 1999 | £36,861 | 11% |
58 Properties |
| 1998 | £32,750 | -0,2% |
50 Properties |
| 1997 | £32,828 | -3% |
48 Properties |
| 1996 | £33,717 | 3% |
46 Properties |
| 1995 | £32,659 | - |
31 Properties |
Property Price per Property Type in Ynysddu
Here you can find historic sold price data in order to help with your property search.
The average Property Paid Price for specific property types in the last three years are:
| Property Type | Average Sold Price | Sold Properties |
|---|---|---|
| Semi Detached House | £176,100.00 | 10 Semi Detached Houses |
| Detached House | £314,285.00 | 7 Detached Houses |
| Terraced House | £146,574.00 | 110 Terraced Houses |
| Flat | £140,666.00 | 3 Flats |

