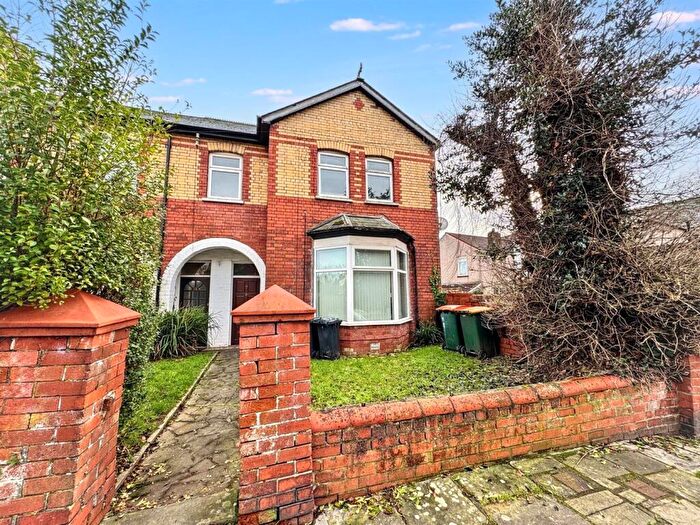
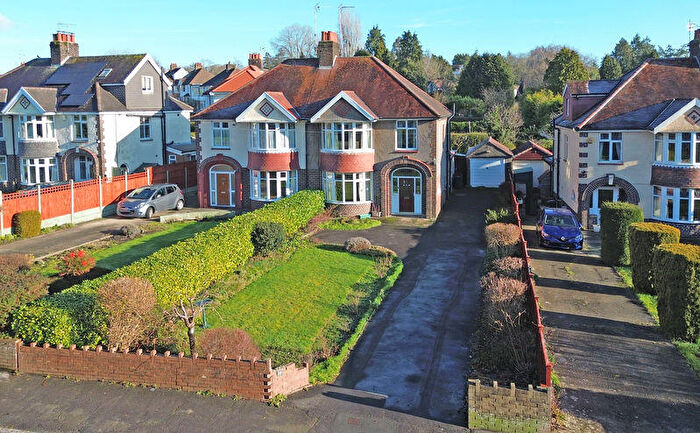
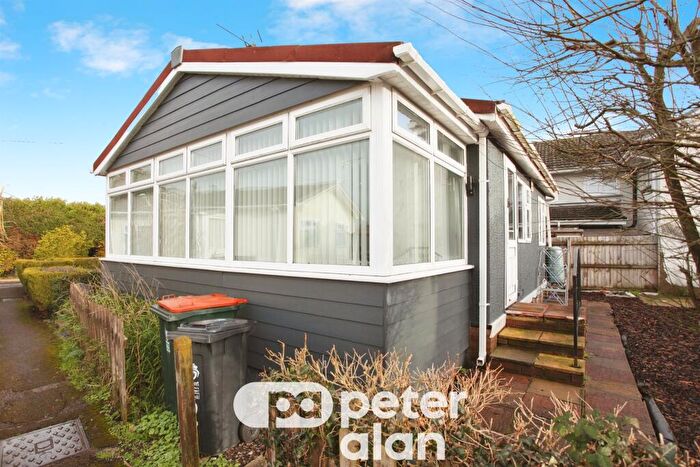
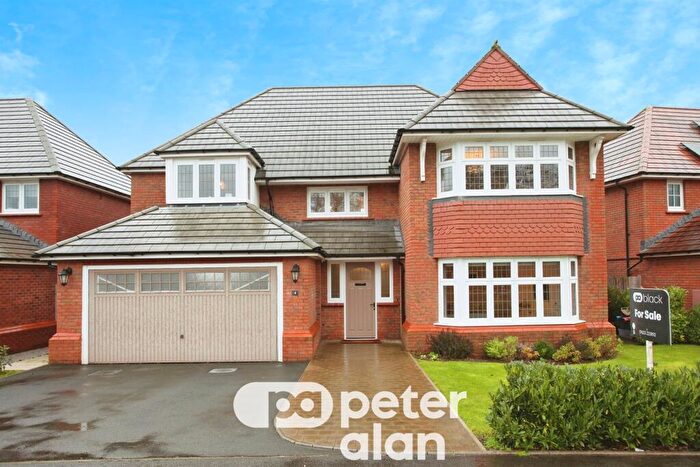
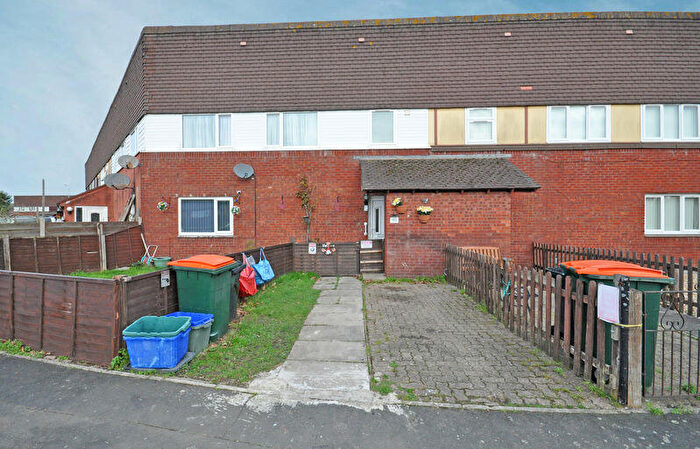
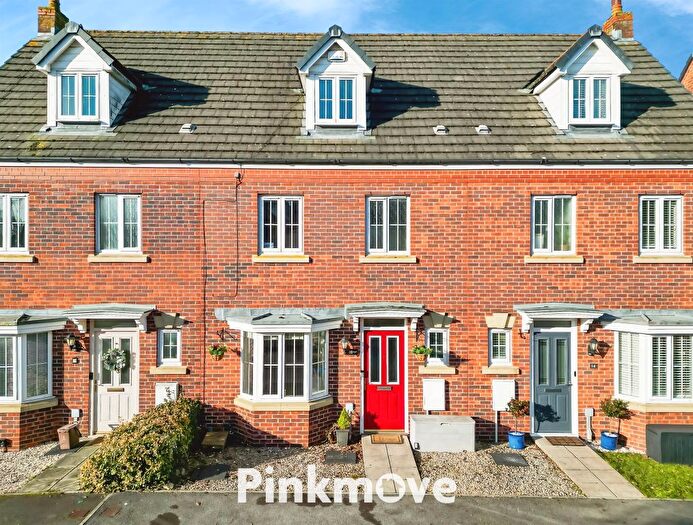
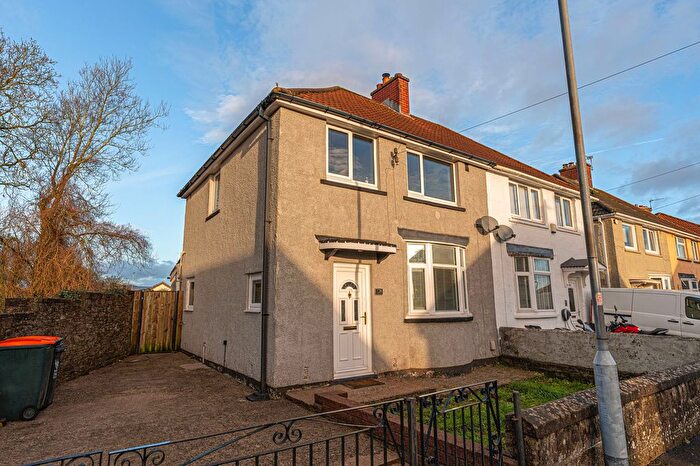
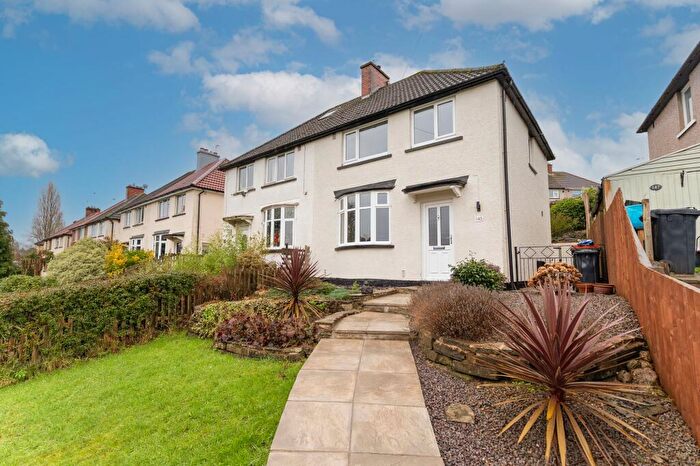
Houses for sale & to rent in Marshfield, Newport
House Prices in Marshfield
Properties in Marshfield have an average house price of £233,805.00 and had 152 Property Transactions within the last 3 years¹.
Marshfield is an area in Newport, Casnewydd - Newport with 1,197 households², where the most expensive property was sold for £740,000.00.
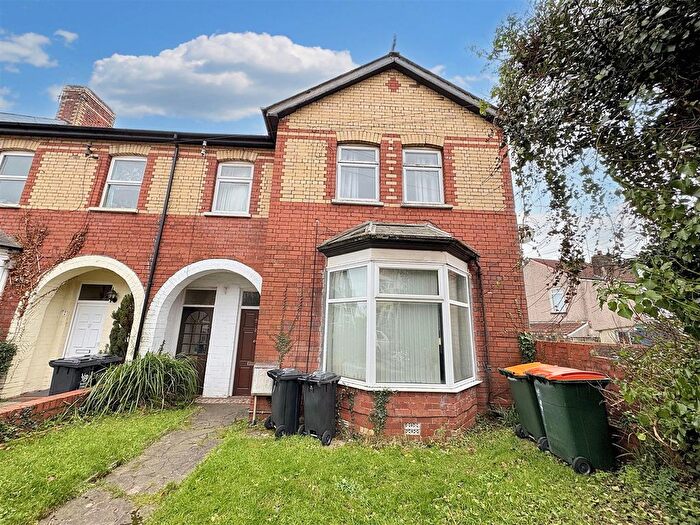
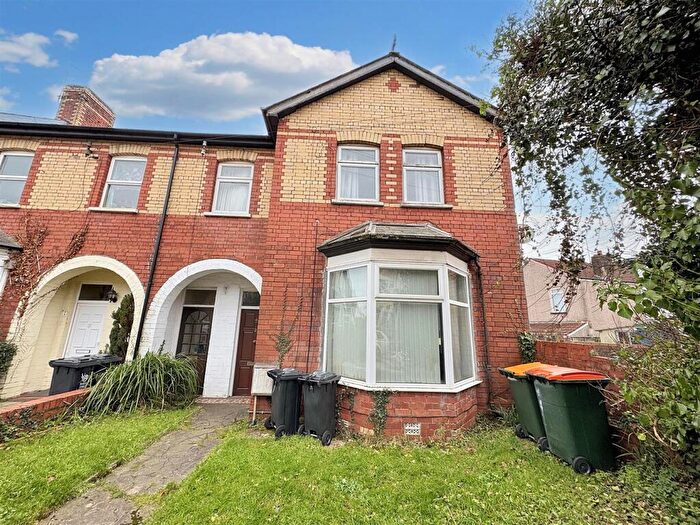
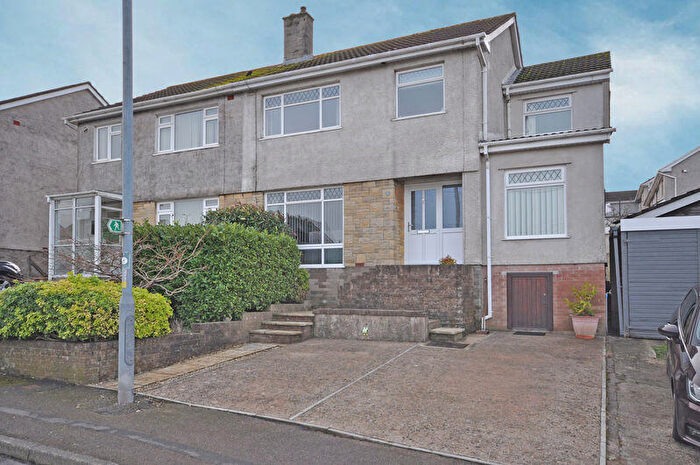
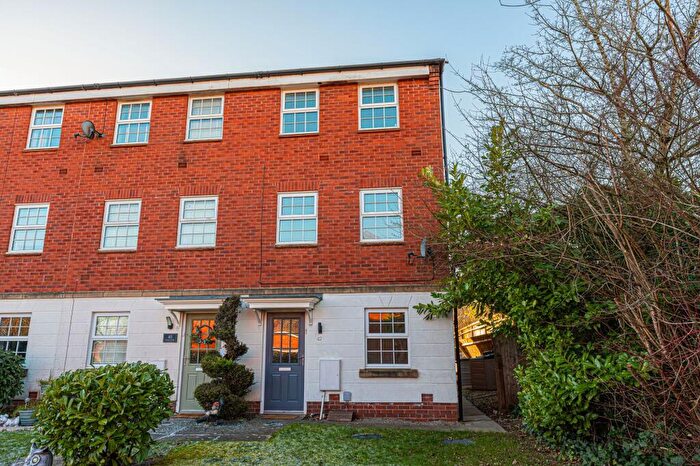
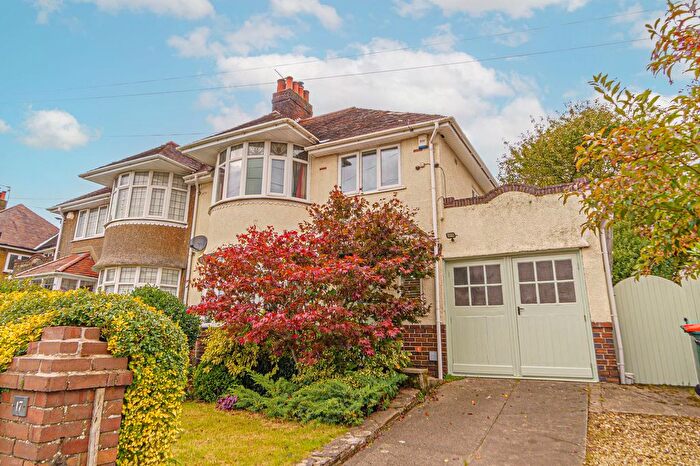
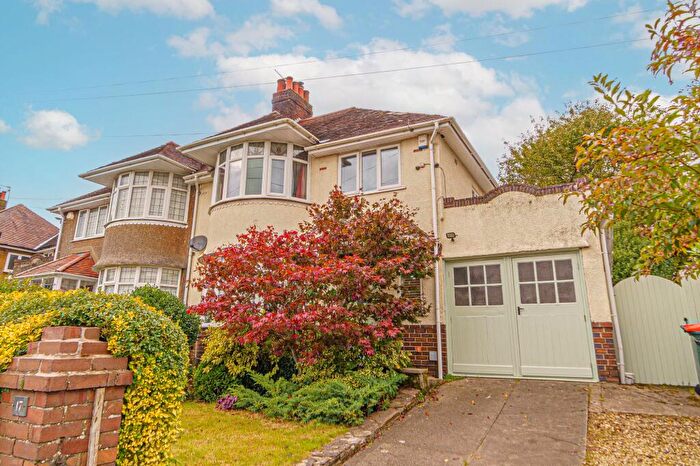
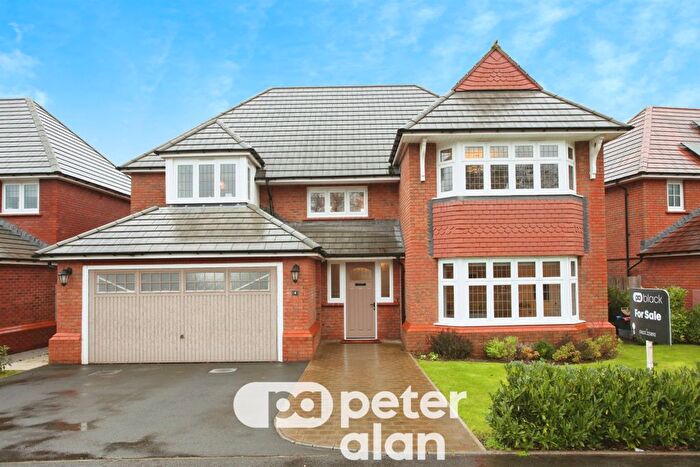
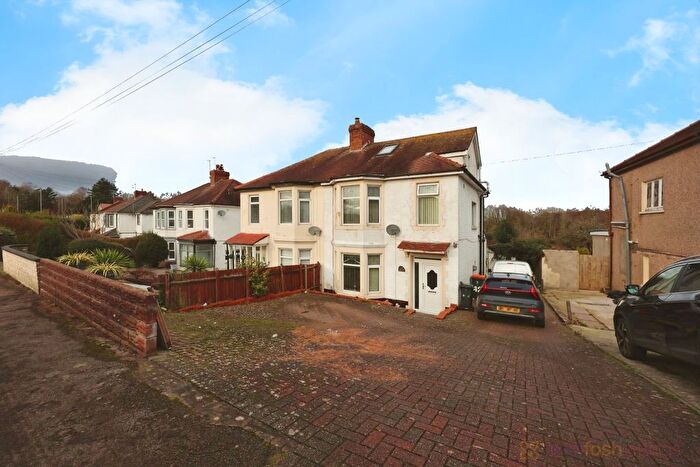
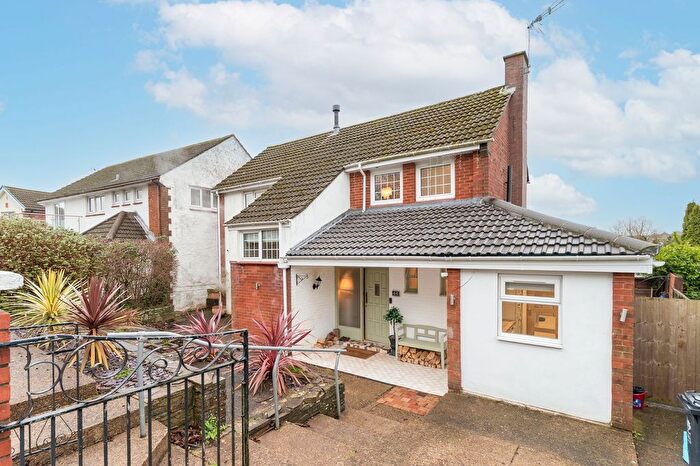
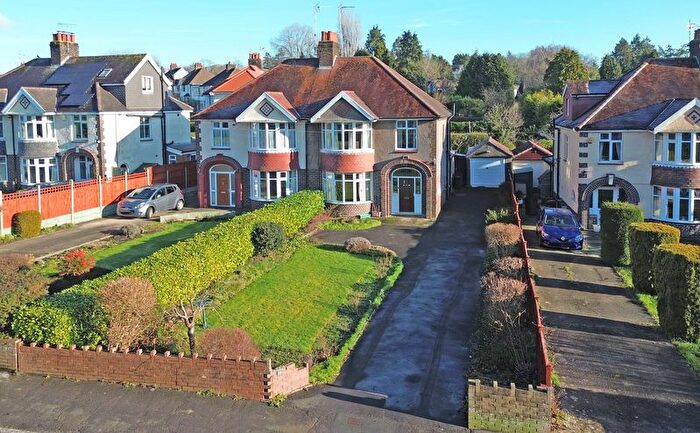
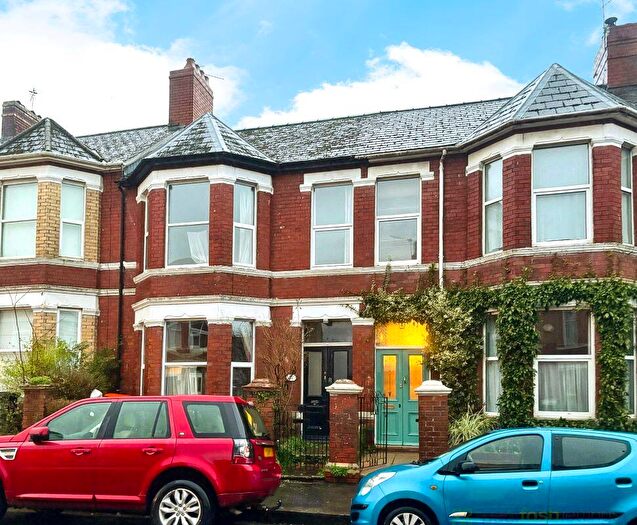
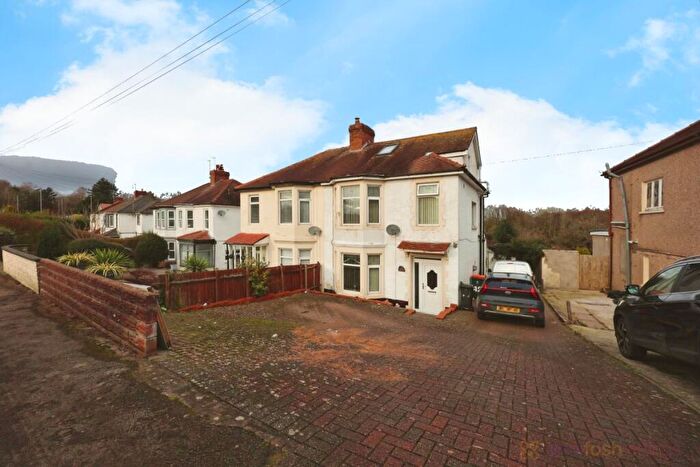
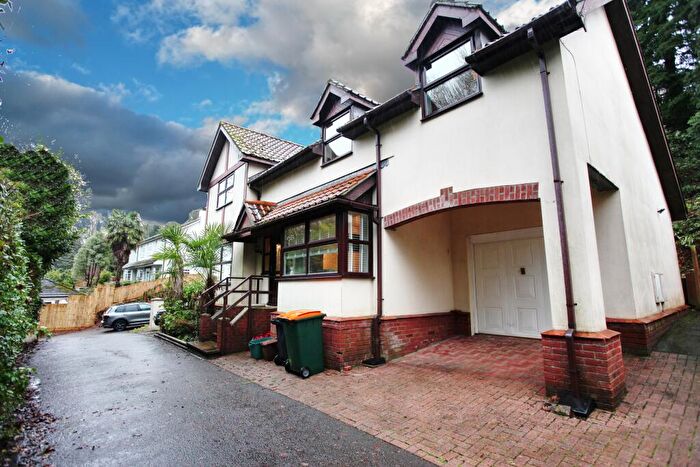
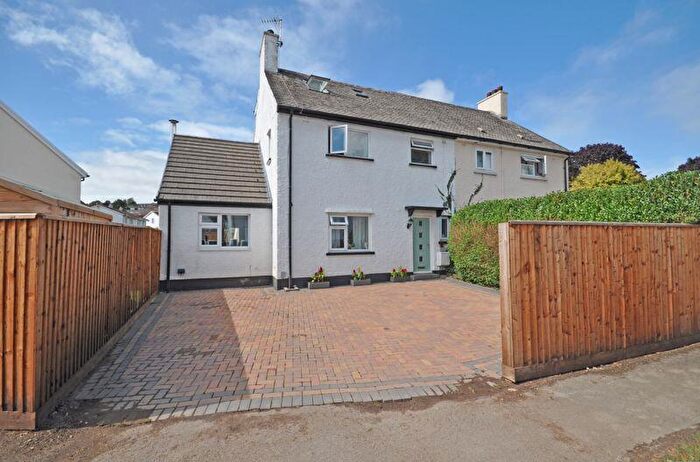
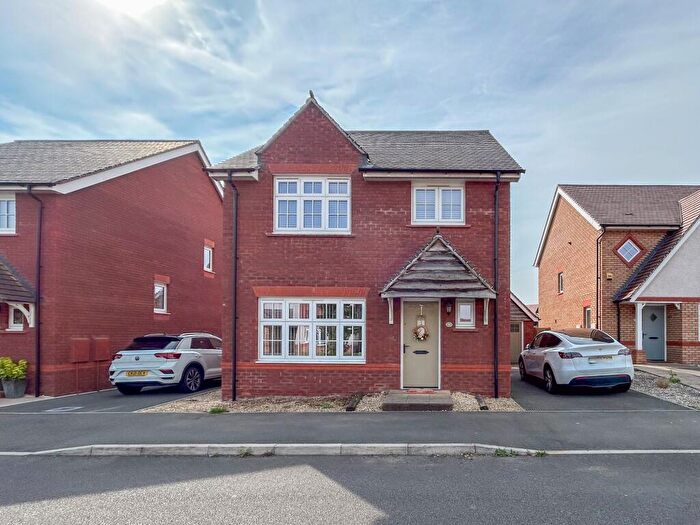
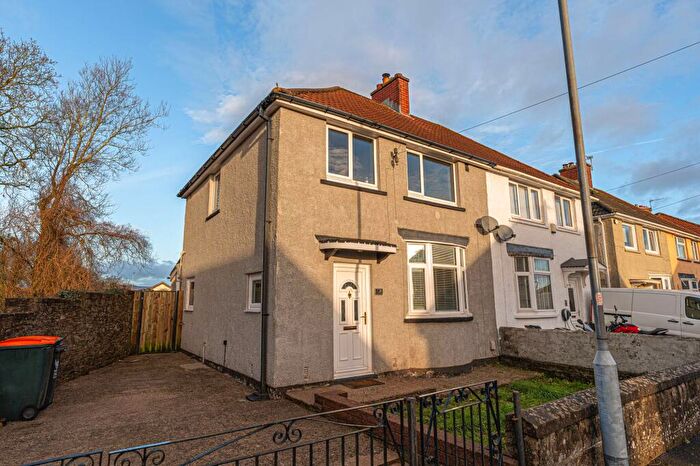
Properties for sale in Marshfield
Roads and Postcodes in Marshfield
Navigate through our locations to find the location of your next house in Marshfield, Newport for sale or to rent.
| Streets | Postcodes |
|---|---|
| Blacksmiths Way | NP10 8TR |
| Bridesvale Gardens | NP10 8SJ |
| Bronllys Grove | NP10 8EH |
| Bronllys Mews | NP10 8EJ |
| Buchanan Way | NP10 8FE |
| Builth Close | NP10 8HU |
| Cardiff Road | NP10 8TN NP10 8QQ NP10 8TL NP10 8XG |
| Castell Coch Drive | NP10 8HB |
| Celtic Way | NP10 8BE |
| Chirk Close | NP10 8HX |
| Church Crescent | NP10 8TT |
| Church House Park | NP10 8SP |
| Church Lane | NP10 8TU |
| Church Road | NP10 8SN |
| Cleppa Park | NP10 8BA |
| Common Farm Cottages | NP10 8SH |
| Conwy Grove | NP10 8HW |
| Criccieth Close | NP10 8HE |
| Dunraven Drive | NP10 8HS |
| Forge Road | NP10 8AT |
| Goodrich Grove | NP10 8SY |
| Grosmont Way | NP10 8UQ |
| Hazell Drive | NP10 8FY |
| Imperial Park | NP10 8AS NP10 8FS |
| Imperial Way | NP10 8UH |
| Jamaica Circle | NP10 8AB NP10 8AN NP10 8AP |
| Jamaica Close | NP10 8AE |
| Jamaica Gardens | NP10 8AF |
| Jamaica Grove | NP10 8AD NP10 8AH NP10 8AJ NP10 8AL |
| Jamaica Walk | NP10 8AG |
| Kidwelly Close | NP10 8ED |
| Lakeside Drive | NP10 8BB |
| Lighthouse Park | NP10 8SL NP10 8ST NP10 8SU |
| Llanidloes Mews | NP10 8EL |
| Longtown Grove | NP10 8HD |
| Morgraig Avenue | NP10 8UP |
| Morlais Mews | NP10 8EN |
| Nant Y Moor Close | NP10 8HH |
| Narberth Close | NP10 8EE |
| Narberth Mews | NP10 8EF |
| Nellive Park | NP10 8SE |
| Old Castle Close | NP10 8GT |
| Outfall Lane | NP10 8SS |
| Oxwich Grove | NP10 8HR |
| Oystermouth Mews | NP10 8EB |
| Oystermouth Way | NP10 8EA |
| Pencarn Avenue | NP10 8TJ NP10 8AR |
| Pencarn Way | NP10 8SB |
| Penhow Mews | NP10 8HA |
| Pennard Close | NP10 8EG |
| Penylan Cottages | NP10 8RU |
| Picton Walk | NP10 8GR |
| Pound Hill | NP10 8UE |
| Powis Close | NP10 8HT |
| Raglan Mews | NP10 8UB |
| Skenfrith Mews | NP10 8HF |
| Spooner Close | NP10 8FQ NP10 8FZ |
| St Briavels Mews | NP10 8SX |
| Tenby Close | NP10 8GQ |
| The Avenue | NP10 8UG |
| The Courtyard | NP10 8UL |
| Vaughan Court | NP10 8BD |
| White Avenue | NP10 8SZ |
| NP10 8SF NP10 8SQ NP10 8TQ NP10 8TY NP10 8TZ NP10 8UD NP10 8UF NP10 8SR NP10 8TE NP10 8TW NP10 8TX NP10 8YW |
Transport near Marshfield
- FAQ
- Price Paid By Year
- Property Type Price
Frequently asked questions about Marshfield
What is the average price for a property for sale in Marshfield?
The average price for a property for sale in Marshfield is £233,805. This amount is 3% higher than the average price in Newport. There are 3,304 property listings for sale in Marshfield.
What streets have the most expensive properties for sale in Marshfield?
The streets with the most expensive properties for sale in Marshfield are Church Lane at an average of £670,000, Nellive Park at an average of £381,500 and Bridesvale Gardens at an average of £320,000.
What streets have the most affordable properties for sale in Marshfield?
The streets with the most affordable properties for sale in Marshfield are Narberth Mews at an average of £130,000, Skenfrith Mews at an average of £144,100 and Jamaica Circle at an average of £144,250.
Which train stations are available in or near Marshfield?
Some of the train stations available in or near Marshfield are Pye Corner, Newport (Gwent) and Rogerstone.
Property Price Paid in Marshfield by Year
The average sold property price by year was:
| Year | Average Sold Price | Price Change |
Sold Properties
|
|---|---|---|---|
| 2025 | £234,611 | 8% |
18 Properties |
| 2024 | £216,700 | -9% |
35 Properties |
| 2023 | £237,251 | -2% |
54 Properties |
| 2022 | £242,651 | -2% |
45 Properties |
| 2021 | £246,761 | 15% |
62 Properties |
| 2020 | £210,703 | -5% |
32 Properties |
| 2019 | £220,698 | 15% |
68 Properties |
| 2018 | £187,151 | -11% |
68 Properties |
| 2017 | £207,346 | 11% |
69 Properties |
| 2016 | £184,788 | 4% |
72 Properties |
| 2015 | £178,215 | 9% |
68 Properties |
| 2014 | £161,351 | -0,3% |
50 Properties |
| 2013 | £161,863 | -17% |
40 Properties |
| 2012 | £190,037 | -2% |
27 Properties |
| 2011 | £193,670 | 17% |
38 Properties |
| 2010 | £161,285 | 18% |
44 Properties |
| 2009 | £132,990 | -22% |
66 Properties |
| 2008 | £161,914 | -11% |
71 Properties |
| 2007 | £179,696 | 8% |
101 Properties |
| 2006 | £166,124 | -4% |
147 Properties |
| 2005 | £172,247 | 6% |
73 Properties |
| 2004 | £161,555 | 2% |
144 Properties |
| 2003 | £158,140 | 17% |
145 Properties |
| 2002 | £131,799 | 22% |
146 Properties |
| 2001 | £102,761 | 8% |
78 Properties |
| 2000 | £94,948 | -1% |
85 Properties |
| 1999 | £95,443 | -1% |
59 Properties |
| 1998 | £96,128 | 38% |
23 Properties |
| 1997 | £60,000 | -2% |
1 Property |
| 1996 | £61,125 | -19% |
4 Properties |
| 1995 | £72,500 | - |
6 Properties |
Property Price per Property Type in Marshfield
Here you can find historic sold price data in order to help with your property search.
The average Property Paid Price for specific property types in the last three years are:
| Property Type | Average Sold Price | Sold Properties |
|---|---|---|
| Semi Detached House | £268,267.00 | 28 Semi Detached Houses |
| Detached House | £329,875.00 | 34 Detached Houses |
| Terraced House | £216,362.00 | 57 Terraced Houses |
| Flat | £135,712.00 | 33 Flats |

