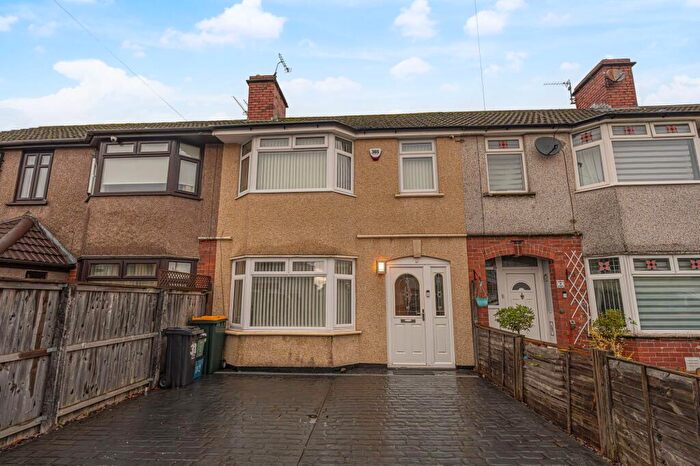
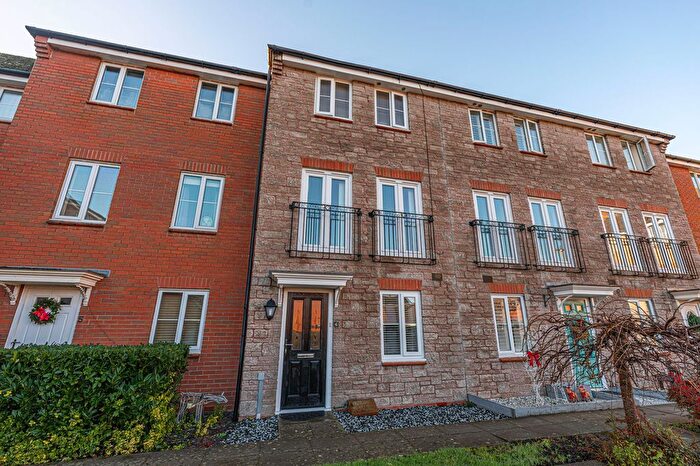
Houses for sale & to rent in Tredegar Park, Newport
House Prices in Tredegar Park
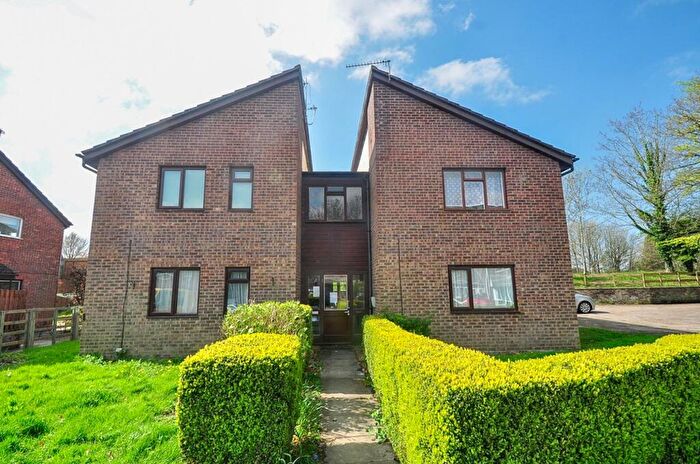
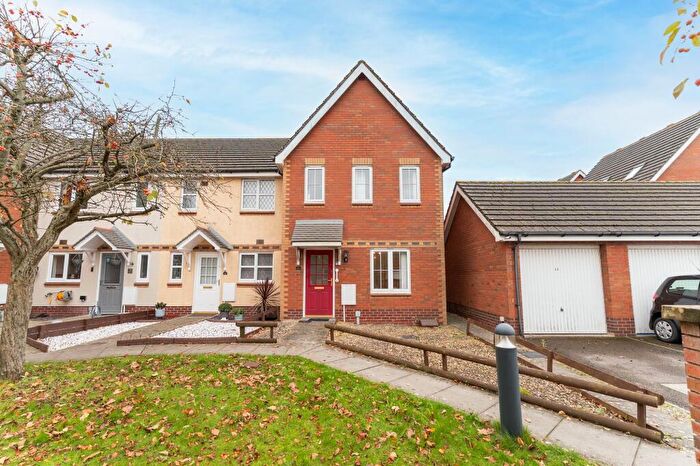
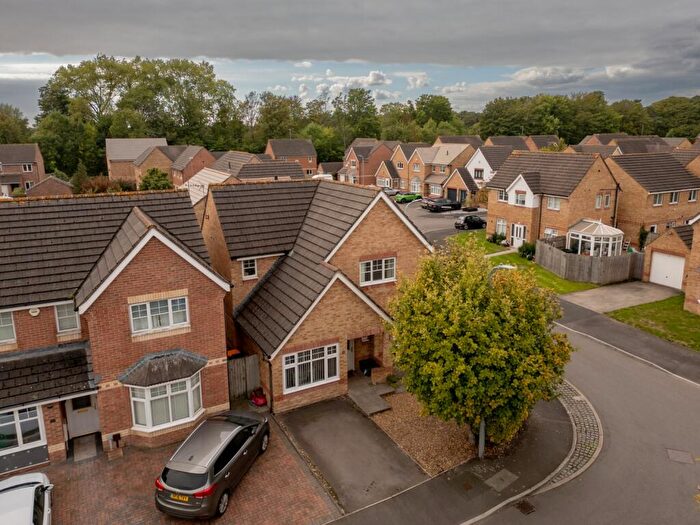
Properties in Tredegar Park have an average house price of £226,754.00 and had 210 Property Transactions within the last 3 years¹.
Tredegar Park is an area in Newport, Casnewydd - Newport with 1,859 households², where the most expensive property was sold for £400,000.00.
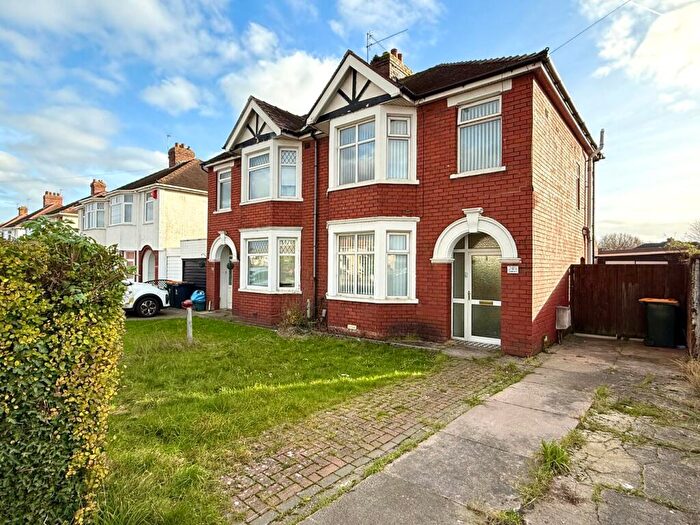
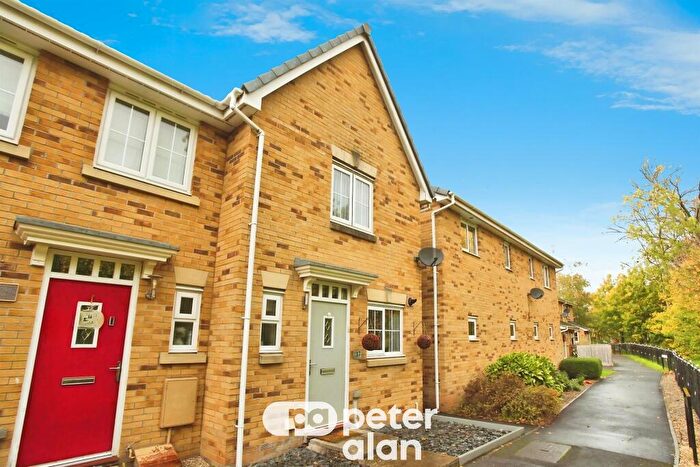
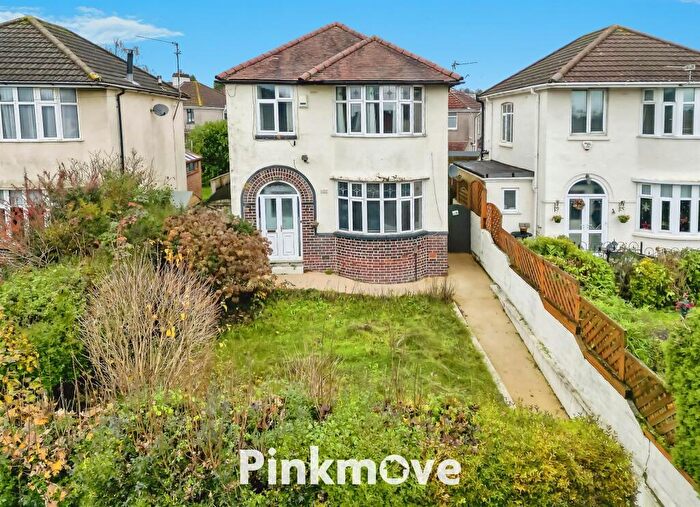
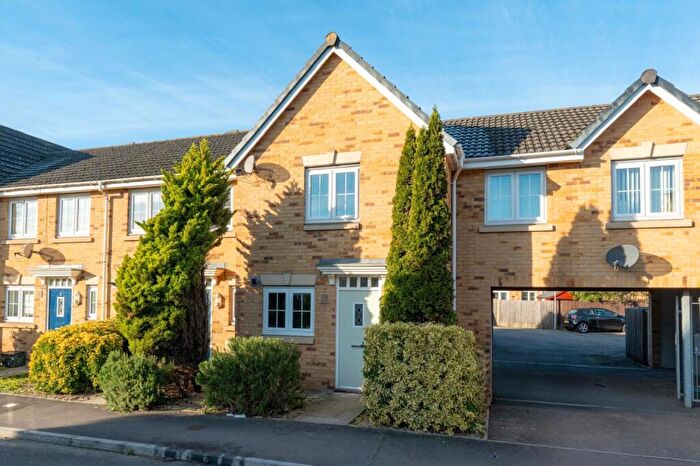
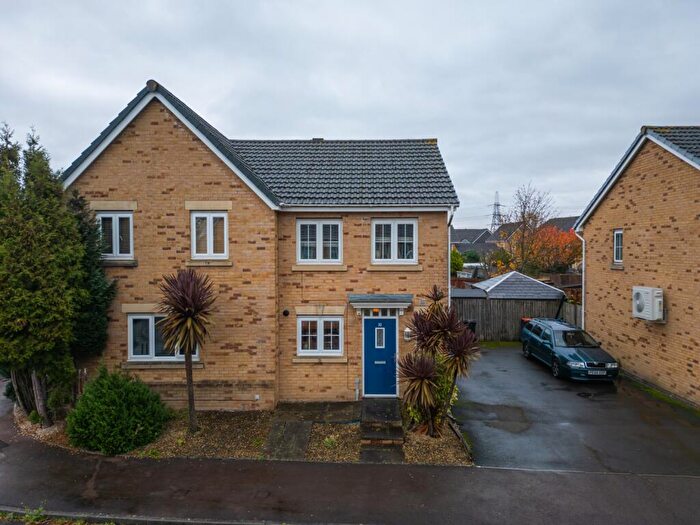
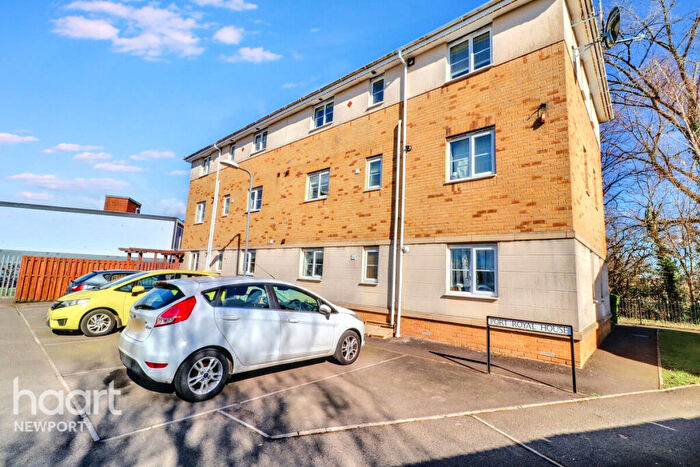
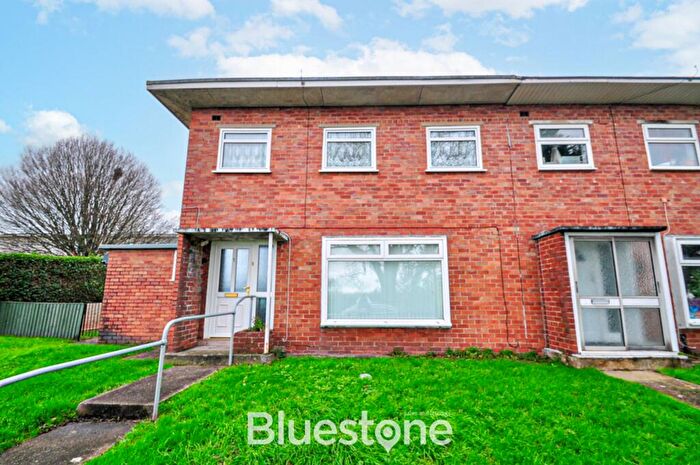
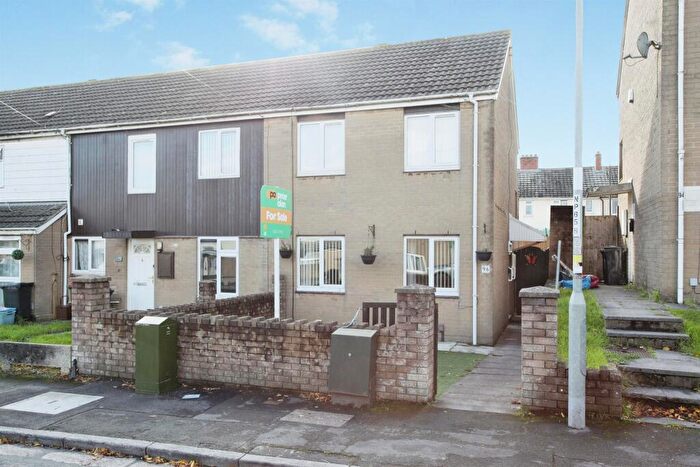
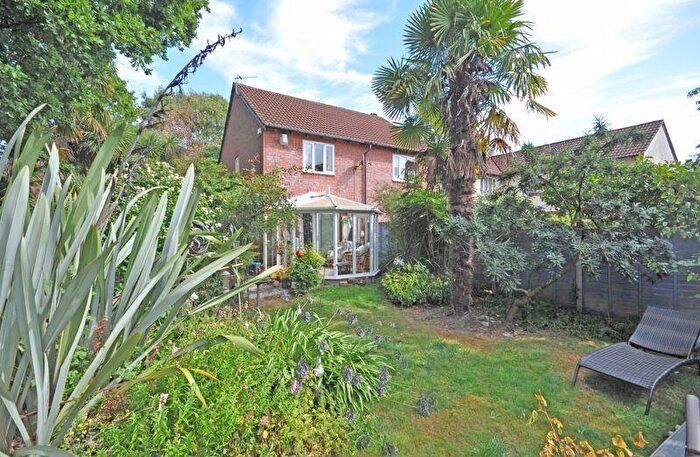
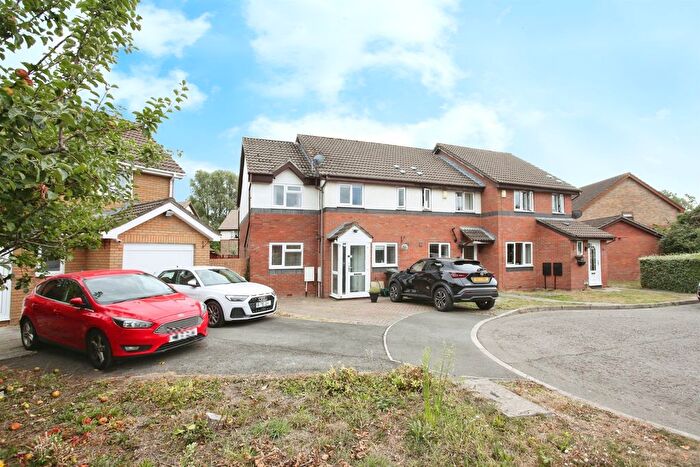
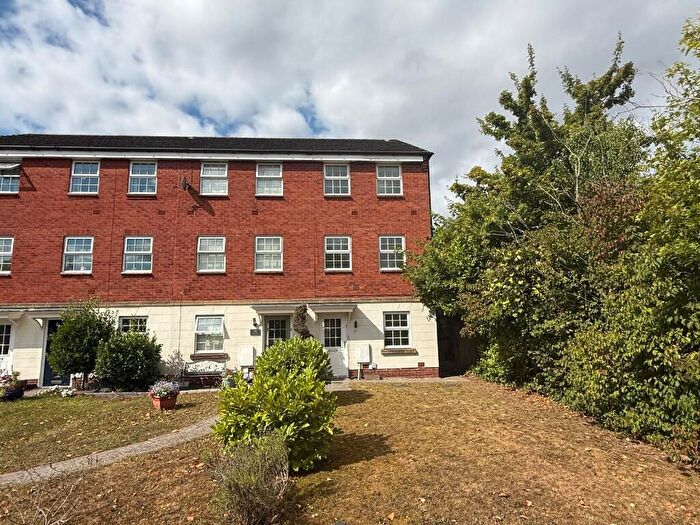
Properties for sale in Tredegar Park
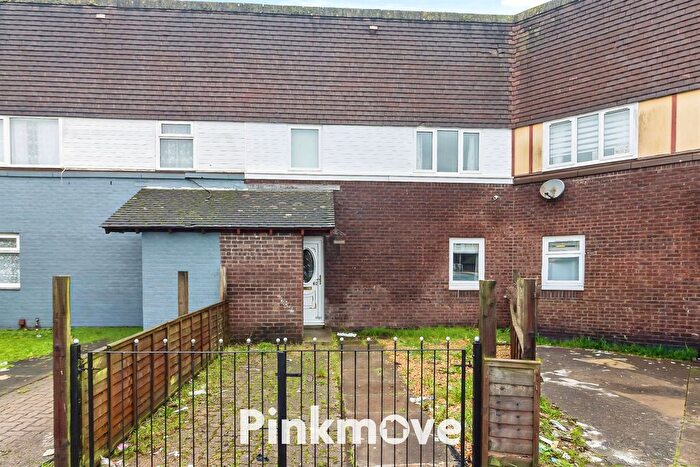
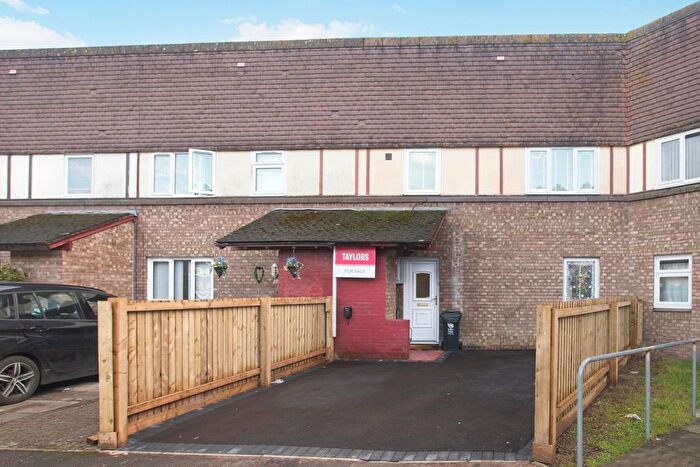
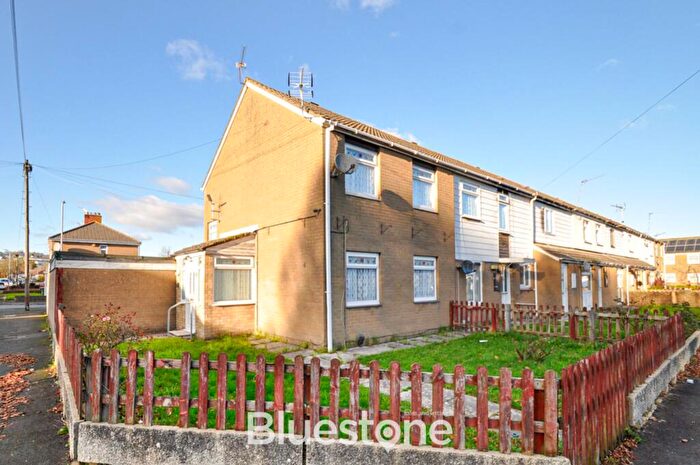
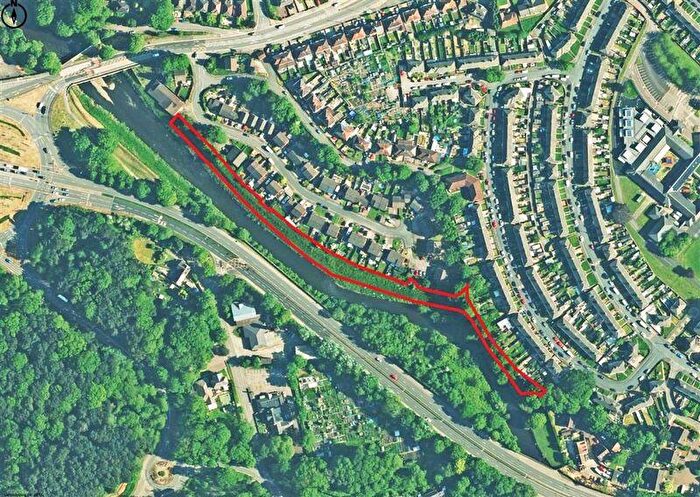
Previously listed properties in Tredegar Park
Roads and Postcodes in Tredegar Park
Navigate through our locations to find the location of your next house in Tredegar Park, Newport for sale or to rent.
| Streets | Postcodes |
|---|---|
| Aneurin Bevan Court | NP10 8WZ |
| Beech Grove | NP10 8TB NP10 8TD |
| Blanche Close | NP10 8QF |
| Brigantine Close | NP10 8ES |
| Brigantine Drive | NP10 8EU |
| Brigantine Grove | NP10 8ET |
| Brigantine Way | NP10 8EW |
| Buccaneer Close | NP10 8EP |
| Buccaneer Grove | NP10 8EQ |
| Buccaneer Way | NP10 8ER |
| Cardiff Road | NP10 8YJ |
| Catherine Close | NP10 8QJ |
| Cedar Gardens | NP10 8AW |
| Chaffinch Way | NP10 8WQ NP10 8WR |
| Charger Street | NP10 8BH |
| Cormorant Way | NP10 8WT NP10 8WU |
| Cowbridge Street | NP10 8BJ |
| Duffryn Way | NP10 8BX |
| Edmundsbury Road | NP10 8AY NP10 8AZ |
| Edney View | NP10 8HP |
| Henry Morgan Close | NP10 8WD |
| Heron Way | NP10 8WS |
| Inkerman Drive | NP10 8BN |
| Jane Close | NP10 8QG |
| Kestrel Way | NP10 8WF NP10 8WG |
| Kingfisher Place | NP10 8WH |
| Lancers Way | NP10 8HN |
| Leslie Green Court | NP10 8WE |
| Lighthouse Road | NP10 8TG NP10 8YD |
| Mallard Way | NP10 8WW |
| Manor Park | NP10 8SA NP10 8SD |
| Morgan Way | NP10 8DA NP10 8DB |
| Nightingale Court | NP10 8WA |
| Octavius Close | NP10 8QL |
| Old Hall Close | NP10 8HQ |
| Orangery Walk | NP10 8HL |
| Partridge Way | NP10 8WN NP10 8WP |
| Pencarn Way | NP10 8XH NP10 8XL |
| Pine Grove | NP10 8TA |
| Rachel Square | NP10 8QN |
| Rosamund Close | NP10 8QH |
| Sabre Close | NP10 8AX |
| Sandpiper Way | NP10 8WX NP10 8WY |
| Schooner Avenue | NP10 8EY |
| Schooner Circle | NP10 8EX |
| Schooner Close | NP10 8EZ |
| Schooner Walk | NP10 8DD NP10 8DZ |
| Sir Briggs Avenue | NP10 8AU |
| Sir Charles Crescent | NP10 8QE |
| Sir Charles Square | NP10 8QP |
| Skye Grove | NP10 8BL |
| Steeplechase Road | NP10 8BG |
| Swallow Way | NP10 8WJ NP10 8WL |
| Tredegar House Drive | NP10 8UX |
| Viscount Evan Drive | NP10 8HJ |
| Woodside | NP10 8XB NP10 8XD NP10 8XE NP10 8XF |
| NP10 8TH |
Transport near Tredegar Park
- FAQ
- Price Paid By Year
- Property Type Price
Frequently asked questions about Tredegar Park
What is the average price for a property for sale in Tredegar Park?
The average price for a property for sale in Tredegar Park is £226,754. This amount is 0.27% lower than the average price in Newport. There are 617 property listings for sale in Tredegar Park.
What streets have the most expensive properties for sale in Tredegar Park?
The streets with the most expensive properties for sale in Tredegar Park are Jane Close at an average of £339,000, Lancers Way at an average of £322,500 and Sir Briggs Avenue at an average of £295,600.
What streets have the most affordable properties for sale in Tredegar Park?
The streets with the most affordable properties for sale in Tredegar Park are Chaffinch Way at an average of £114,000, Partridge Way at an average of £130,690 and Rachel Square at an average of £135,166.
Which train stations are available in or near Tredegar Park?
Some of the train stations available in or near Tredegar Park are Pye Corner, Newport (Gwent) and Rogerstone.
Property Price Paid in Tredegar Park by Year
The average sold property price by year was:
| Year | Average Sold Price | Price Change |
Sold Properties
|
|---|---|---|---|
| 2025 | £226,483 | 7% |
31 Properties |
| 2024 | £210,325 | -2% |
48 Properties |
| 2023 | £214,428 | -15% |
57 Properties |
| 2022 | £247,019 | 19% |
74 Properties |
| 2021 | £199,669 | 13% |
62 Properties |
| 2020 | £173,821 | -7% |
52 Properties |
| 2019 | £185,568 | 6% |
82 Properties |
| 2018 | £175,113 | 3% |
77 Properties |
| 2017 | £169,337 | -6% |
132 Properties |
| 2016 | £180,159 | 5% |
140 Properties |
| 2015 | £171,713 | 22% |
89 Properties |
| 2014 | £133,353 | 4% |
44 Properties |
| 2013 | £128,326 | -5% |
26 Properties |
| 2012 | £134,549 | 1% |
33 Properties |
| 2011 | £133,428 | -10% |
32 Properties |
| 2010 | £146,855 | 9% |
38 Properties |
| 2009 | £134,036 | -3% |
46 Properties |
| 2008 | £138,217 | -12% |
69 Properties |
| 2007 | £154,230 | - |
114 Properties |
| 2006 | £154,292 | 4% |
114 Properties |
| 2005 | £147,903 | 17% |
172 Properties |
| 2004 | £122,308 | 10% |
60 Properties |
| 2003 | £110,565 | 23% |
73 Properties |
| 2002 | £85,525 | 5% |
138 Properties |
| 2001 | £81,266 | 25% |
103 Properties |
| 2000 | £60,771 | -11% |
91 Properties |
| 1999 | £67,404 | 22% |
50 Properties |
| 1998 | £52,909 | 15% |
26 Properties |
| 1997 | £44,749 | 8% |
30 Properties |
| 1996 | £41,229 | -26% |
17 Properties |
| 1995 | £51,867 | - |
47 Properties |
Property Price per Property Type in Tredegar Park
Here you can find historic sold price data in order to help with your property search.
The average Property Paid Price for specific property types in the last three years are:
| Property Type | Average Sold Price | Sold Properties |
|---|---|---|
| Semi Detached House | £234,338.00 | 68 Semi Detached Houses |
| Detached House | £308,046.00 | 54 Detached Houses |
| Terraced House | £176,293.00 | 80 Terraced Houses |
| Flat | £118,187.00 | 8 Flats |

