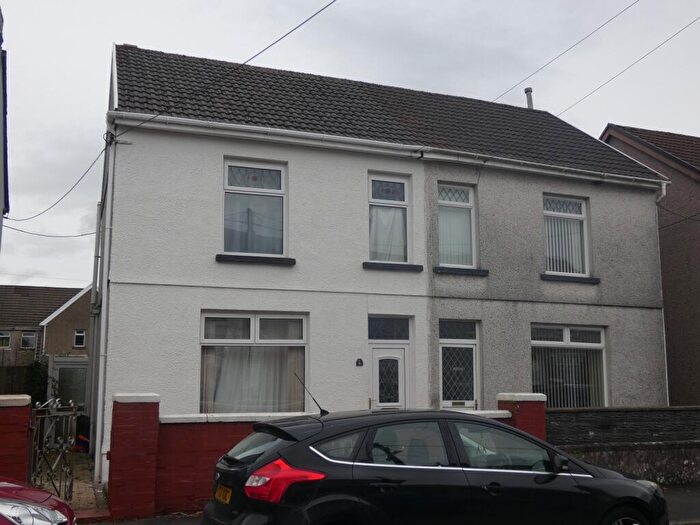
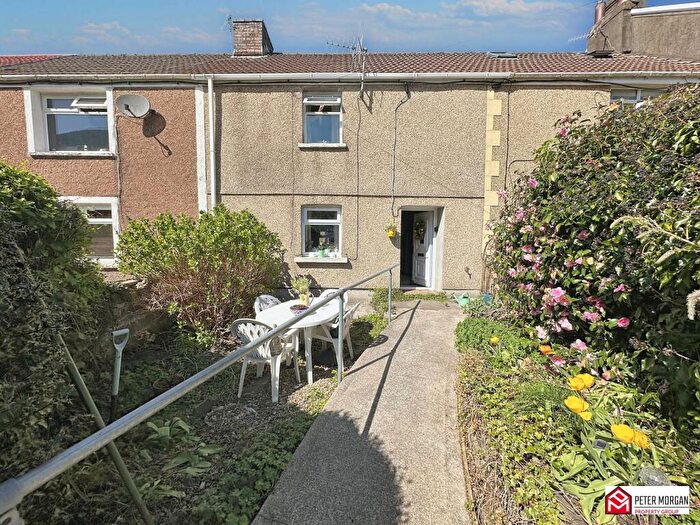
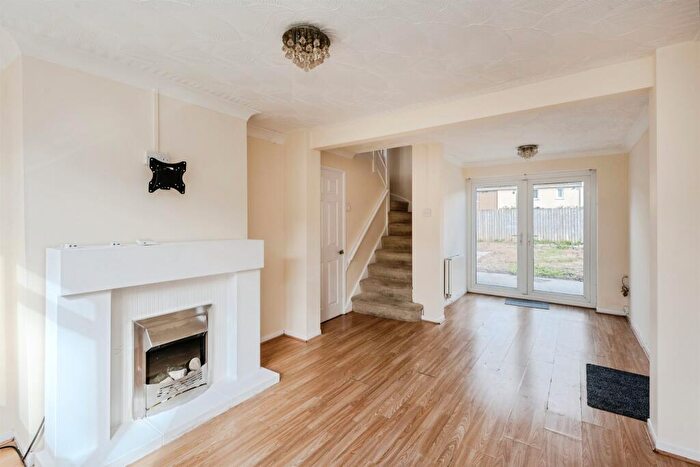
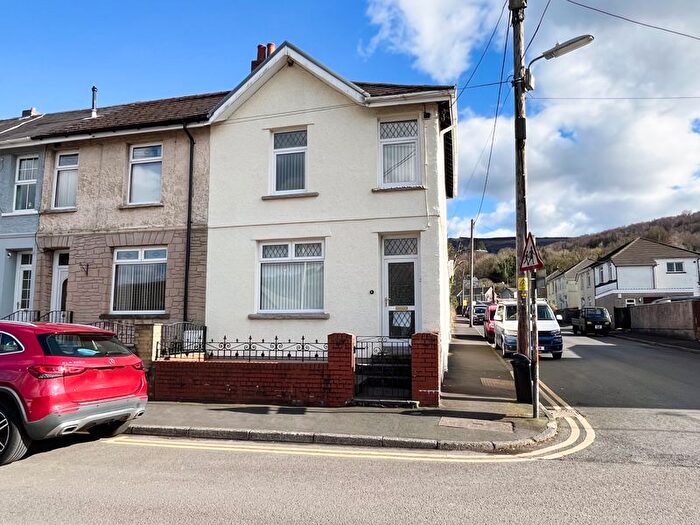
Houses for sale & to rent in Blaengwrach, Neath
House Prices in Blaengwrach
Properties in Blaengwrach have an average house price of £147,968.00 and had 87 Property Transactions within the last 3 years¹.
Blaengwrach is an area in Neath, Castell-nedd Port Talbot - Neath Port Talbot with 817 households², where the most expensive property was sold for £495,000.00.
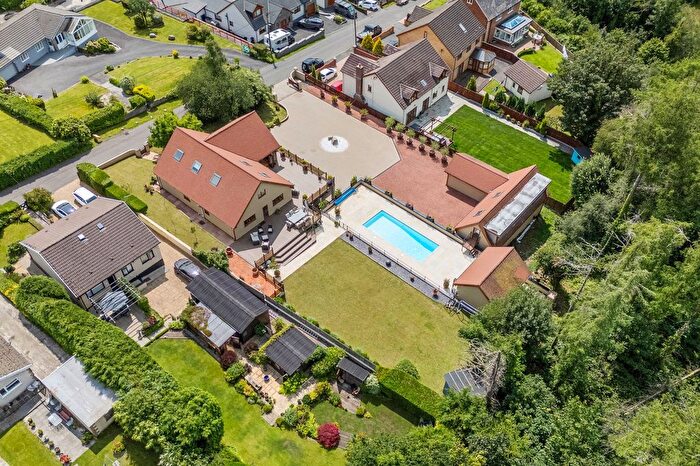
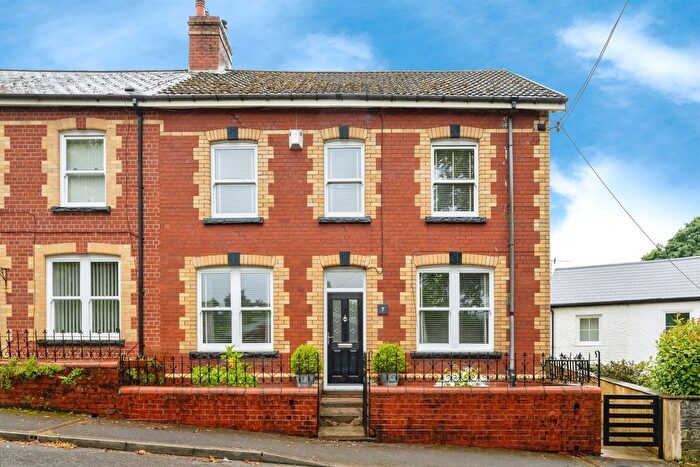
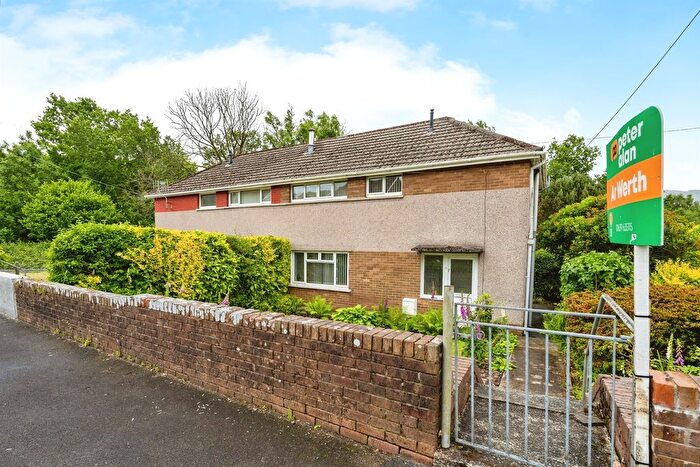
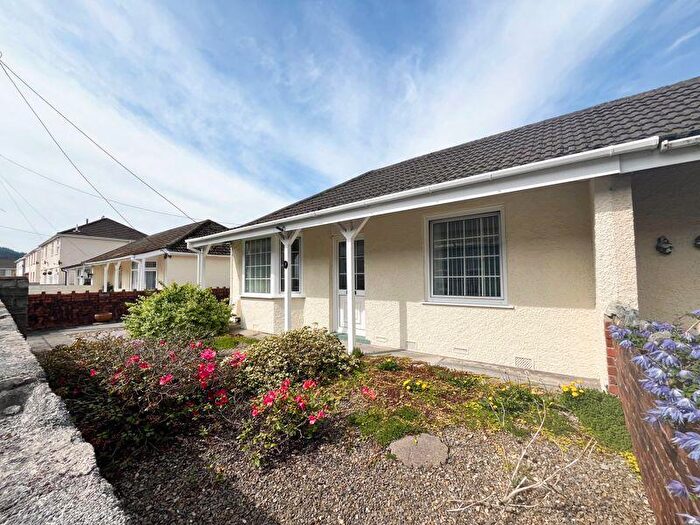
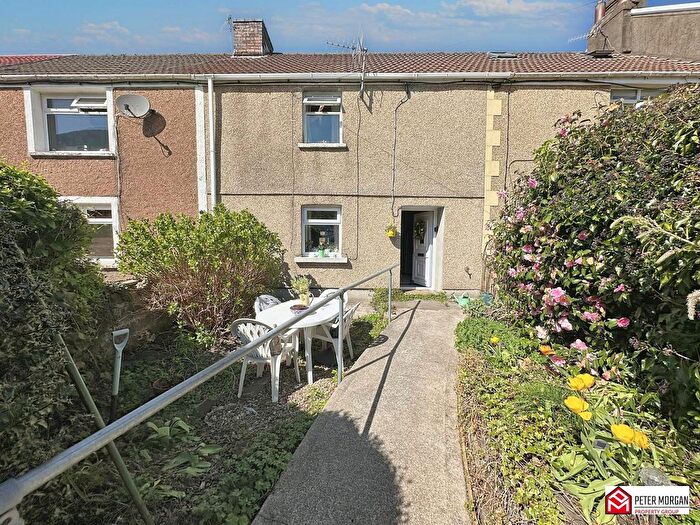
Properties for sale in Blaengwrach
Previously listed properties in Blaengwrach
Roads and Postcodes in Blaengwrach
Navigate through our locations to find the location of your next house in Blaengwrach, Neath for sale or to rent.
| Streets | Postcodes |
|---|---|
| Avon Street | SA11 5EY |
| Cedar Street | SA11 5PF |
| Cefn Gelli | SA11 5PD SA11 5PE |
| Chain Road | SA11 5HP SA11 5HW |
| Chain Walk | SA11 5HE SA11 5SF |
| Church Crescent | SA11 5SL |
| Craig Nedd | SA11 5HG |
| Dunraven Street | SA11 5PB |
| Edward Street | SA11 5PW |
| Empire Avenue | SA11 5ST SA11 5SU |
| Factory Houses | SA11 5ET |
| Forestry Houses | SA11 5TP |
| Fothergill Road | SA11 5PH SA11 5PN |
| Glannant Place | SA11 5TE |
| Godfrey Avenue | SA11 5HF |
| Heol Nedd | SA11 5PL |
| Heol Pantglas | SA11 5PG |
| Heol Wenallt | SA11 5PS SA11 5PT SA11 5PZ |
| Heol Y Felin | SA11 5TB |
| Heol Y Graig | SA11 5TW |
| High Street | SA11 5SY SA11 5TA SA11 5AZ SA11 5RX |
| Llys Catwg | SA11 5HL |
| Maes Marchog Isaf | SA11 5EZ |
| Maes Y Ceffyl | SA11 5PJ |
| Maes Y Dre | SA11 5HH |
| Mill Terrace | SA11 5ES |
| Parish Road | SA11 5SW |
| Pentre Street | SA11 5EU SA11 5HA SA11 5HD |
| Pontwalby | SA11 5LW |
| School Street | SA11 5PP |
| St Marys Close | SA11 5SN |
| Tan Y Bryn Terrace | SA11 5PU |
| Ynys Cadwyn | SA11 5HN |
| CF44 9UR SA11 5NZ SA11 5PR SA11 5TD |
Transport near Blaengwrach
-
Treherbert Station
-
Ynyswen Station
-
Treorchy Station
-
Aberdare Station
-
Maesteg Station
-
Neath Station
-
Ton Pentre Station
-
Maesteg (Ewenny Road) Station
-
Garth (Mid-Glamorgan) Station
-
Ystrad Rhondda Station
- FAQ
- Price Paid By Year
- Property Type Price
Frequently asked questions about Blaengwrach
What is the average price for a property for sale in Blaengwrach?
The average price for a property for sale in Blaengwrach is £147,968. This amount is 11% lower than the average price in Neath. There are 192 property listings for sale in Blaengwrach.
What streets have the most expensive properties for sale in Blaengwrach?
The streets with the most expensive properties for sale in Blaengwrach are Parish Road at an average of £249,400, High Street at an average of £187,500 and Empire Avenue at an average of £165,300.
What streets have the most affordable properties for sale in Blaengwrach?
The streets with the most affordable properties for sale in Blaengwrach are Craig Nedd at an average of £102,100, Fothergill Road at an average of £105,900 and Pentre Street at an average of £109,321.
Which train stations are available in or near Blaengwrach?
Some of the train stations available in or near Blaengwrach are Treherbert, Ynyswen and Treorchy.
Property Price Paid in Blaengwrach by Year
The average sold property price by year was:
| Year | Average Sold Price | Price Change |
Sold Properties
|
|---|---|---|---|
| 2025 | £154,250 | 4% |
8 Properties |
| 2024 | £148,355 | -2% |
26 Properties |
| 2023 | £151,766 | 7% |
30 Properties |
| 2022 | £140,391 | -1% |
23 Properties |
| 2021 | £141,578 | 26% |
30 Properties |
| 2020 | £104,190 | -2% |
21 Properties |
| 2019 | £106,100 | 1% |
26 Properties |
| 2018 | £105,138 | -11% |
18 Properties |
| 2017 | £116,834 | 25% |
32 Properties |
| 2016 | £87,619 | -11% |
23 Properties |
| 2015 | £97,557 | 8% |
14 Properties |
| 2014 | £89,655 | -8% |
19 Properties |
| 2013 | £97,187 | -0,2% |
20 Properties |
| 2012 | £97,370 | -4% |
12 Properties |
| 2011 | £101,393 | 11% |
14 Properties |
| 2010 | £90,229 | -28% |
12 Properties |
| 2009 | £115,613 | -3% |
11 Properties |
| 2008 | £119,371 | 2% |
16 Properties |
| 2007 | £116,538 | 16% |
26 Properties |
| 2006 | £97,971 | 7% |
41 Properties |
| 2005 | £90,997 | 26% |
26 Properties |
| 2004 | £67,640 | 21% |
28 Properties |
| 2003 | £53,672 | 6% |
22 Properties |
| 2002 | £50,453 | 32% |
27 Properties |
| 2001 | £34,297 | 17% |
25 Properties |
| 2000 | £28,630 | 10% |
18 Properties |
| 1999 | £25,855 | -34% |
17 Properties |
| 1998 | £34,583 | 12% |
12 Properties |
| 1997 | £30,280 | 3% |
25 Properties |
| 1996 | £29,357 | -11% |
14 Properties |
| 1995 | £32,447 | - |
22 Properties |
Property Price per Property Type in Blaengwrach
Here you can find historic sold price data in order to help with your property search.
The average Property Paid Price for specific property types in the last three years are:
| Property Type | Average Sold Price | Sold Properties |
|---|---|---|
| Semi Detached House | £132,217.00 | 48 Semi Detached Houses |
| Detached House | £282,545.00 | 11 Detached Houses |
| Terraced House | £128,760.00 | 25 Terraced Houses |
| Flat | £66,600.00 | 3 Flats |

