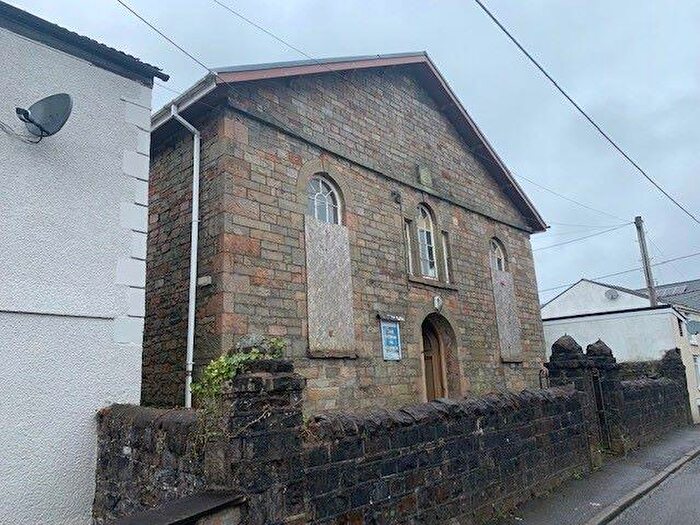
Houses for sale & to rent in Glynneath, Neath
House Prices in Glynneath
Properties in Glynneath have an average house price of £153,853.00 and had 119 Property Transactions within the last 3 years¹.
Glynneath is an area in Neath, Castell-nedd Port Talbot - Neath Port Talbot with 1,519 households², where the most expensive property was sold for £370,000.00.
Properties for sale in Glynneath
Previously listed properties in Glynneath
Roads and Postcodes in Glynneath
Navigate through our locations to find the location of your next house in Glynneath, Neath for sale or to rent.
| Streets | Postcodes |
|---|---|
| Aberdare Road | SA11 5HY SA11 5LD SA11 5AQ |
| Addoldy Road | SA11 5DU SA11 5EB |
| Bethania Street | SA11 5DE |
| Bethel Road | SA11 5DG |
| Brynhyfryd | SA11 5BA |
| Brynivor | SA11 5LH |
| Canal Place | SA11 5DF |
| Coed Y Pergwm | SA11 5SA |
| Derifach Lane | SA11 5PX |
| Earlsfield Close | SA11 5DS |
| Edward Street | SA11 5DL |
| Gelliceibryn | SA11 5ED |
| Gellidawel Road | SA11 5DN |
| Ger Y Nant | SA11 5RN |
| Glan Gwerelych | SA11 5LN |
| Glynmelyn Road | SA11 5BH |
| Glynneath Road | SA11 5AT |
| Golwg Y Coed | SA11 5SQ |
| Hays Crescent | SA11 5BE |
| Heathfield Avenue | SA11 5AB SA11 5AH |
| Heol Y Glyn | SA11 5AU SA11 5BB |
| High Street | SA11 5AL SA11 5AP SA11 5AW SA11 5BR SA11 5BS SA11 5BU SA11 5DA |
| Intervalley Road | SA11 5TU SA11 5TY |
| Ivorites Row | SA11 5LF |
| Lancaster Close | SA11 5EF |
| Llewellyn Street | SA11 5AE SA11 5AF |
| Llygad Yr Haul | SA11 5RL |
| Lon Y Bryn | SA11 5BG |
| Lon Y Nant | SA11 5BD |
| Lon Y Parc | SA11 5DX |
| Maes Y Ffynnon | SA11 5EN |
| Maes Y Pergwm | SA11 5EA |
| Maes Yr Eglwys | SA11 5SD SA11 5SE |
| Manor Drive | SA11 5RE |
| Merthyr Road | SA11 5LR SA11 5LE SA11 5LU |
| Min Y Coed | SA11 5RT SA11 5RY |
| Morfa Glas | SA11 5RP SA11 5RR SA11 5RS SA11 5RW |
| Nant Hir | SA11 5RF |
| New Street | SA11 5AA SA11 5AG |
| Oddfellows Street | SA11 5DB |
| Park Avenue | SA11 5DP SA11 5DR SA11 5DW SA11 5DZ |
| Pentreclwyda | SA11 4DU |
| Plas-y-coed | SA11 5SB |
| Pontneathvaughan Road | SA11 5AR SA11 5NR SA11 5NS SA11 5NT |
| Pontwalby | SA11 5LT SA11 5LG SA11 5LL |
| Rheola | SA11 4DT |
| Riverside Gardens | SA11 5LA |
| Robert Street | SA11 5EG |
| Roberts Close | SA11 5HR |
| Rock Street | SA11 5EE |
| School Place | SA11 5DD |
| Tramway Side | SA11 5LP |
| Waungron | SA11 5AS |
| Wellfield Place | SA11 5ER |
| Whitefield Close | SA11 5DY |
| Whitting Street | SA11 5DH |
| Woodland Park | SA11 5AY |
| Ynyslas Crescent | SA11 5LB |
| Ynysynos Avenue | SA11 5LS |
| SA11 5PY SA11 5RG SA11 5UE SA11 4DY SA11 5AJ SA11 5AX SA11 5EP SA11 5EW SA11 5RA SA11 5RH SA11 5RU SA11 5UD |
Transport near Glynneath
-
Treherbert Station
-
Ynyswen Station
-
Treorchy Station
-
Aberdare Station
-
Ton Pentre Station
-
Maesteg Station
-
Cwmbach Station
-
Neath Station
-
Maesteg (Ewenny Road) Station
-
Ystrad Rhondda Station
- FAQ
- Price Paid By Year
- Property Type Price
Frequently asked questions about Glynneath
What is the average price for a property for sale in Glynneath?
The average price for a property for sale in Glynneath is £153,853. This amount is 8% lower than the average price in Neath. There are 378 property listings for sale in Glynneath.
What streets have the most expensive properties for sale in Glynneath?
The streets with the most expensive properties for sale in Glynneath are Glynmelyn Road at an average of £243,000, Park Avenue at an average of £213,800 and Waungron at an average of £196,666.
What streets have the most affordable properties for sale in Glynneath?
The streets with the most affordable properties for sale in Glynneath are Coed Y Pergwm at an average of £45,000, Oddfellows Street at an average of £80,872 and New Street at an average of £84,000.
Which train stations are available in or near Glynneath?
Some of the train stations available in or near Glynneath are Treherbert, Ynyswen and Treorchy.
Property Price Paid in Glynneath by Year
The average sold property price by year was:
| Year | Average Sold Price | Price Change |
Sold Properties
|
|---|---|---|---|
| 2025 | £169,051 | 11% |
29 Properties |
| 2024 | £151,288 | 3% |
44 Properties |
| 2023 | £146,724 | 2% |
46 Properties |
| 2022 | £144,498 | -7% |
56 Properties |
| 2021 | £154,021 | 26% |
54 Properties |
| 2020 | £114,146 | 2% |
34 Properties |
| 2019 | £111,313 | 10% |
53 Properties |
| 2018 | £100,460 | -7% |
46 Properties |
| 2017 | £107,842 | 1% |
35 Properties |
| 2016 | £106,389 | 7% |
40 Properties |
| 2015 | £99,062 | -1% |
39 Properties |
| 2014 | £100,513 | 5% |
37 Properties |
| 2013 | £95,487 | -2% |
39 Properties |
| 2012 | £97,748 | -0,1% |
28 Properties |
| 2011 | £97,874 | -9% |
43 Properties |
| 2010 | £106,601 | 10% |
33 Properties |
| 2009 | £95,897 | -9% |
20 Properties |
| 2008 | £104,233 | -10% |
30 Properties |
| 2007 | £114,662 | 22% |
51 Properties |
| 2006 | £89,963 | -9% |
46 Properties |
| 2005 | £98,314 | 26% |
54 Properties |
| 2004 | £72,384 | 30% |
41 Properties |
| 2003 | £50,317 | -0,1% |
41 Properties |
| 2002 | £50,356 | 21% |
52 Properties |
| 2001 | £39,928 | -2% |
35 Properties |
| 2000 | £40,783 | 10% |
51 Properties |
| 1999 | £36,833 | 5% |
34 Properties |
| 1998 | £35,066 | -7% |
33 Properties |
| 1997 | £37,620 | 6% |
36 Properties |
| 1996 | £35,301 | 7% |
36 Properties |
| 1995 | £32,734 | - |
21 Properties |
Property Price per Property Type in Glynneath
Here you can find historic sold price data in order to help with your property search.
The average Property Paid Price for specific property types in the last three years are:
| Property Type | Average Sold Price | Sold Properties |
|---|---|---|
| Semi Detached House | £158,124.00 | 60 Semi Detached Houses |
| Detached House | £260,333.00 | 18 Detached Houses |
| Terraced House | £104,238.00 | 36 Terraced Houses |
| Flat | £76,500.00 | 5 Flats |

