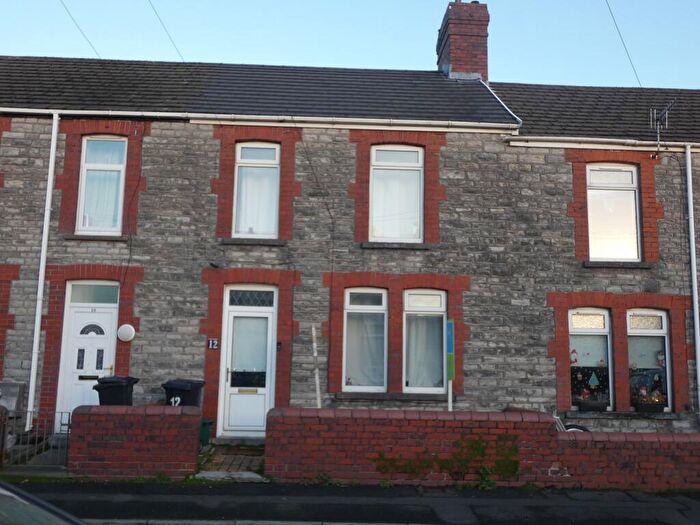
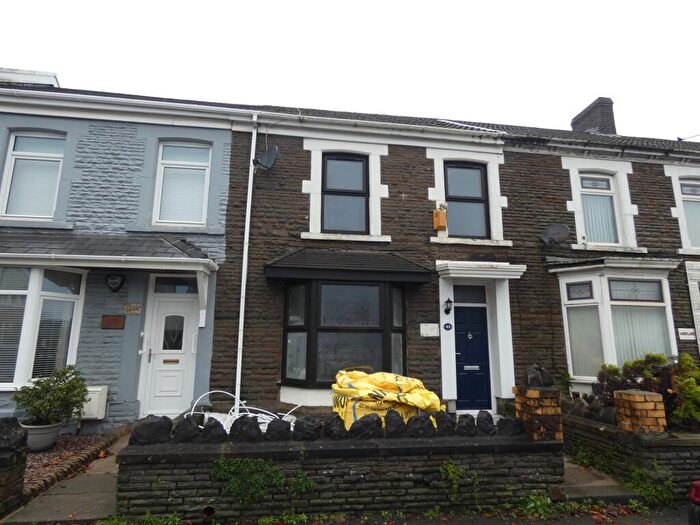
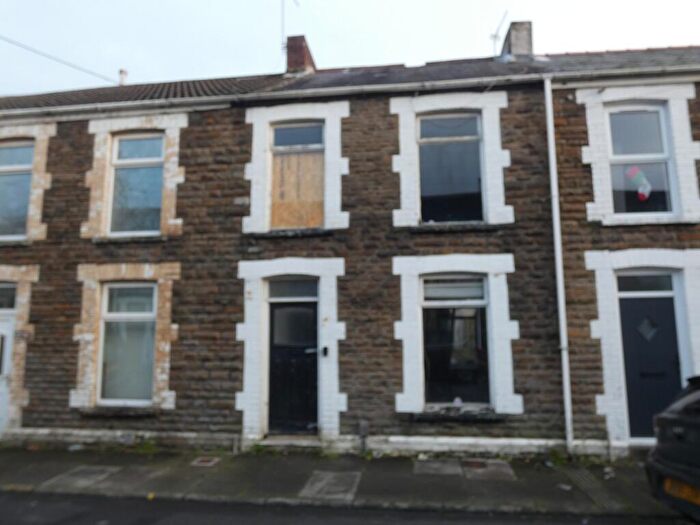
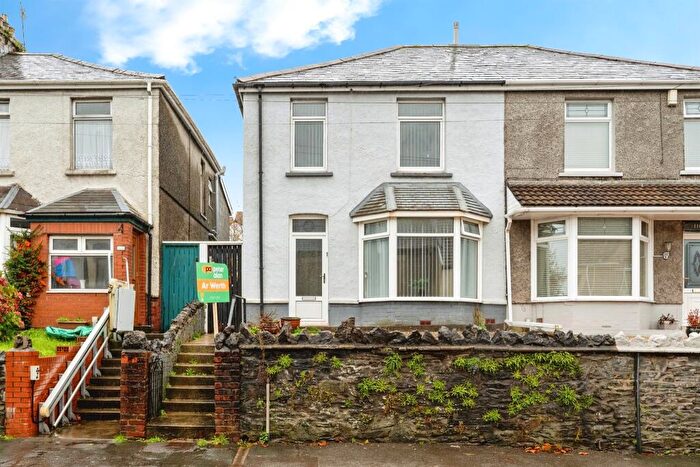
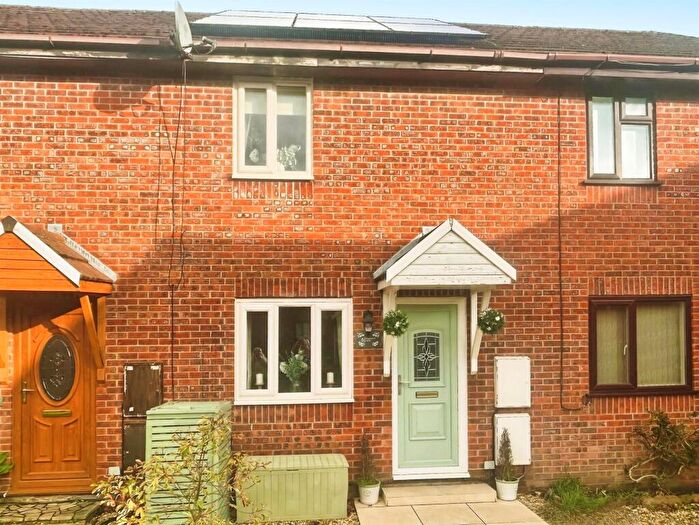
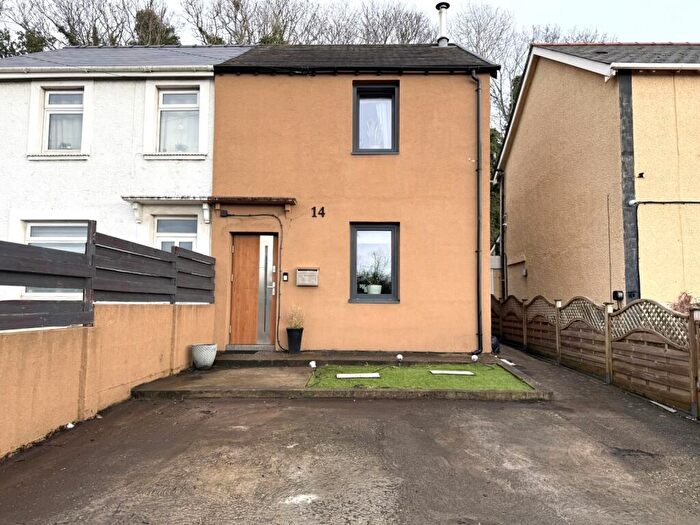
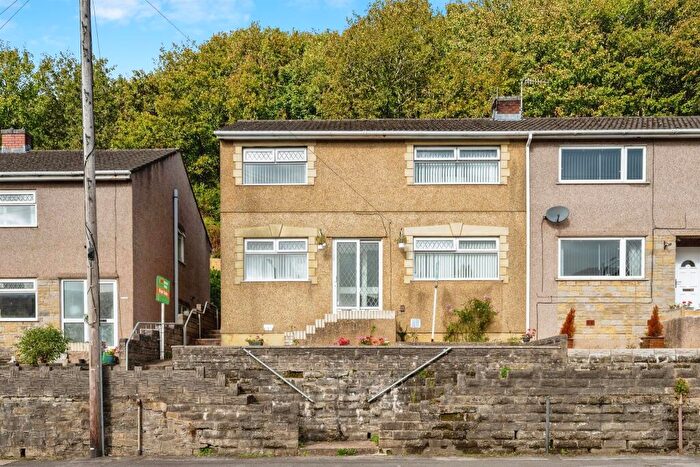
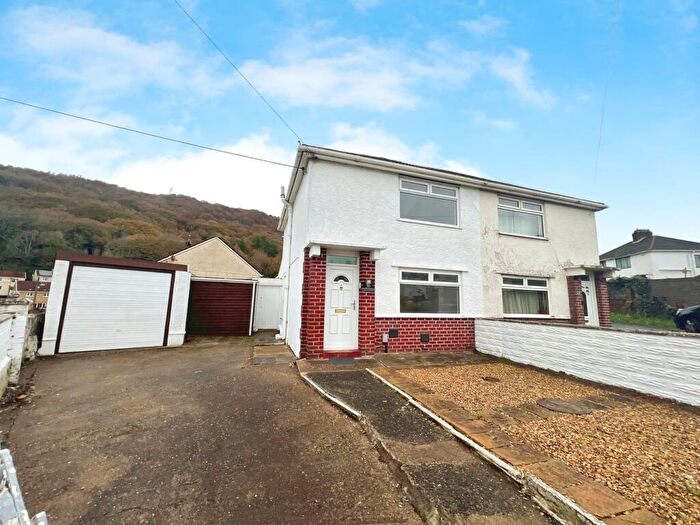
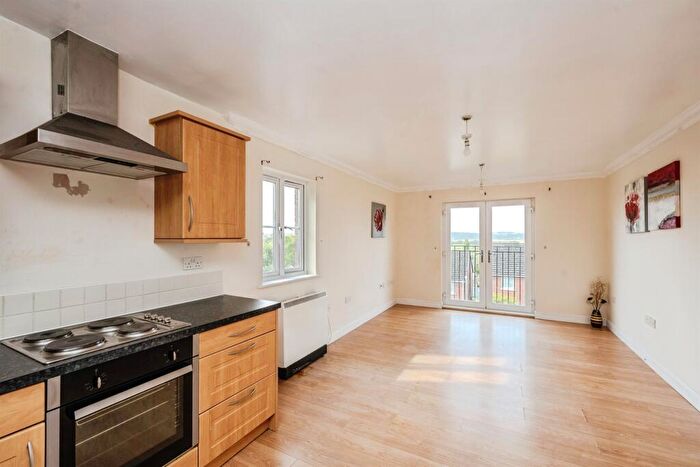
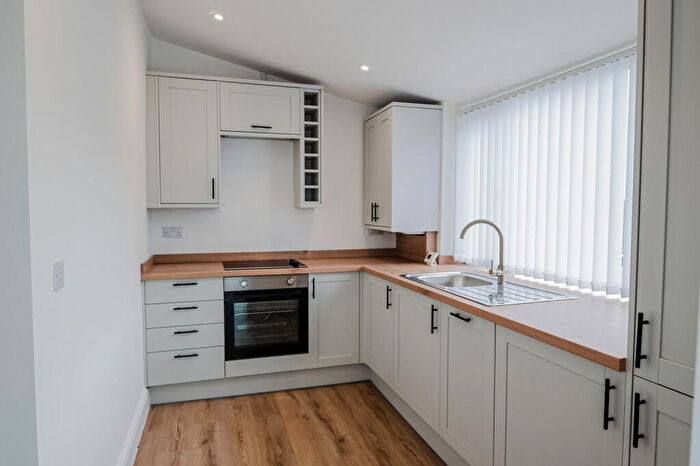
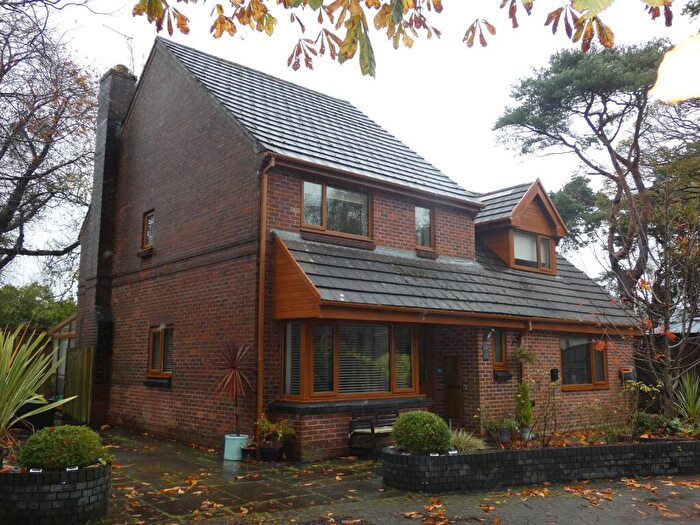
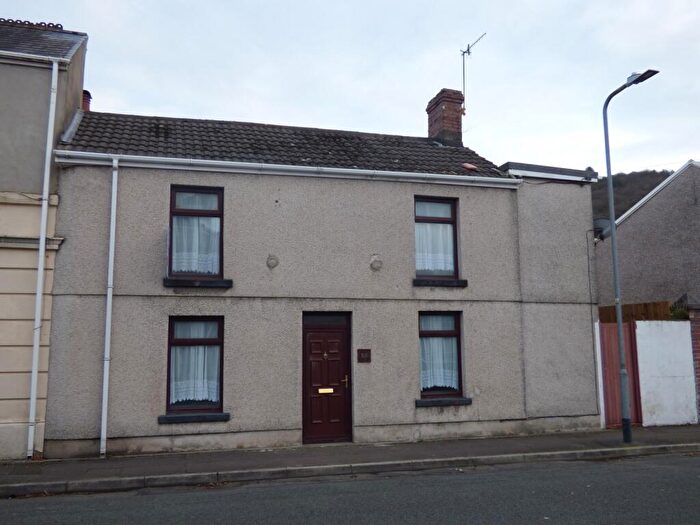
Houses for sale & to rent in Briton Ferry East, Neath
House Prices in Briton Ferry East
Properties in Briton Ferry East have an average house price of £120,411.00 and had 221 Property Transactions within the last 3 years¹.
Briton Ferry East is an area in Neath, Castell-nedd Port Talbot - Neath Port Talbot with 1,391 households², where the most expensive property was sold for £380,000.00.
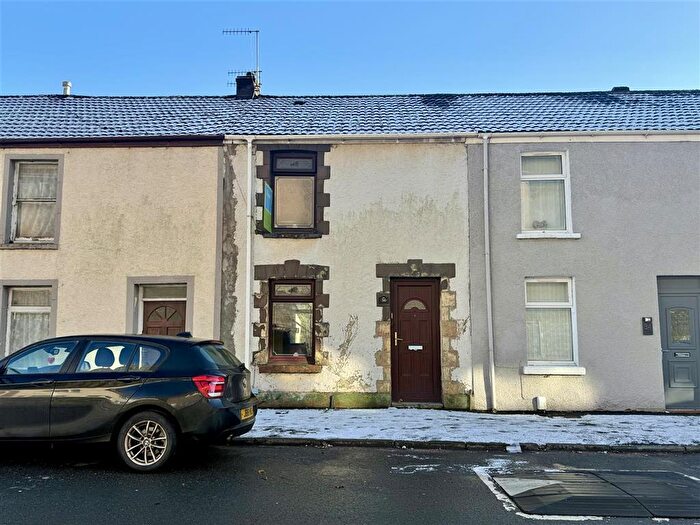
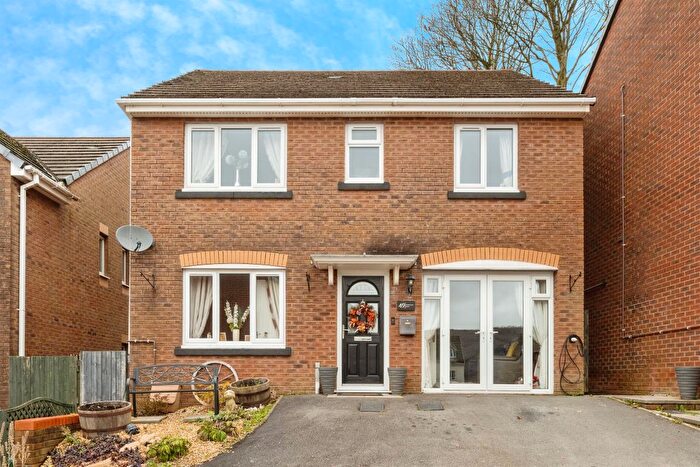
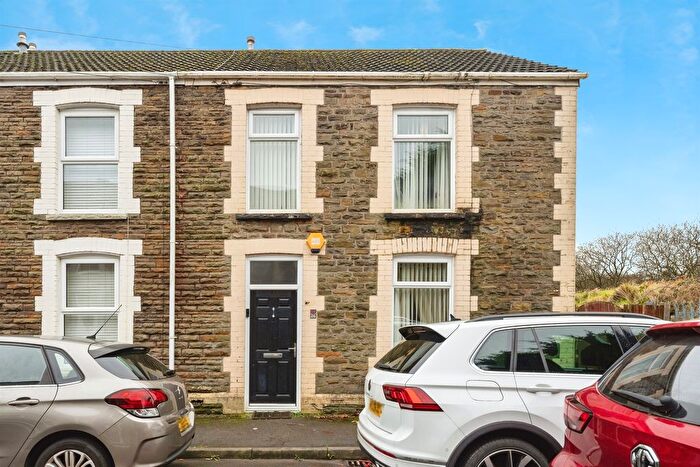
Properties for sale in Briton Ferry East
Roads and Postcodes in Briton Ferry East
Navigate through our locations to find the location of your next house in Briton Ferry East, Neath for sale or to rent.
| Streets | Postcodes |
|---|---|
| Alexander Road | SA11 2SN |
| Baglan Old Road | SA11 2YW |
| Bethel Street | SA11 2HQ |
| Caroline Street | SA11 2RT |
| Cwm Y Dwr | SA11 2YT |
| Cwrt Sart | SA11 2SR SA11 2ST |
| Cwrt Yr Ysgol | SA11 2TP |
| Darren Road | SA11 2TD |
| Farm Road | SA11 2TA |
| Ferry Close | SA11 2RW |
| Gower Street | SA11 2SW |
| Graig Road | SA11 2YY |
| Grandison Street | SA11 2PG |
| Hill Street | SA11 2SE |
| Hoo Street | SA11 2PA |
| Hunter Street | SA11 2RL SA11 2RP SA11 2RS |
| Llansawel | SA11 2SG |
| Lodge Court | SA11 2TJ |
| Manor Way | SA11 2TR |
| Mansel Street | SA11 2PD |
| Middleton Street | SA11 2NU |
| Morgans Terrace | SA11 2SY |
| Neath Road | SA11 2AJ SA11 2AQ SA11 2AX SA11 2AZ SA11 2BJ SA11 2BX SA11 2BZ SA11 2DQ SA11 2DX SA11 2SL SA11 2YR SA11 2YU SA11 2BQ |
| Old Road | SA11 2ER SA11 2ES SA11 2ET SA11 2EU SA11 2EY SA11 2HA |
| Ormond Street | SA11 2TG SA11 2TH |
| Osterley Street | SA11 2NY |
| Panthowell Ddu Road | SA11 2TU SA11 2TY |
| Regent Street East | SA11 2RR SA11 2RU SA11 2SA |
| Ritson Street | SA11 2RN |
| Rockingham Terrace | SA11 2PB SA11 2PF SA11 2PH |
| Sand Lane | SA11 2EX |
| Shelone Road | SA11 2NR SA11 2NS |
| Short Street | SA11 2SS |
| Station Road | SA11 2SU |
| Thomas Street | SA11 2RY SA11 2SB SA11 2SD |
| Tucker Street | SA11 2SP |
| Ty Llansawel | SA11 2SH |
| Tyla Road | SA11 2TB |
| Vernon Street | SA11 2PE |
| Villiers Street | SA11 2DZ |
| Ynysymaerdy Road | SA11 2TE SA11 2TF SA11 2TL SA11 2TS SA11 2TT SA11 2TW |
| SA11 2HS SA11 3QS |
Transport near Briton Ferry East
- FAQ
- Price Paid By Year
- Property Type Price
Frequently asked questions about Briton Ferry East
What is the average price for a property for sale in Briton Ferry East?
The average price for a property for sale in Briton Ferry East is £120,411. This amount is 27% lower than the average price in Neath. There are 1,106 property listings for sale in Briton Ferry East.
What streets have the most expensive properties for sale in Briton Ferry East?
The streets with the most expensive properties for sale in Briton Ferry East are Panthowell Ddu Road at an average of £245,500, Manor Way at an average of £177,909 and Ormond Street at an average of £165,500.
What streets have the most affordable properties for sale in Briton Ferry East?
The streets with the most affordable properties for sale in Briton Ferry East are Villiers Street at an average of £54,666, Shelone Road at an average of £70,000 and Ritson Street at an average of £84,250.
Which train stations are available in or near Briton Ferry East?
Some of the train stations available in or near Briton Ferry East are Briton Ferry, Baglan and Neath.
Property Price Paid in Briton Ferry East by Year
The average sold property price by year was:
| Year | Average Sold Price | Price Change |
Sold Properties
|
|---|---|---|---|
| 2025 | £133,862 | 12% |
32 Properties |
| 2024 | £118,169 | -3% |
75 Properties |
| 2023 | £121,553 | 5% |
55 Properties |
| 2022 | £114,902 | -0,1% |
59 Properties |
| 2021 | £115,008 | 24% |
56 Properties |
| 2020 | £86,862 | -9% |
47 Properties |
| 2019 | £95,030 | 13% |
60 Properties |
| 2018 | £82,205 | 4% |
60 Properties |
| 2017 | £78,676 | 2% |
56 Properties |
| 2016 | £77,042 | -15% |
54 Properties |
| 2015 | £88,392 | 8% |
43 Properties |
| 2014 | £81,509 | 4% |
38 Properties |
| 2013 | £77,934 | 6% |
39 Properties |
| 2012 | £73,061 | -1% |
32 Properties |
| 2011 | £73,611 | -6% |
22 Properties |
| 2010 | £78,174 | -0,1% |
32 Properties |
| 2009 | £78,241 | -18% |
29 Properties |
| 2008 | £92,209 | 1% |
38 Properties |
| 2007 | £91,157 | 11% |
69 Properties |
| 2006 | £81,049 | -3% |
75 Properties |
| 2005 | £83,631 | 13% |
67 Properties |
| 2004 | £72,866 | 35% |
84 Properties |
| 2003 | £47,689 | 17% |
81 Properties |
| 2002 | £39,536 | 9% |
86 Properties |
| 2001 | £35,817 | -9% |
59 Properties |
| 2000 | £39,074 | 17% |
74 Properties |
| 1999 | £32,550 | -8% |
48 Properties |
| 1998 | £35,106 | 17% |
56 Properties |
| 1997 | £29,313 | -18% |
51 Properties |
| 1996 | £34,667 | 17% |
49 Properties |
| 1995 | £28,773 | - |
26 Properties |
Property Price per Property Type in Briton Ferry East
Here you can find historic sold price data in order to help with your property search.
The average Property Paid Price for specific property types in the last three years are:
| Property Type | Average Sold Price | Sold Properties |
|---|---|---|
| Semi Detached House | £149,151.00 | 36 Semi Detached Houses |
| Detached House | £219,900.00 | 15 Detached Houses |
| Terraced House | £105,842.00 | 168 Terraced Houses |
| Flat | £80,750.00 | 2 Flats |

