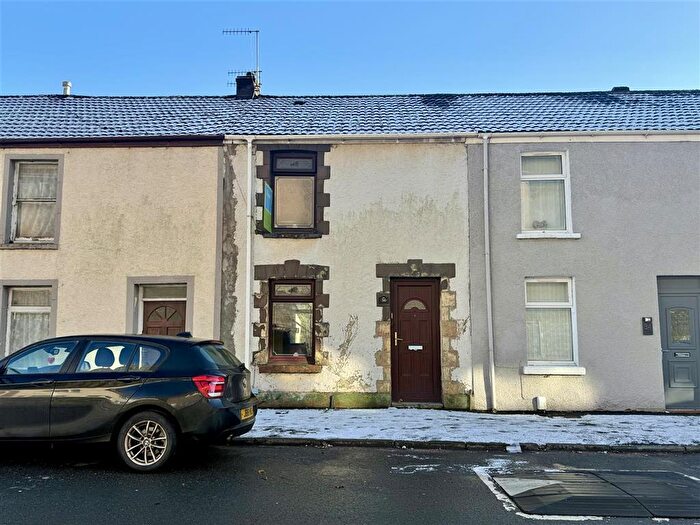
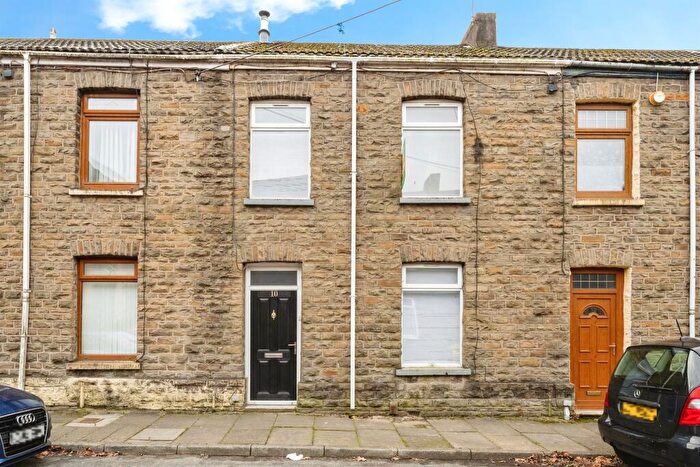
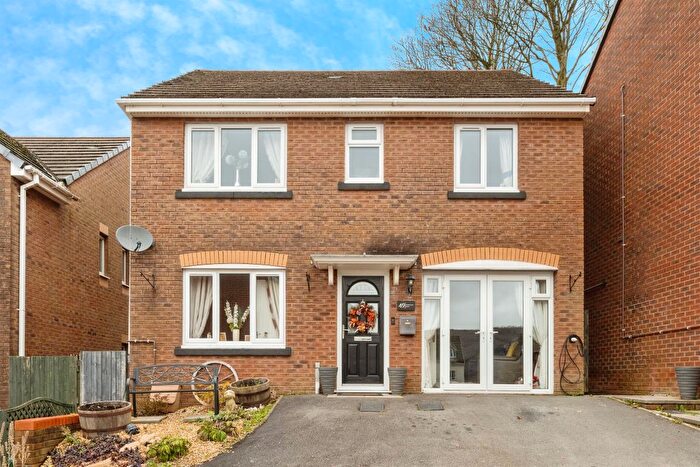
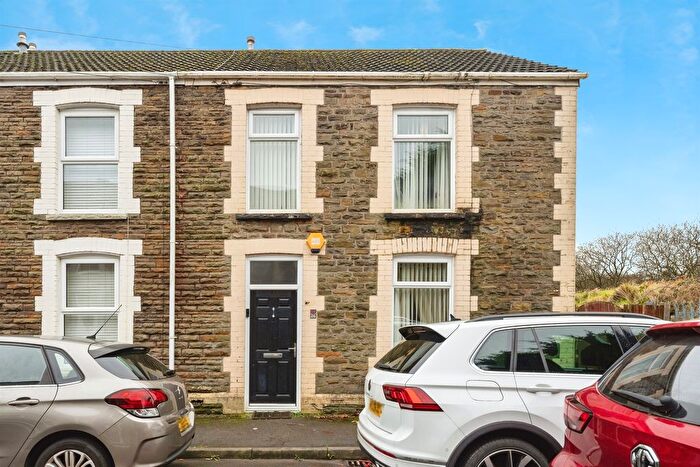
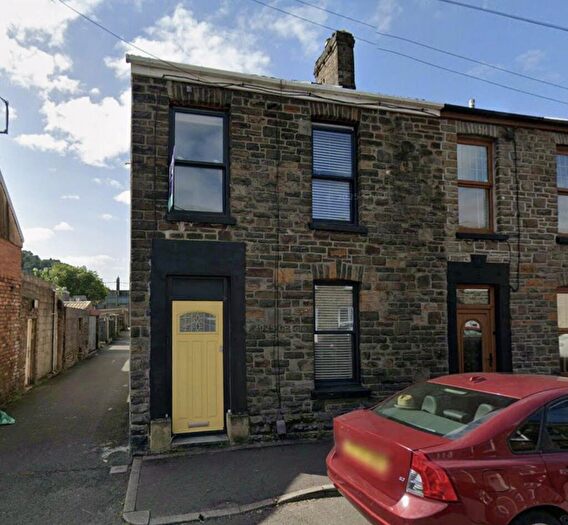
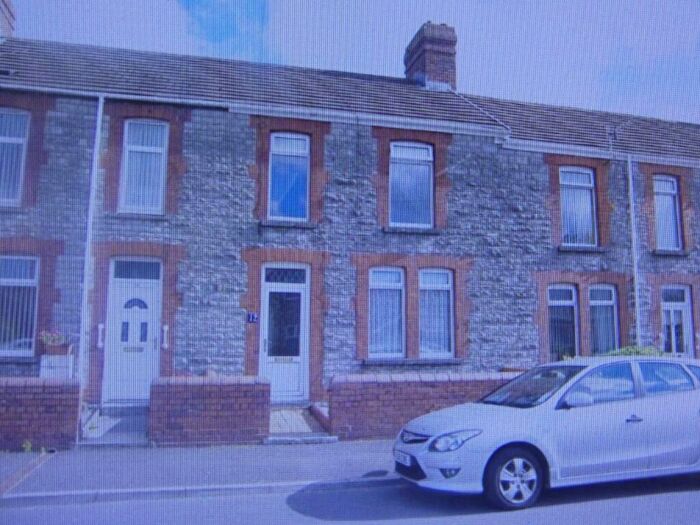
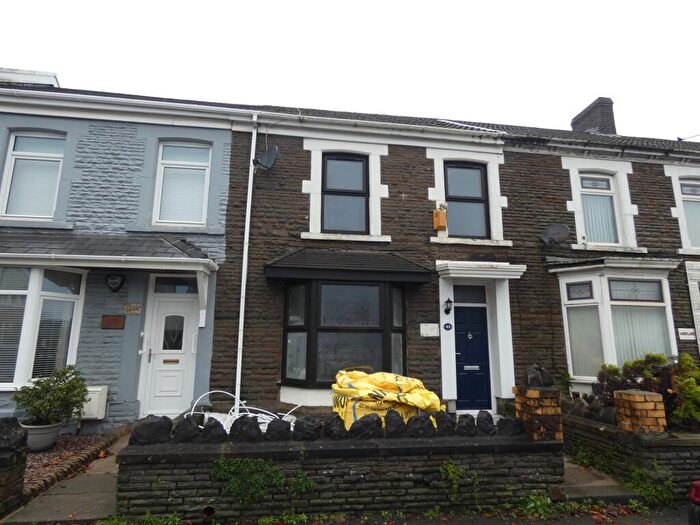
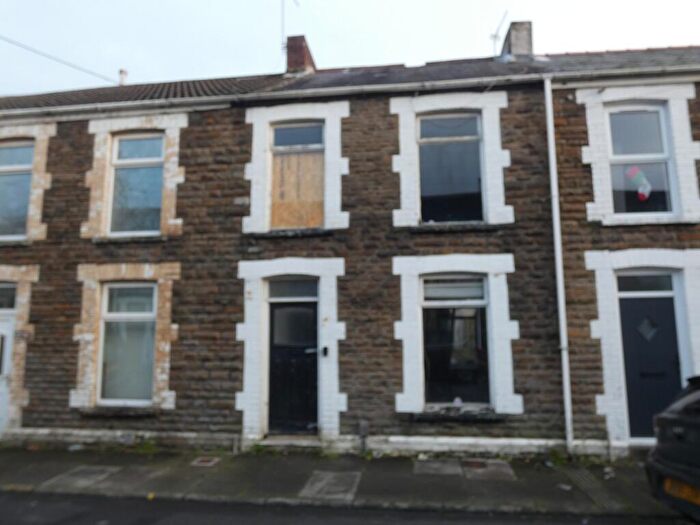
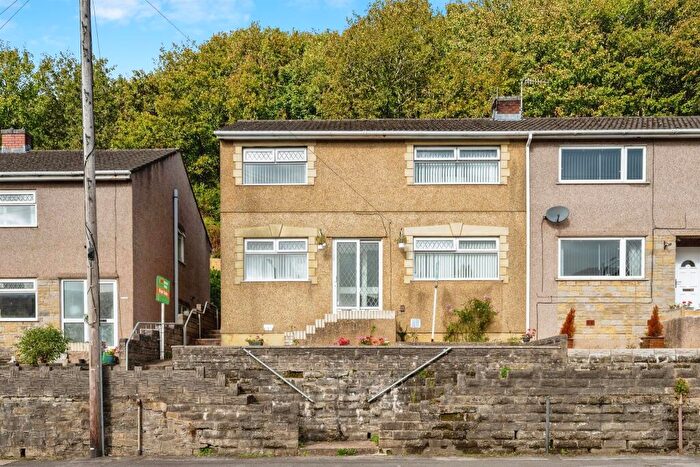
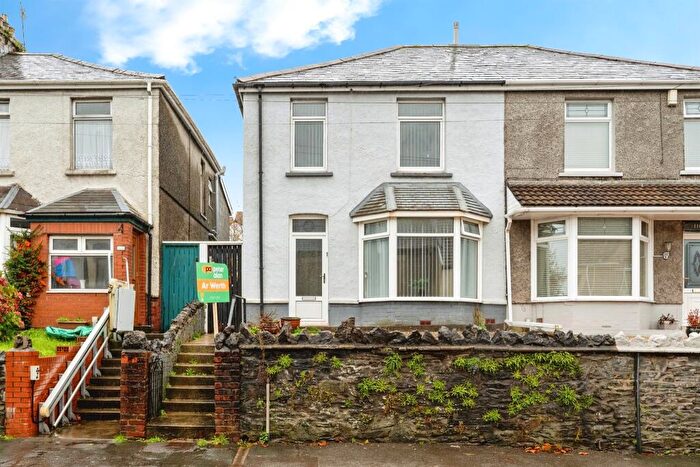
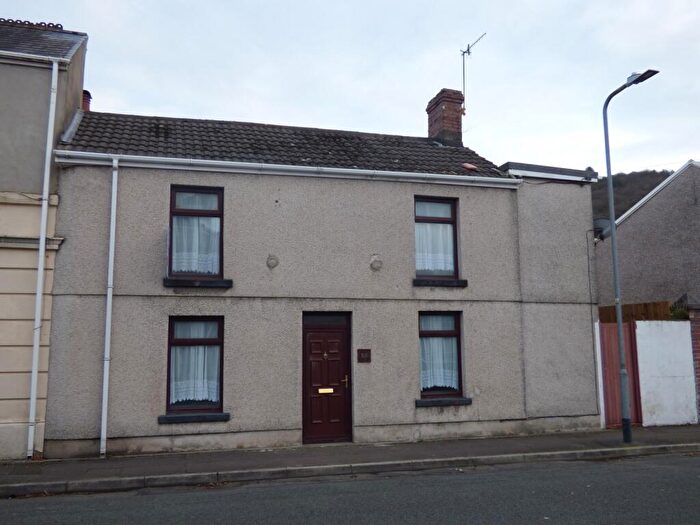
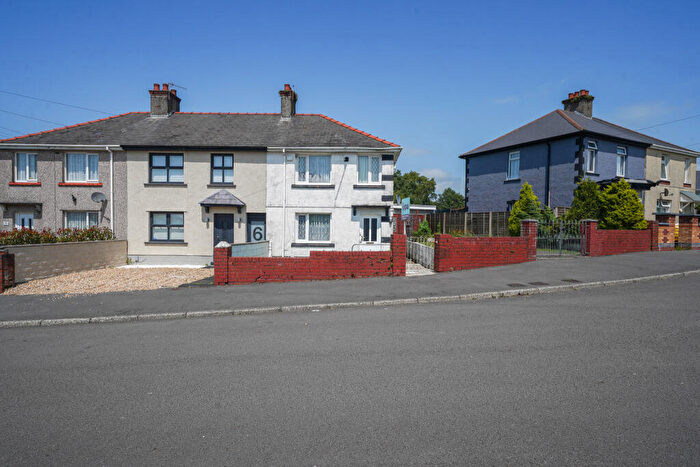
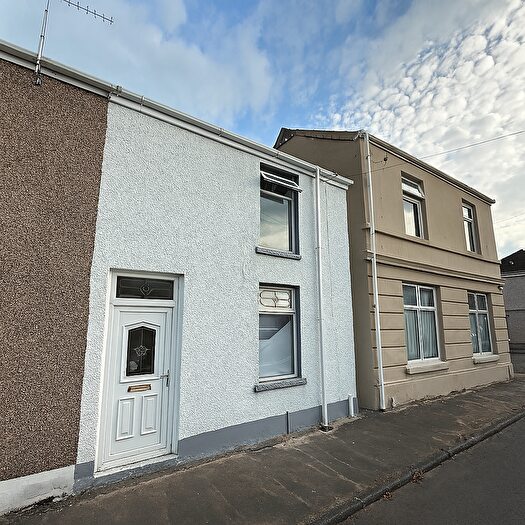
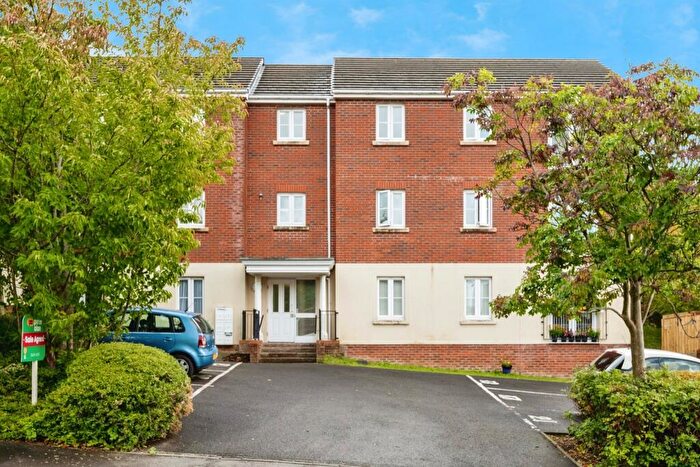
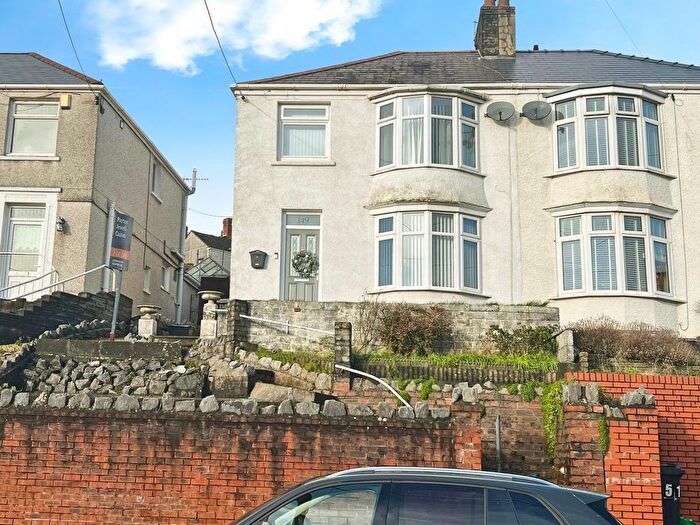
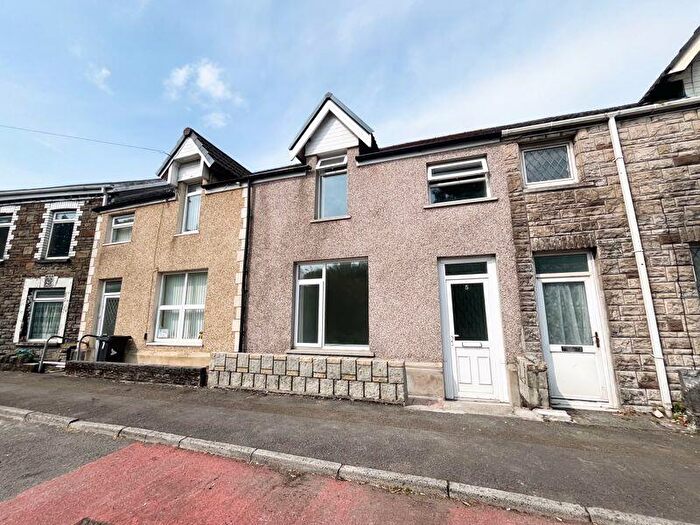
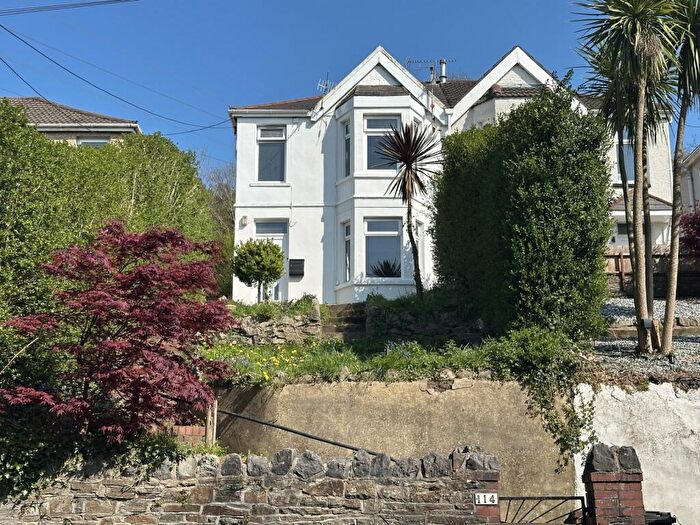
Houses for sale & to rent in Briton Ferry West, Neath
House Prices in Briton Ferry West
Properties in Briton Ferry West have an average house price of £121,067.00 and had 140 Property Transactions within the last 3 years¹.
Briton Ferry West is an area in Neath, Castell-nedd Port Talbot - Neath Port Talbot with 1,240 households², where the most expensive property was sold for £590,000.00.
Properties for sale in Briton Ferry West
Roads and Postcodes in Briton Ferry West
Navigate through our locations to find the location of your next house in Briton Ferry West, Neath for sale or to rent.
| Streets | Postcodes |
|---|---|
| Baglan Energy Park | SA11 2GA |
| Barn Cottages | SA11 2NH |
| Briton Ferry Industrial Estate | SA11 2HZ |
| Brunel Way | SA11 2FP SA11 2GG |
| Bryn Teg | SA11 2YG SA11 2YH |
| Brynhyfryd Road | SA11 2HT SA11 2LE |
| Carlyle Street | SA11 2LB |
| Church Street | SA11 2JD SA11 2JG SA11 2JQ SA11 2HJ SA11 2JB SA11 2JP |
| Elm Road | SA11 2LY |
| Elmwood Drive | SA11 2NF |
| Georges Row | SA11 2JT |
| Gethin Street | SA11 2LU |
| Giants Grave Road | SA11 2LH SA11 2LN SA11 2LS SA11 2LW SA11 2ND |
| Giants Wharf | SA11 2LP |
| Glanymor Street | SA11 2LF SA11 2LG |
| Herne Street | SA11 2PY |
| Highfield Road | SA11 2LL |
| Jack Y Ddu Road | SA11 2LT |
| Jersey Terrace | SA11 2RD |
| Kennel Row | SA11 2JE |
| Llansawel Crescent | SA11 2UL SA11 2UN SA11 2UW |
| Margaret Close | SA11 2PP |
| Olive Branch Crescent | SA11 2UF SA11 2UG SA11 2UH |
| Owens Row | SA11 2LR |
| Parc Newydd | SA11 2UP |
| Park View Close | SA11 2PX |
| Regent Street West | SA11 2PL SA11 2PN SA11 2RF SA11 2JA |
| Ruskin Street | SA11 2HU SA11 2HY SA11 2LA SA11 2LD |
| Shelone Road | SA11 2NE SA11 2NG SA11 2PR SA11 2PS SA11 2PT SA11 2PU SA11 2PW |
| Shelone Terrace | SA11 2UE |
| St Marys Close | SA11 2JU |
| Vernon Place | SA11 2JJ |
| Victoria Street | SA11 2RA SA11 2RB SA11 2RE |
| Warren Hill | SA11 2JH |
| Wern Bank | SA11 2NA SA11 2NB |
| Wood View Close | SA11 2PZ |
Transport near Briton Ferry West
- FAQ
- Price Paid By Year
- Property Type Price
Frequently asked questions about Briton Ferry West
What is the average price for a property for sale in Briton Ferry West?
The average price for a property for sale in Briton Ferry West is £121,067. This amount is 27% lower than the average price in Neath. There are 870 property listings for sale in Briton Ferry West.
What streets have the most expensive properties for sale in Briton Ferry West?
The streets with the most expensive properties for sale in Briton Ferry West are St Marys Close at an average of £236,666, Barn Cottages at an average of £137,000 and Ruskin Street at an average of £130,416.
What streets have the most affordable properties for sale in Briton Ferry West?
The streets with the most affordable properties for sale in Briton Ferry West are Elm Road at an average of £96,150, Herne Street at an average of £98,300 and Llansawel Crescent at an average of £106,875.
Which train stations are available in or near Briton Ferry West?
Some of the train stations available in or near Briton Ferry West are Briton Ferry, Baglan and Neath.
Property Price Paid in Briton Ferry West by Year
The average sold property price by year was:
| Year | Average Sold Price | Price Change |
Sold Properties
|
|---|---|---|---|
| 2025 | £135,710 | 9% |
19 Properties |
| 2024 | £123,837 | 4% |
37 Properties |
| 2023 | £118,540 | 3% |
37 Properties |
| 2022 | £114,957 | 8% |
47 Properties |
| 2021 | £105,772 | 14% |
42 Properties |
| 2020 | £90,980 | 11% |
28 Properties |
| 2019 | £80,634 | 2% |
26 Properties |
| 2018 | £78,821 | 0,4% |
34 Properties |
| 2017 | £78,516 | 6% |
34 Properties |
| 2016 | £74,120 | 2% |
36 Properties |
| 2015 | £72,692 | 9% |
13 Properties |
| 2014 | £66,109 | -13% |
22 Properties |
| 2013 | £74,589 | 9% |
25 Properties |
| 2012 | £67,680 | -14% |
15 Properties |
| 2011 | £76,884 | 9% |
13 Properties |
| 2010 | £69,606 | -28% |
23 Properties |
| 2009 | £88,949 | 8% |
16 Properties |
| 2008 | £81,975 | -14% |
21 Properties |
| 2007 | £93,553 | 13% |
41 Properties |
| 2006 | £81,032 | 6% |
37 Properties |
| 2005 | £76,318 | 9% |
41 Properties |
| 2004 | £69,643 | 41% |
49 Properties |
| 2003 | £41,341 | 17% |
46 Properties |
| 2002 | £34,331 | 8% |
49 Properties |
| 2001 | £31,676 | -22% |
29 Properties |
| 2000 | £38,515 | 23% |
31 Properties |
| 1999 | £29,609 | 6% |
27 Properties |
| 1998 | £27,789 | 4% |
19 Properties |
| 1997 | £26,745 | -17% |
12 Properties |
| 1996 | £31,403 | 5% |
18 Properties |
| 1995 | £29,731 | - |
20 Properties |
Property Price per Property Type in Briton Ferry West
Here you can find historic sold price data in order to help with your property search.
The average Property Paid Price for specific property types in the last three years are:
| Property Type | Average Sold Price | Sold Properties |
|---|---|---|
| Semi Detached House | £123,793.00 | 58 Semi Detached Houses |
| Detached House | £172,500.00 | 7 Detached Houses |
| Terraced House | £114,159.00 | 75 Terraced Houses |

