
Houses for sale & to rent in SA8 3JQ, Cilybebyll, Rhos, Swansea
House Prices in SA8 3JQ, Cilybebyll, Rhos
Properties in SA8 3JQ have no sales history available within the last 3 years. SA8 3JQ is a postcode in Cilybebyll located in Rhos, an area in Swansea, Castell-nedd Port Talbot - Neath Port Talbot, with 1 household².
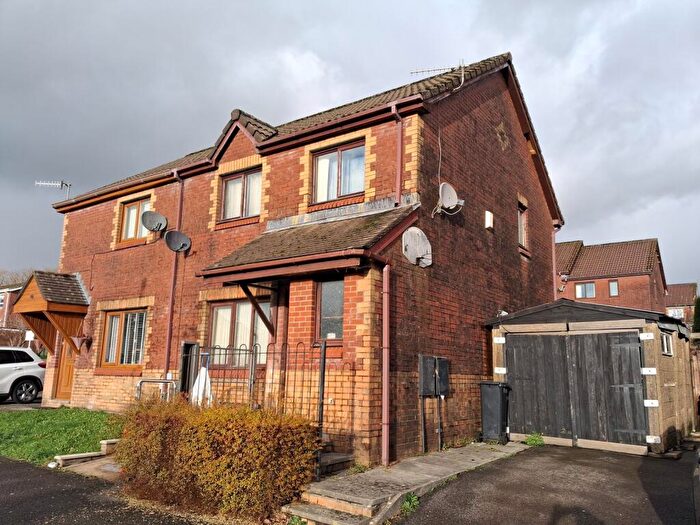
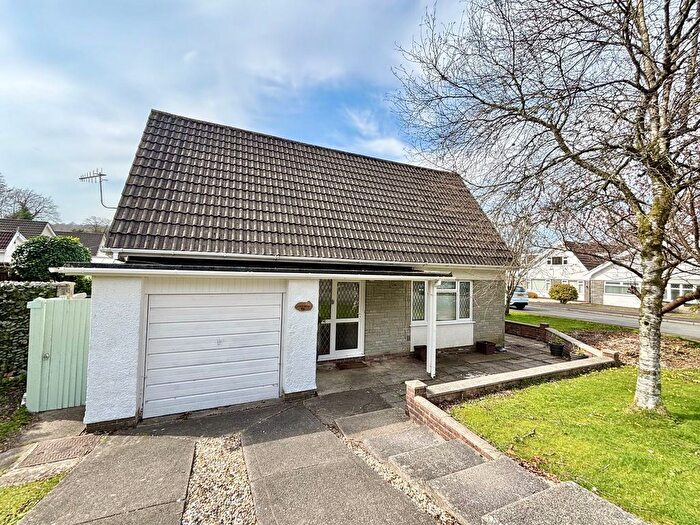
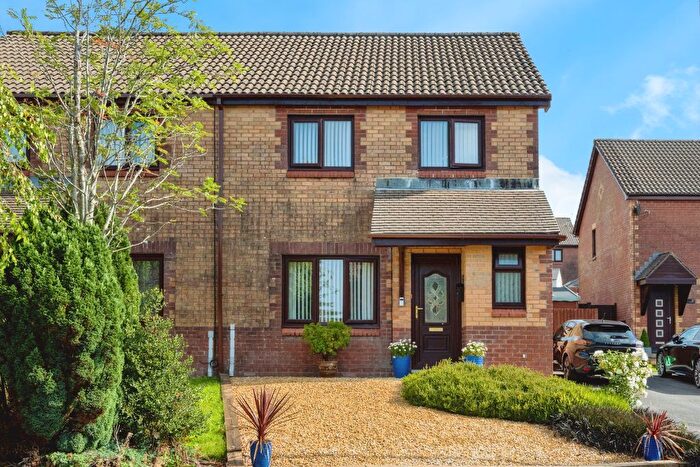
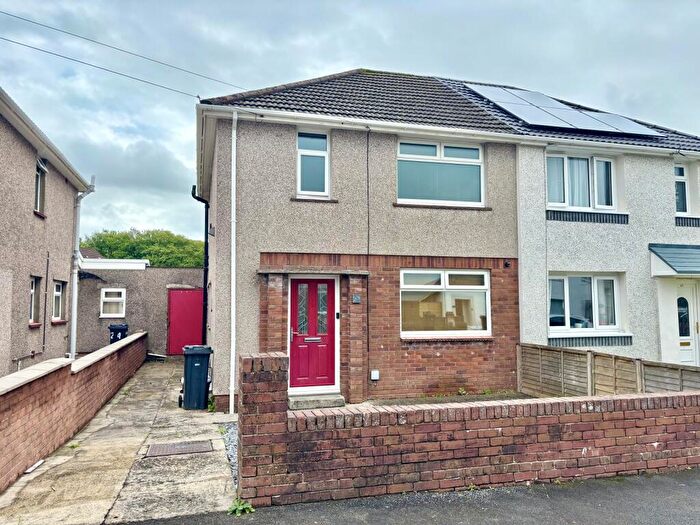
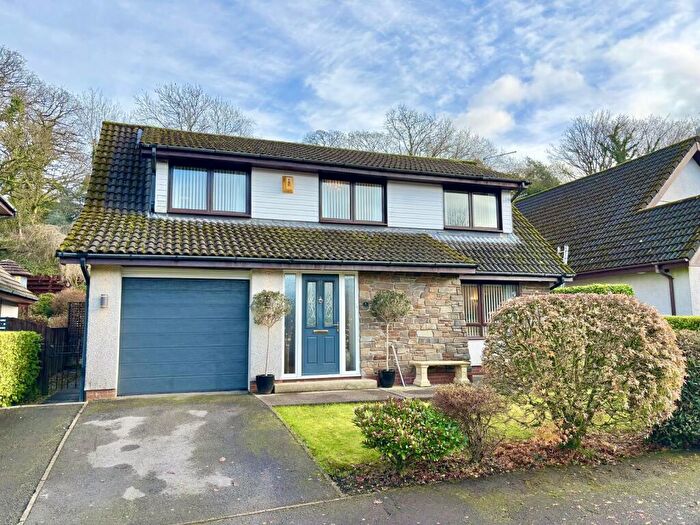
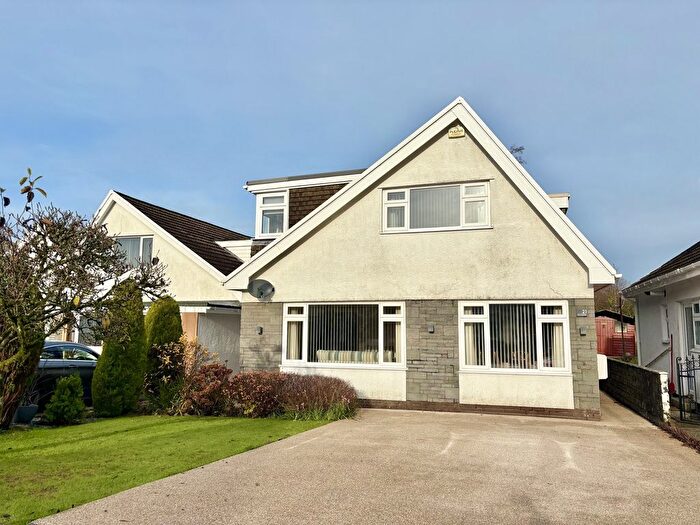
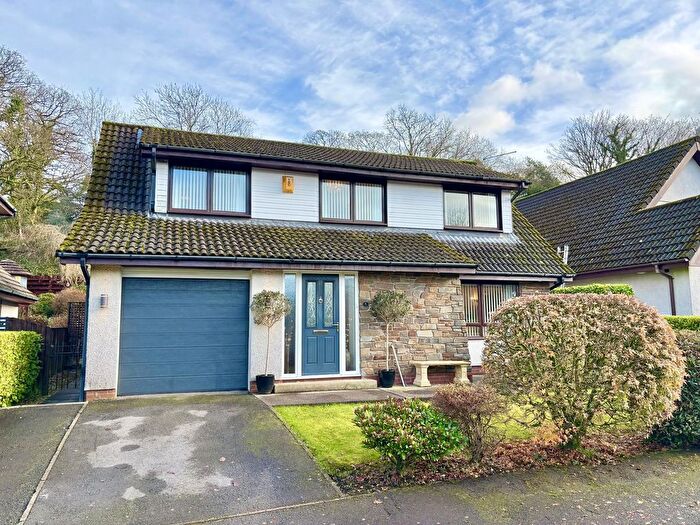
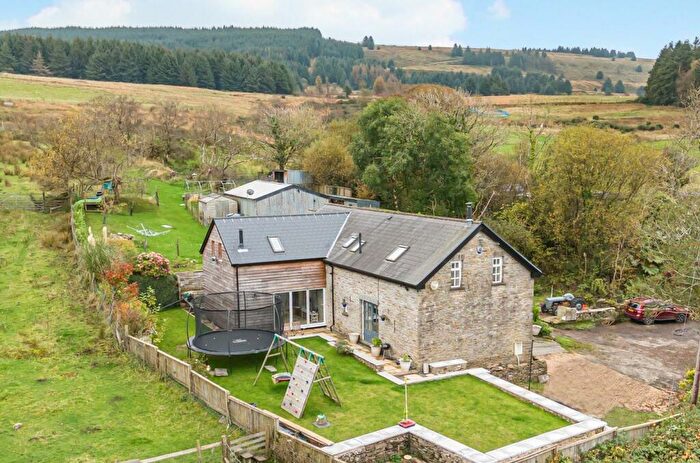
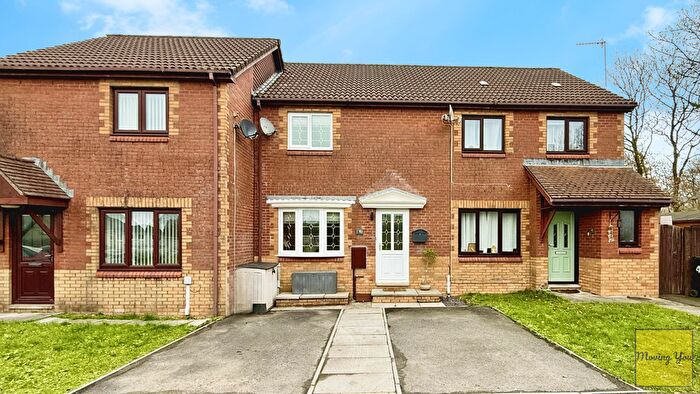
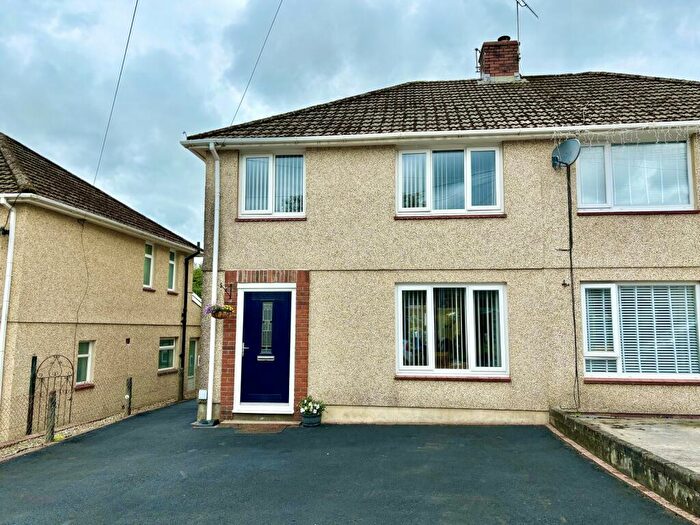
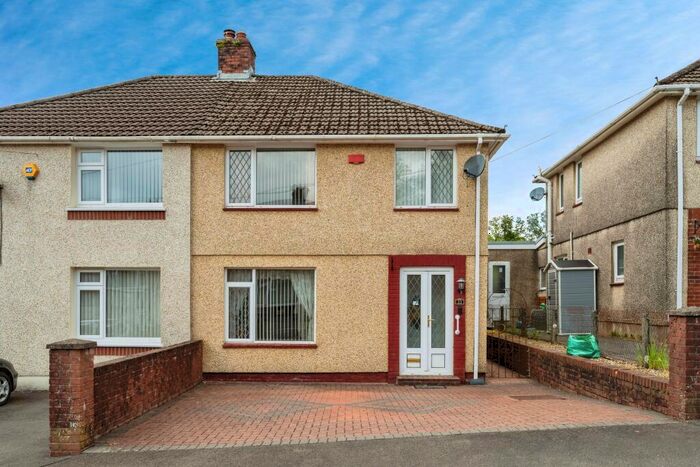
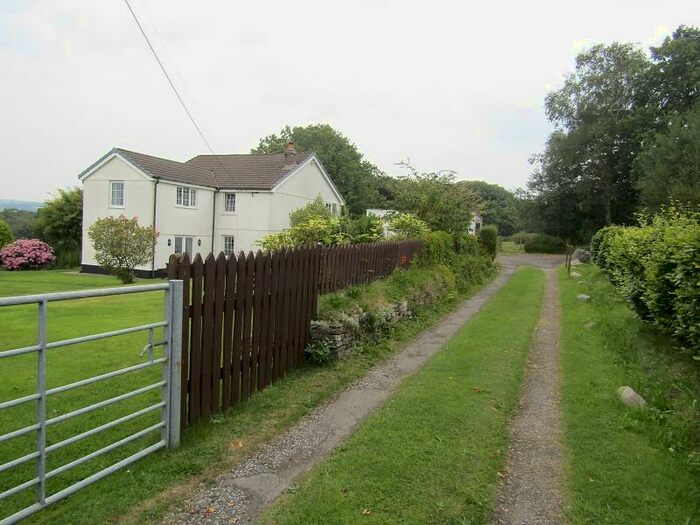
Previously listed properties near SA8 3JQ, Cilybebyll


![]()
If you are looking to sell your house, let it out, or receive a property valuation, an expert can help you.
Click the button below to get started.


Price Paid in Cilybebyll, SA8 3JQ, Rhos
PLAS CILYBEBYLL Cilybebyll, SA8 3JQ, Rhos Swansea
Property PLAS CILYBEBYLL has been sold 3 times. The last time it was sold was in 07/02/2020 and the sold price was £900,000.00.
This detached house, sold as a freehold on 07/02/2020, is a 781 sqm detached house with an EPC rating of E.
| Date | Price | Property Type | Tenure | Classification |
|---|---|---|---|---|
| 07/02/2020 | £900,000.00 | Detached House | freehold | Established Building |
| 12/08/2016 | £1,050,000.00 | Detached House | freehold | Established Building |
| 05/10/2001 | £475,000.00 | Detached House | freehold | Established Building |
THE LODGE Cilybebyll, SA8 3JQ, Rhos Swansea
Property THE LODGE has been sold 1 time. The last time it was sold was in 25/04/2003 and the sold price was £222,500.00.
This is a Detached House which was sold as a freehold in 25/04/2003
| Date | Price | Property Type | Tenure | Classification |
|---|---|---|---|---|
| 25/04/2003 | £222,500.00 | Detached House | freehold | Established Building |
Postcodes in Cilybebyll, Rhos
Navigate through other locations in Cilybebyll, Rhos, Swansea to see more property listings for sale or to rent.
Transport near SA8 3JQ, Cilybebyll
-
 Neath Station
 -
Skewen Station
-
Llansamlet Station
-
Briton Ferry Station
-
Baglan Station
-
Swansea Station
-
Pantyffynnon Station
-
Port Talbot Parkway Station
-
Ammanford Station
-
Pontarddulais Station
House price paid reports for SA8 3JQ, Cilybebyll
Click on the buttons below to see price paid reports by year or property price:
- Price Paid By Year
Property Price Paid in SA8 3JQ, Cilybebyll by Year
The average sold property price by year was:
| Year | Average Sold Price | Price Change |
Sold Properties
|
|---|---|---|---|
| 2020 | £900,000 | -17% |
1 Property |
| 2016 | £1,050,000 | 79% |
1 Property |
| 2003 | £222,500 | -113% |
1 Property |
| 2001 | £475,000 | - |
1 Property |