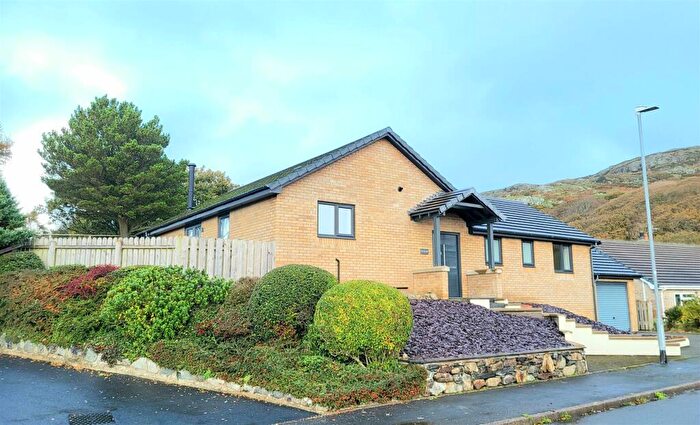
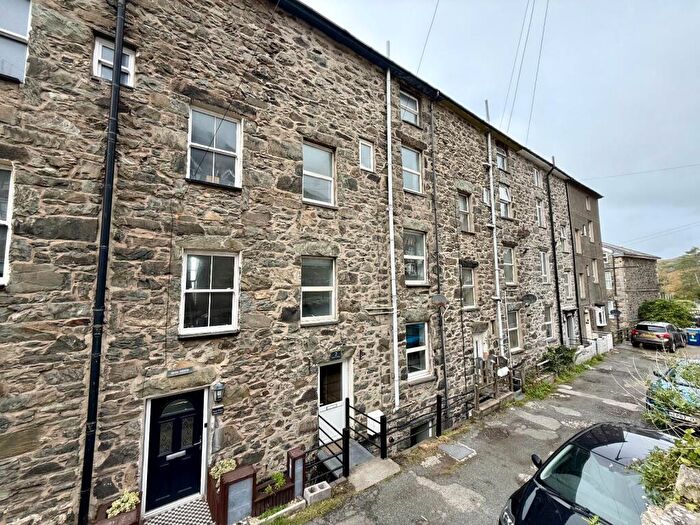
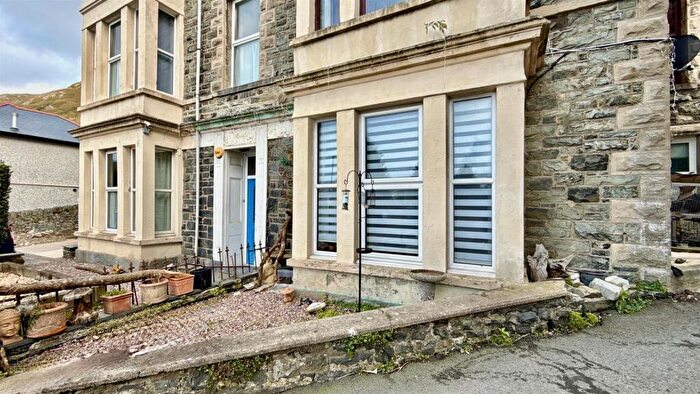
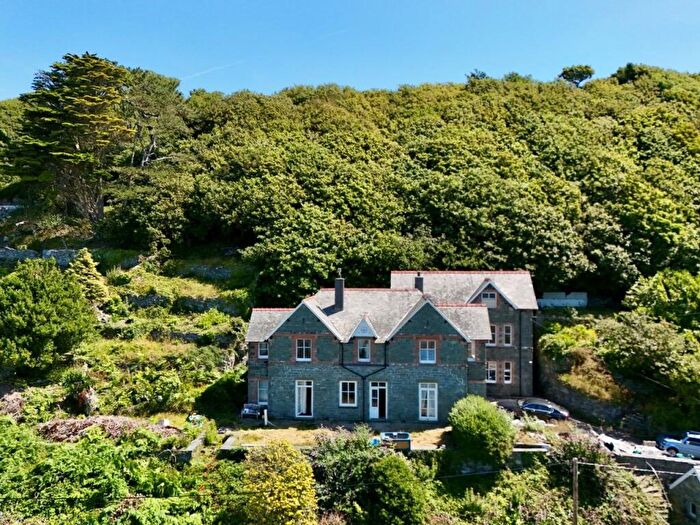
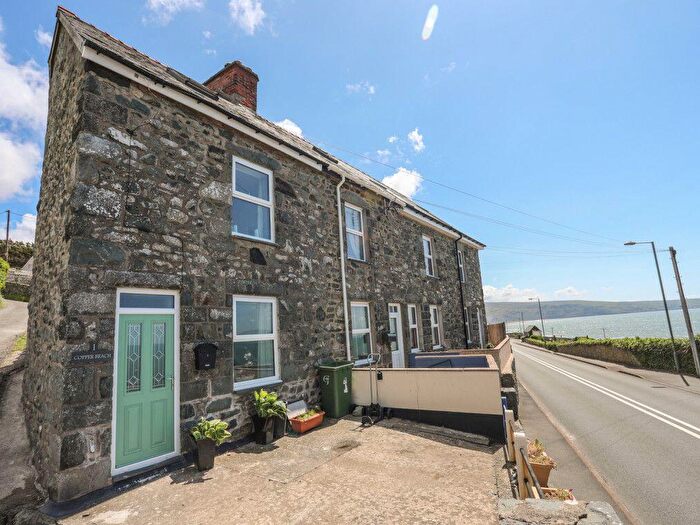
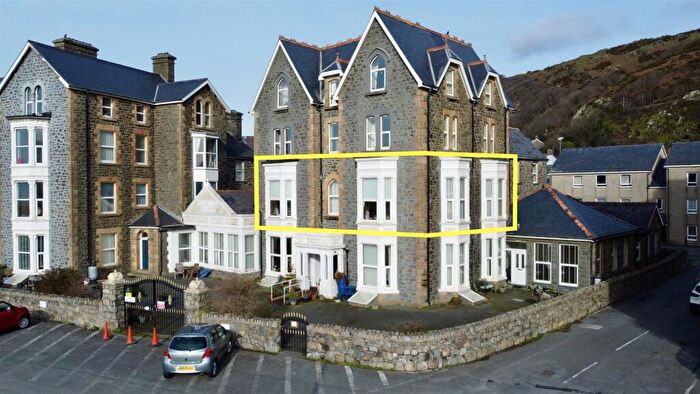
Houses for sale & to rent in Abermaw, Barmouth
House Prices in Abermaw
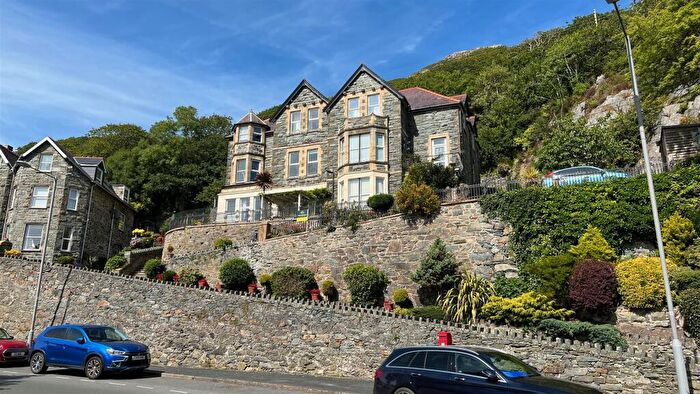
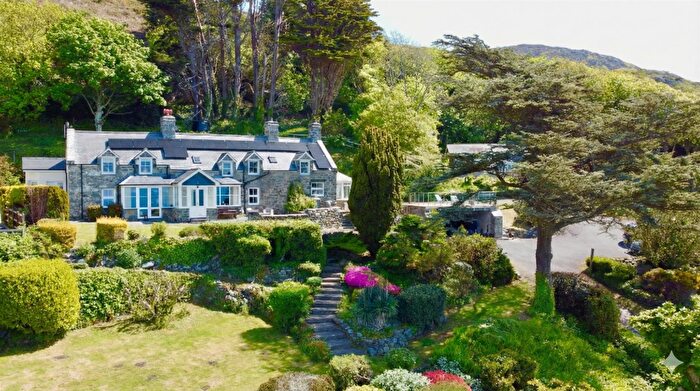
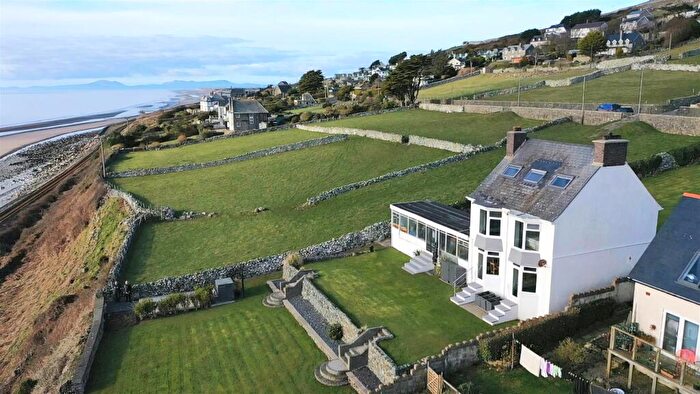
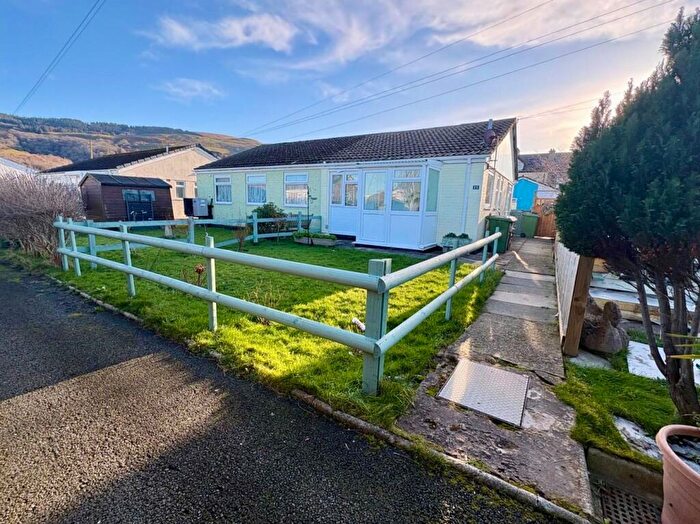
Properties in Abermaw have an average house price of £237,449.00 and had 140 Property Transactions within the last 3 years¹.
Abermaw is an area in Barmouth, Gwynedd - Gwynedd with 1,250 households², where the most expensive property was sold for £1,900,000.00.
Properties for sale in Abermaw
Roads and Postcodes in Abermaw
Navigate through our locations to find the location of your next house in Abermaw, Barmouth for sale or to rent.
| Streets | Postcodes |
|---|---|
| Aberamffra Road | LL42 1SU |
| Aberamffra Terrace | LL42 1TD |
| Abermaw Terrace | LL42 1HA |
| Aelfor Terrace | LL42 1PD |
| Alley Fach | LL42 1PG |
| Beach Road | LL42 1LP LL42 1LS |
| Bennar Lane | LL42 1BU |
| Bennar Terrace | LL42 1BT |
| Blomfontein Terrace | LL42 1PP |
| Borthwen Terrace | LL42 1TB |
| Bron Aber Terrace | LL42 1EU |
| Bryn Awel Terrace | LL42 1DE |
| Bryn Mynach Road | LL42 1PS |
| Cae Roger | LL42 1HD |
| Cambrian Street | LL42 1BE LL42 1BG |
| Church Road | LL42 1AG |
| Church Street | LL42 1EH LL42 1EL LL42 1EW LL42 1EG |
| Cumberland Place | LL42 1ES |
| Dinas Oleu Road | LL42 1AY LL42 1AU |
| Doctors Buildings | LL42 1BD |
| Epworth Terrace | LL42 1PN |
| Ffordd Bro Mynach | LL42 1LZ |
| Ffordd Llwyn Mynach | LL42 1PA |
| Ffordd Pentre Mynach | LL42 1EN |
| Ffridd Elin | LL42 1YA |
| Fron Oleu Terrace | LL42 1YU |
| Fron Oleu Villas | LL42 1YY |
| Gellfechan Road | LL42 1AL |
| Gibraltar Lane | LL42 1BS LL42 1BY LL42 1DB |
| Glasfor Terrace | LL42 1PF |
| Gloddfa Road | LL42 1BH |
| Handlith Terrace | LL42 1RD |
| Harbour Lane | LL42 1ER |
| Hendre Villas | LL42 1PW |
| Heol Idris | LL42 1HU |
| Heol Llewelyn | LL42 1LF |
| Heol Meirion | LL42 1LA |
| Heol Y Llan | LL42 1LB LL42 1LD |
| Heol Y Sarn | LL42 1HY |
| High Street | LL42 1AR LL42 1DL LL42 1DP LL42 1DS LL42 1DU LL42 1DW LL42 1DR |
| Jubilee Road | LL42 1EE LL42 1EF LL42 1LR LL42 1LT |
| King Edward Street | LL42 1AN LL42 1NY LL42 1PE LL42 1AB LL42 1AW |
| Kings Crescent | LL42 1RB |
| Llanaber Road | LL42 1RF LL42 1RN LL42 1YF LL42 1YG LL42 1YP LL42 1YH LL42 1YN LL42 1YR |
| Llys Dedwydd | LL42 1HP |
| Marine Gardens | LL42 1HL |
| Marine Parade | LL42 1NA LL42 1NB LL42 1NE |
| Marine Place | LL42 1HF |
| Marine Road | LL42 1HG LL42 1NL LL42 1NR LL42 1NS LL42 1NW LL42 1ND |
| Mynach Road | LL42 1RL |
| North Avenue | LL42 1NP LL42 1NQ |
| North Promenade | LL42 1BJ |
| Northfield Road | LL42 1PT LL42 1PY |
| Panorama Road | LL42 1DQ LL42 1DJ |
| Park Road | LL42 1PH LL42 1PL LL42 1RW LL42 1AP |
| Pavilion Buildings | LL42 1LY |
| Pentre Bach | LL42 1HT |
| Porkington Terrace | LL42 1LX |
| Princes Avenue | LL42 1HH |
| Seaview Terrace | LL42 1BA |
| South Avenue | LL42 1NH |
| St Annes Square | LL42 1AS LL42 1DF |
| St Georges | LL42 1BN |
| St Georges Lane | LL42 1BW LL42 1ED LL42 1BP |
| St Johns Hill | LL42 1AE LL42 1AF |
| Station Approach | LL42 1LU |
| Swn Y Dail | LL42 1DT |
| The Arches | LL42 1AD |
| The Promenade | LL42 1BX LL42 1HW LL42 1HX LL42 1NF LL42 1NG |
| The Quay | LL42 1ET LL42 1HB LL42 1EY |
| Victoria Place | LL42 1PR |
| Water Street | LL42 1AT |
| Wellington Terrace | LL42 1HR |
| LL42 1AJ LL42 1AQ LL42 1AZ LL42 1BL LL42 1DD LL42 1DZ LL42 1RE LL42 1RR LL42 1TE LL42 1TF LL42 1TG LL42 1TL LL42 1YS LL42 1YT LL42 1BQ LL42 1DN LL42 1DX LL42 1EP LL42 1EQ LL42 1HS LL42 1LE LL42 1LG LL42 1NN LL42 1TH LL42 1BF |
Transport near Abermaw
- FAQ
- Price Paid By Year
- Property Type Price
Frequently asked questions about Abermaw
What is the average price for a property for sale in Abermaw?
The average price for a property for sale in Abermaw is £237,449. This amount is 0.53% lower than the average price in Barmouth. There are 181 property listings for sale in Abermaw.
What streets have the most expensive properties for sale in Abermaw?
The streets with the most expensive properties for sale in Abermaw are Llanaber Road at an average of £613,500, Mynach Road at an average of £405,000 and Ffordd Bro Mynach at an average of £352,250.
What streets have the most affordable properties for sale in Abermaw?
The streets with the most affordable properties for sale in Abermaw are St Georges Lane at an average of £72,500, Pentre Bach at an average of £106,500 and St Johns Hill at an average of £112,500.
Which train stations are available in or near Abermaw?
Some of the train stations available in or near Abermaw are Barmouth, Llanaber and Morfa Mawddach.
Property Price Paid in Abermaw by Year
The average sold property price by year was:
| Year | Average Sold Price | Price Change |
Sold Properties
|
|---|---|---|---|
| 2025 | £208,019 | -0,2% |
39 Properties |
| 2024 | £208,376 | -34% |
43 Properties |
| 2023 | £278,793 | -3% |
58 Properties |
| 2022 | £287,283 | 17% |
51 Properties |
| 2021 | £237,673 | 23% |
62 Properties |
| 2020 | £183,070 | -14% |
51 Properties |
| 2019 | £208,073 | 26% |
62 Properties |
| 2018 | £154,310 | -5% |
83 Properties |
| 2017 | £162,564 | -10% |
45 Properties |
| 2016 | £178,282 | 21% |
58 Properties |
| 2015 | £140,403 | -16% |
48 Properties |
| 2014 | £162,932 | -1% |
49 Properties |
| 2013 | £164,940 | 10% |
43 Properties |
| 2012 | £148,619 | 2% |
28 Properties |
| 2011 | £145,932 | -6% |
37 Properties |
| 2010 | £154,865 | -1% |
43 Properties |
| 2009 | £156,683 | 1% |
40 Properties |
| 2008 | £154,353 | -4% |
44 Properties |
| 2007 | £159,852 | 9% |
49 Properties |
| 2006 | £145,491 | -6% |
60 Properties |
| 2005 | £154,283 | 12% |
43 Properties |
| 2004 | £136,239 | 29% |
29 Properties |
| 2003 | £96,465 | 17% |
44 Properties |
| 2002 | £80,513 | 18% |
68 Properties |
| 2001 | £66,220 | 3% |
59 Properties |
| 2000 | £63,952 | 5% |
54 Properties |
| 1999 | £60,763 | 14% |
51 Properties |
| 1998 | £52,226 | 3% |
36 Properties |
| 1997 | £50,816 | 17% |
30 Properties |
| 1996 | £42,112 | 1% |
35 Properties |
| 1995 | £41,854 | - |
24 Properties |
Property Price per Property Type in Abermaw
Here you can find historic sold price data in order to help with your property search.
The average Property Paid Price for specific property types in the last three years are:
| Property Type | Average Sold Price | Sold Properties |
|---|---|---|
| Semi Detached House | £234,622.00 | 20 Semi Detached Houses |
| Detached House | £491,333.00 | 30 Detached Houses |
| Terraced House | £183,633.00 | 36 Terraced Houses |
| Flat | £133,327.00 | 54 Flats |

