
Houses for sale & to rent in Llangelynin, Llwyngwril
House Prices in Llangelynin
Properties in Llangelynin have an average house price of £258,130.00 and had 44 Property Transactions within the last 3 years¹.
Llangelynin is an area in Llwyngwril, Gwynedd - Gwynedd with 248 households², where the most expensive property was sold for £700,000.00.
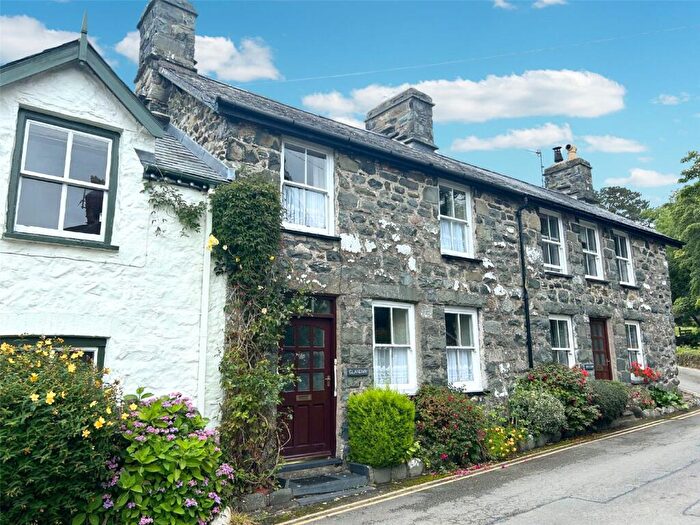
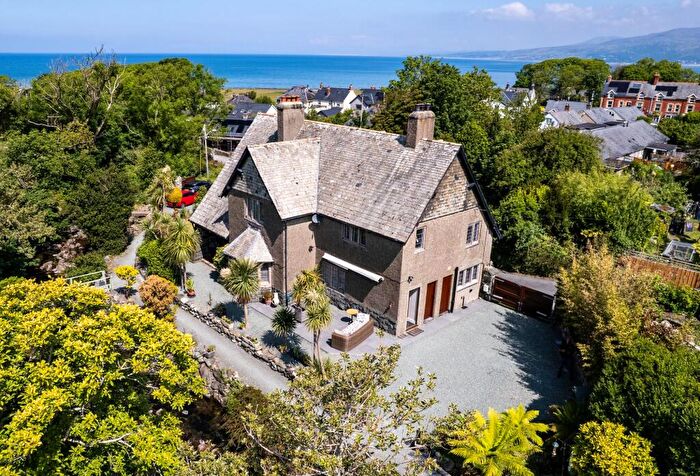
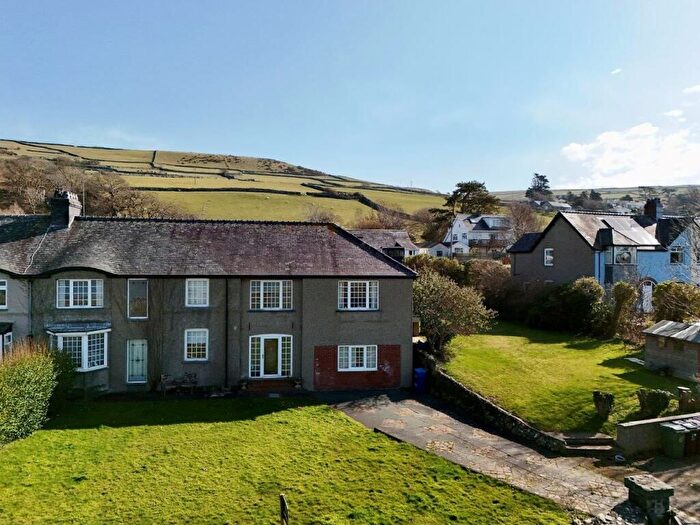
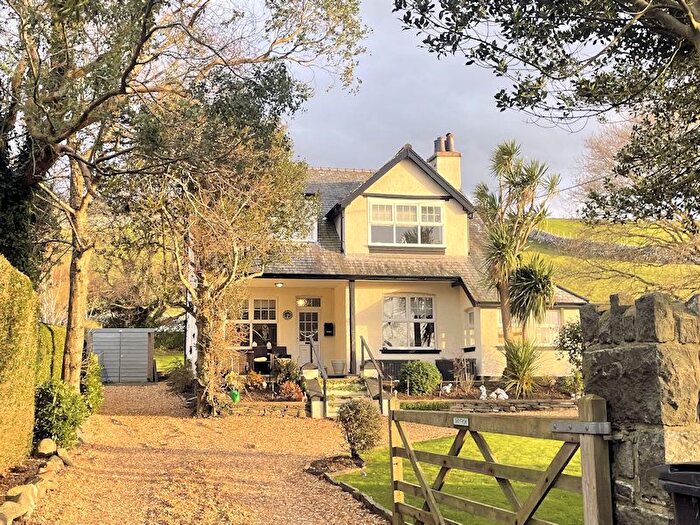
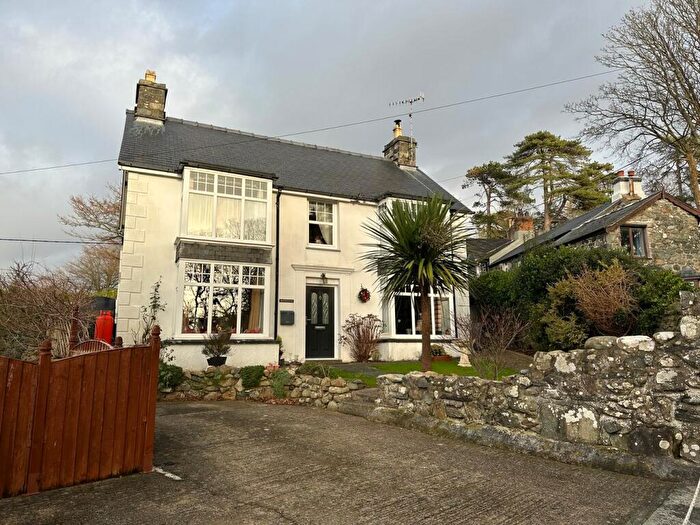
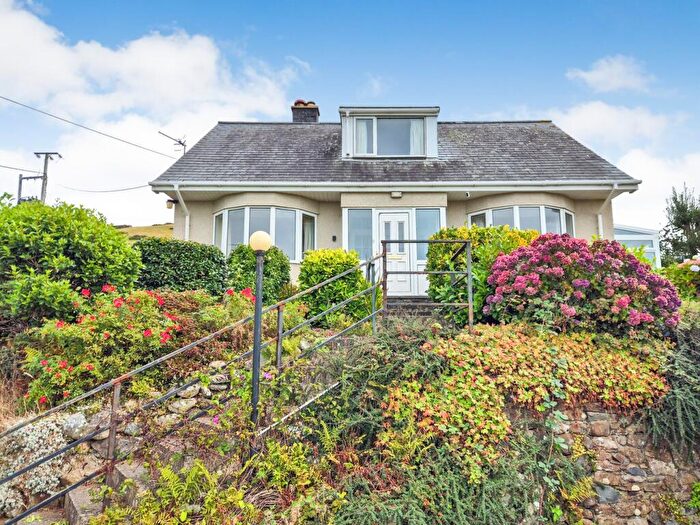
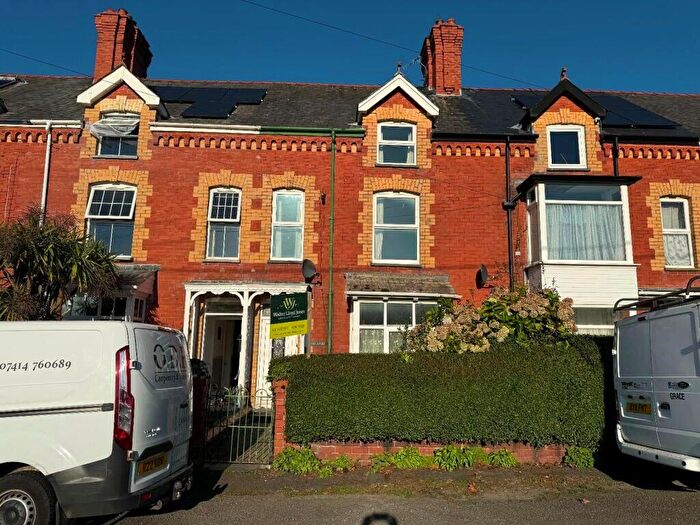
Properties for sale in Llangelynin

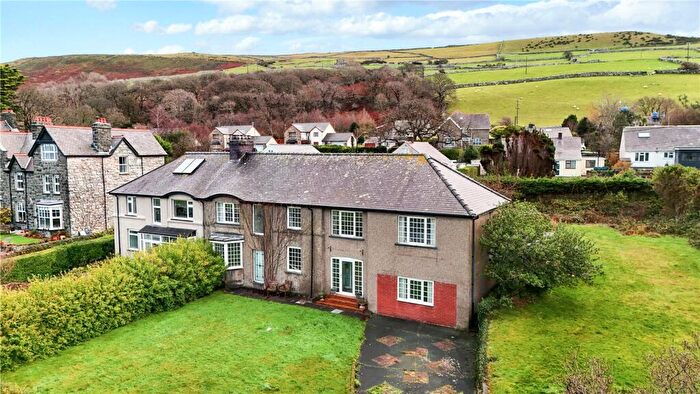

![]()
If you are looking to sell your house, let it out, or receive a property valuation, an expert can help you.
Click the button below to get started.
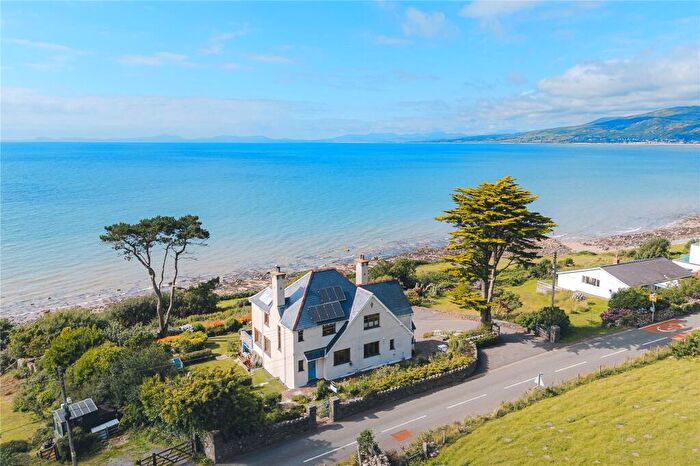
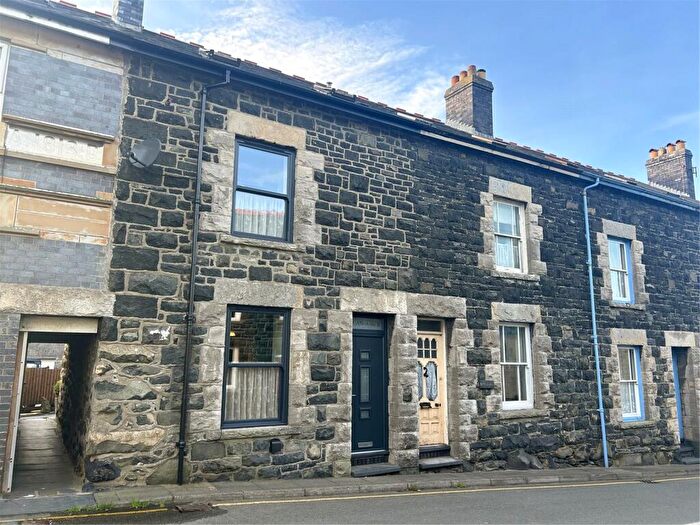
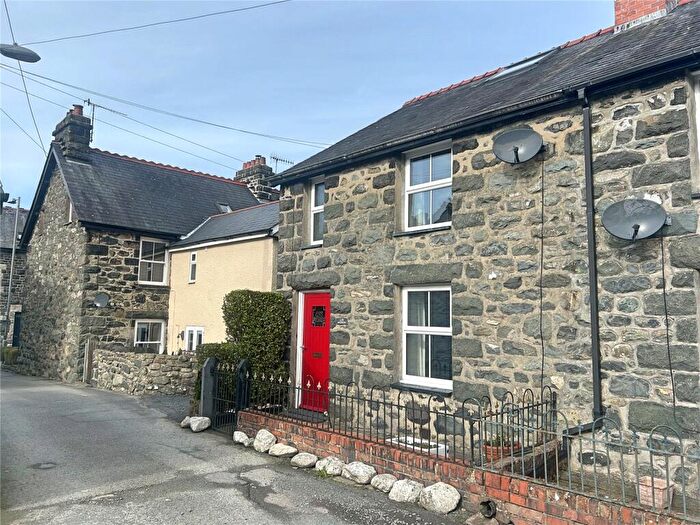
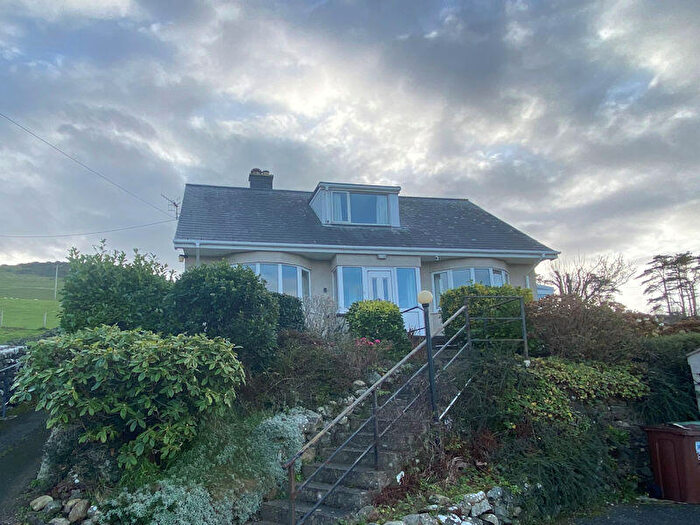
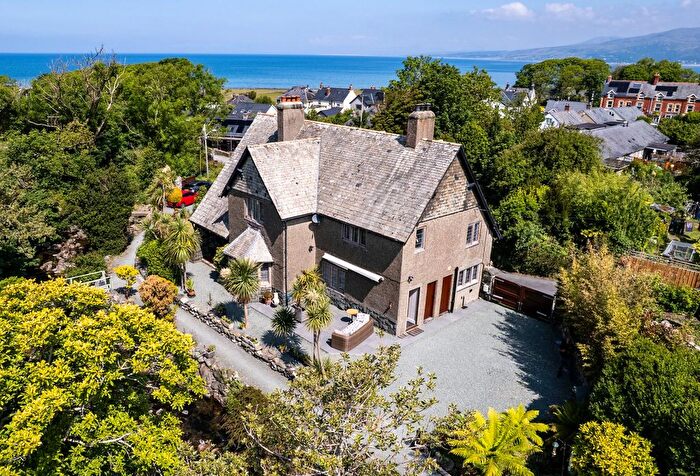
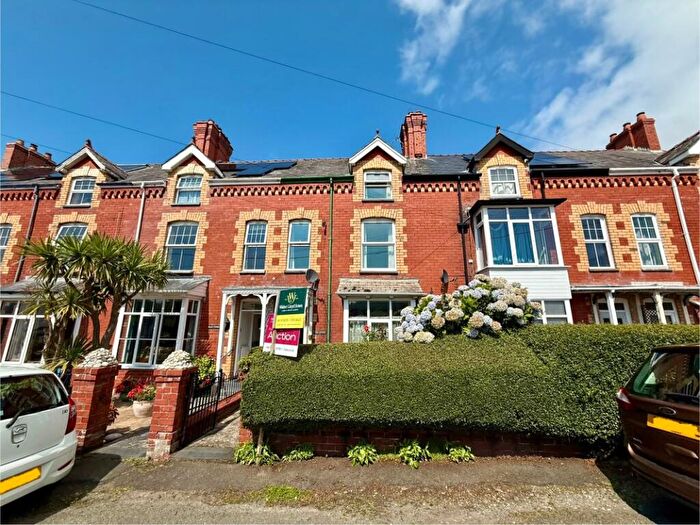
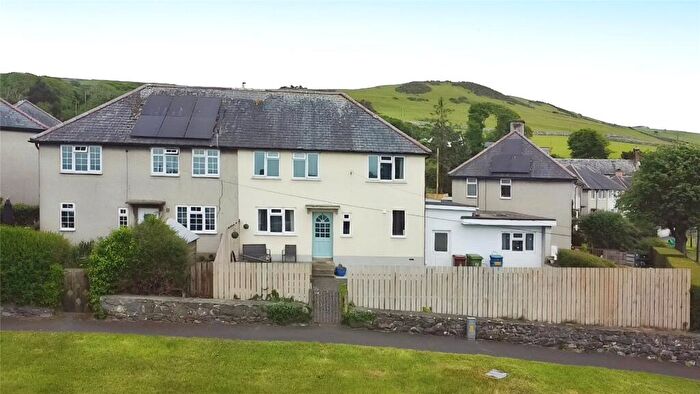
Previously listed properties in Llangelynin
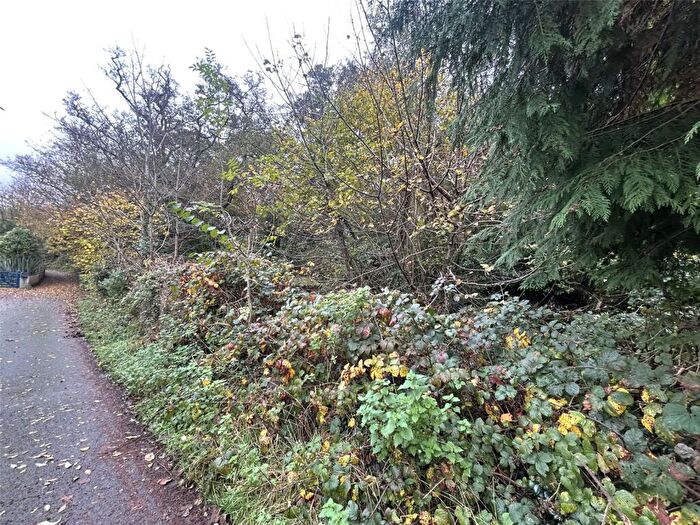
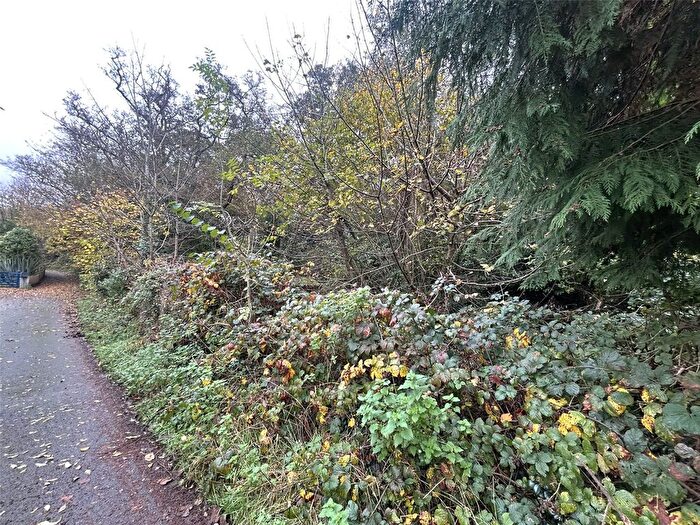
![]()
If you are looking to sell your house, let it out, or receive a property valuation, an expert can help you.
Click the button below to get started.
Roads and Postcodes in Llangelynin
Navigate through our locations to find the location of your next house in Llangelynin, Llwyngwril for sale or to rent.
| Streets | Postcodes |
|---|---|
| Ffordd Y Crynwyr | LL37 2JP |
| Godrer Gaer | LL37 2JZ |
| Meirion Terrace | LL37 2JR |
| Mill Street | LL37 2JA |
| Northern Terrace | LL37 2JX |
| Stad Gwastadgoed Isaf | LL37 2LA |
| Station Road | LL37 2JS |
| LL37 2JB LL37 2JD LL37 2JE LL37 2JG LL37 2JJ LL37 2JQ LL37 2JU LL37 2JY LL37 2QB LL37 2QD LL37 2QJ LL37 2QL LL37 2QR LL37 2QW LL37 2UJ LL37 2UX LL37 2UZ LL37 2YJ LL37 2YQ LL37 2YX LL37 2YZ LL37 2JF LL37 2JH LL37 2JL LL37 2JT LL37 2QA LL37 2QE LL37 2QF LL37 2QH LL37 2QN LL37 2QP LL37 2QQ LL37 2QS |
Transport near Llangelynin

- FAQ
- Price Paid By Year
- Property Type Price
Frequently asked questions about Llangelynin
What is the average price for a property for sale in Llangelynin?
The average price for a property for sale in Llangelynin is £258,130. There are 87 property listings for sale in Llangelynin.
What streets have the most expensive properties for sale in Llangelynin?
The streets with the most expensive properties for sale in Llangelynin are Stad Gwastadgoed Isaf at an average of £458,333 and Station Road at an average of £278,333.
What streets have the most affordable properties for sale in Llangelynin?
The street with the most affordable properties for sale in Llangelynin is Mill Street at an average of £167,500.
Which train stations are available in or near Llangelynin?
Some of the train stations available in or near Llangelynin are Llwyngwril, Fairbourne and Morfa Mawddach.
Property Price Paid in Llangelynin by Year
The average sold property price by year was:
| Year | Average Sold Price | Price Change |
Sold Properties
|
|---|---|---|---|
| 2025 | £190,250 | -42% |
4 Properties |
| 2024 | £269,288 | -1% |
13 Properties |
| 2023 | £271,681 | 6% |
11 Properties |
| 2022 | £256,718 | -18% |
16 Properties |
| 2021 | £302,038 | 22% |
13 Properties |
| 2020 | £234,426 | 26% |
13 Properties |
| 2019 | £173,447 | -25% |
19 Properties |
| 2018 | £216,728 | 1% |
18 Properties |
| 2017 | £214,944 | 21% |
18 Properties |
| 2016 | £169,071 | -28% |
14 Properties |
| 2015 | £217,142 | 19% |
14 Properties |
| 2014 | £175,154 | 6% |
11 Properties |
| 2013 | £164,888 | 7% |
9 Properties |
| 2012 | £152,613 | -79% |
11 Properties |
| 2011 | £273,875 | 34% |
4 Properties |
| 2010 | £179,500 | -4% |
12 Properties |
| 2009 | £186,333 | -22% |
14 Properties |
| 2008 | £227,857 | 24% |
7 Properties |
| 2007 | £174,142 | -4% |
14 Properties |
| 2006 | £181,209 | 3% |
15 Properties |
| 2005 | £176,418 | 9% |
13 Properties |
| 2004 | £160,200 | -4% |
10 Properties |
| 2003 | £166,041 | 12% |
12 Properties |
| 2002 | £146,340 | 37% |
11 Properties |
| 2001 | £92,750 | 17% |
17 Properties |
| 2000 | £76,763 | 21% |
19 Properties |
| 1999 | £60,564 | 21% |
14 Properties |
| 1998 | £47,840 | -5% |
11 Properties |
| 1997 | £50,230 | -2% |
15 Properties |
| 1996 | £51,392 | -0,2% |
14 Properties |
| 1995 | £51,500 | - |
10 Properties |
Property Price per Property Type in Llangelynin
Here you can find historic sold price data in order to help with your property search.
The average Property Paid Price for specific property types in the last three years are:
| Property Type | Average Sold Price | Sold Properties |
|---|---|---|
| Semi Detached House | £209,937.00 | 8 Semi Detached Houses |
| Detached House | £360,789.00 | 19 Detached Houses |
| Terraced House | £166,073.00 | 17 Terraced Houses |