
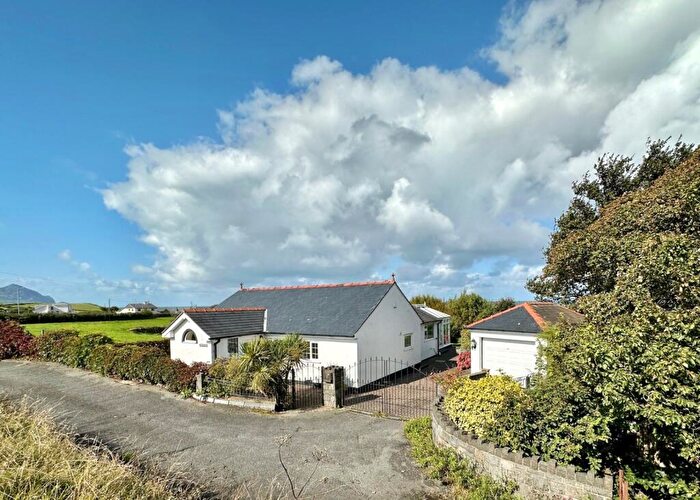
Houses for sale & to rent in Clynnog, Caernarfon
House Prices in Clynnog
Properties in Clynnog have an average house price of £250k and had 29 Property Transactions within the last 3 years¹.
Clynnog is an area in Caernarfon, Gwynedd - Gwynedd with 368 households², where the most expensive property was sold for £578k.
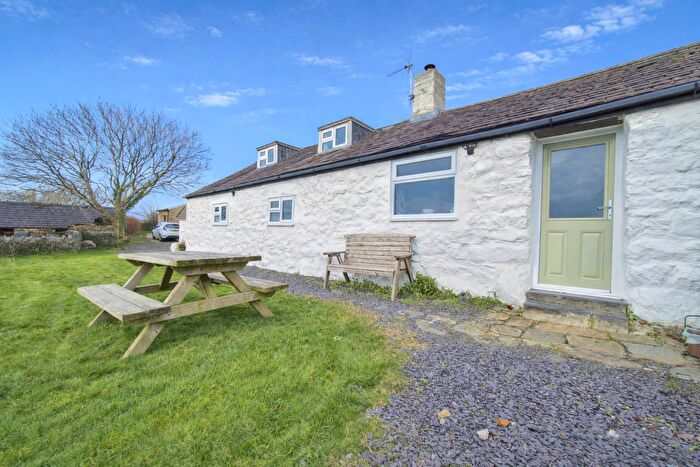
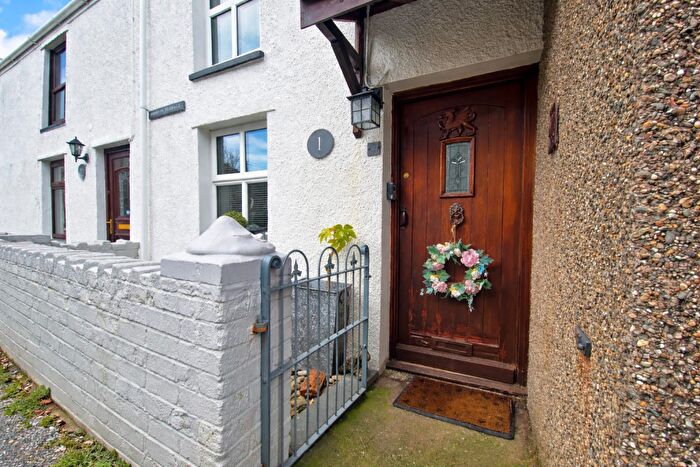
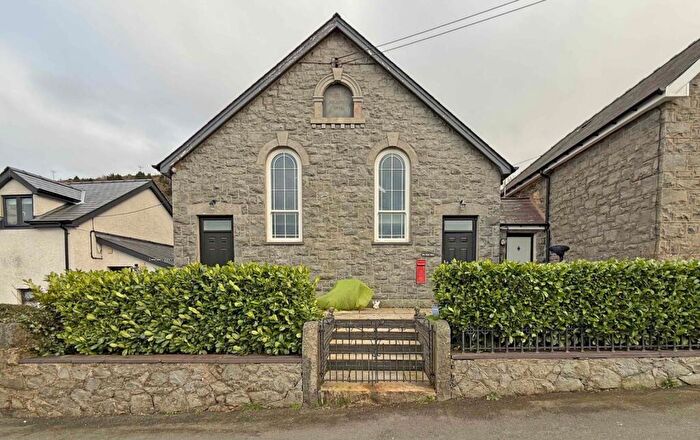
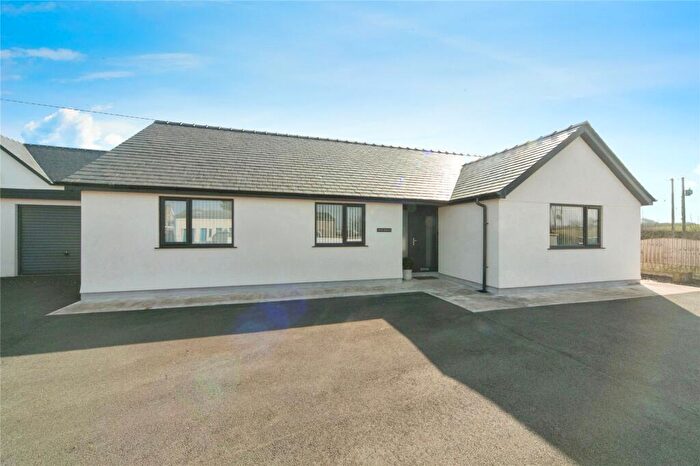
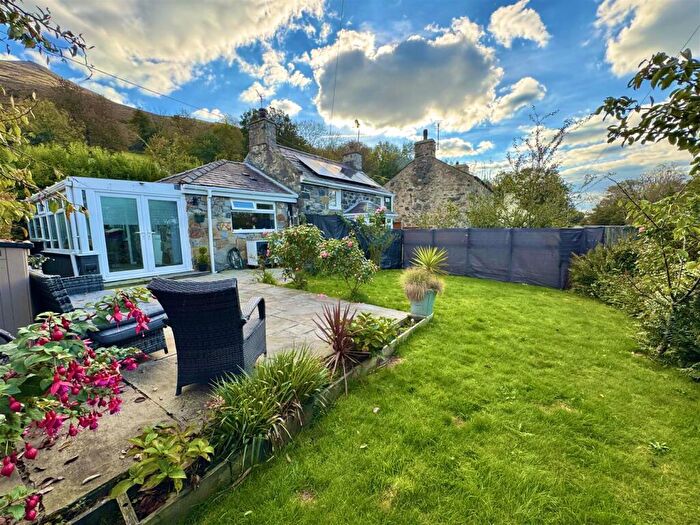
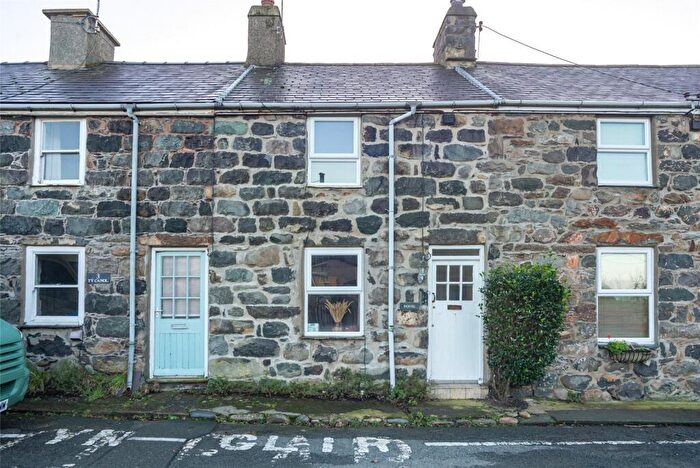
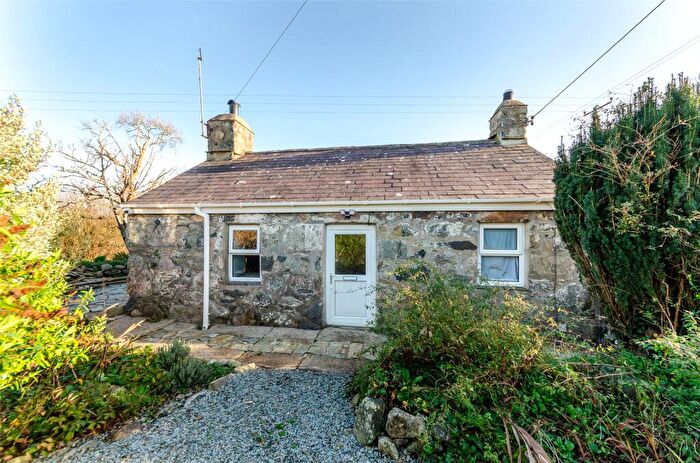
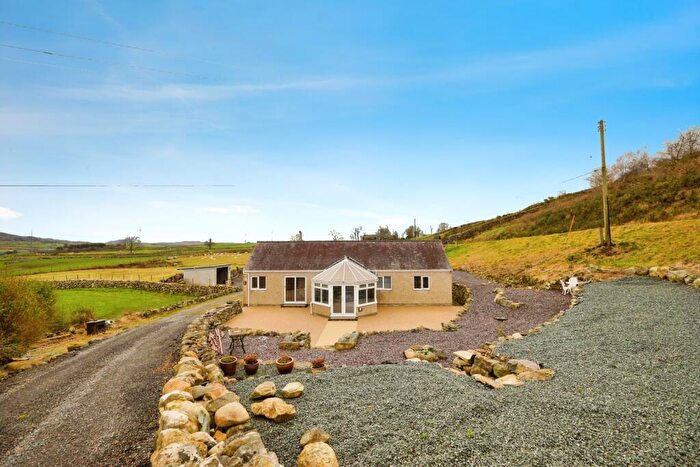
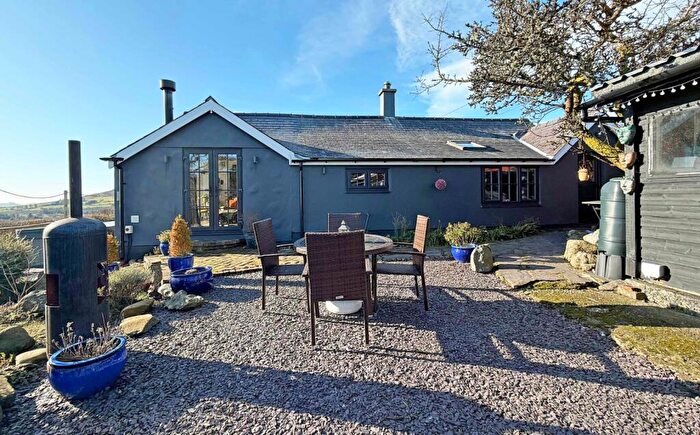
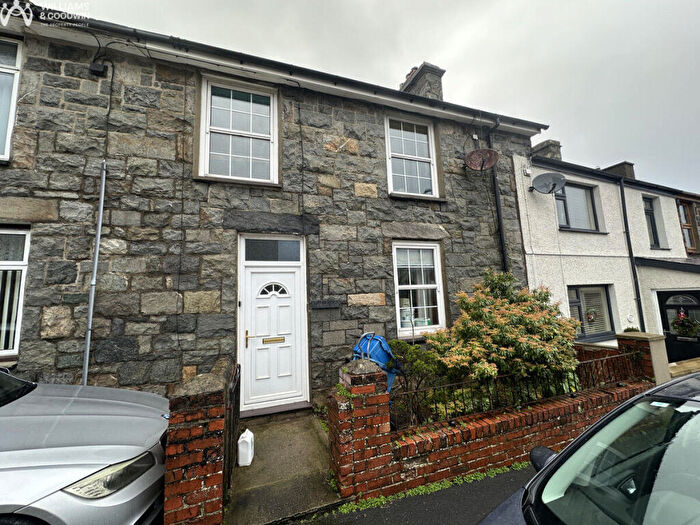
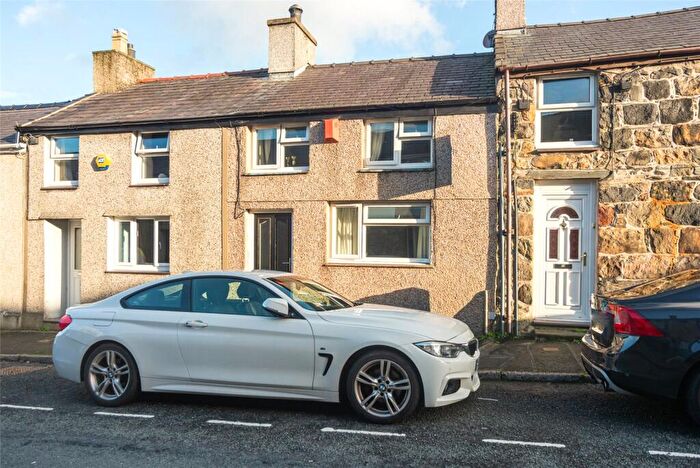
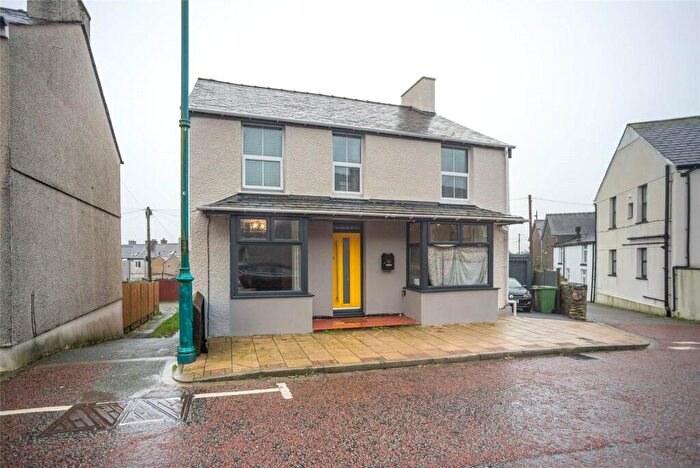
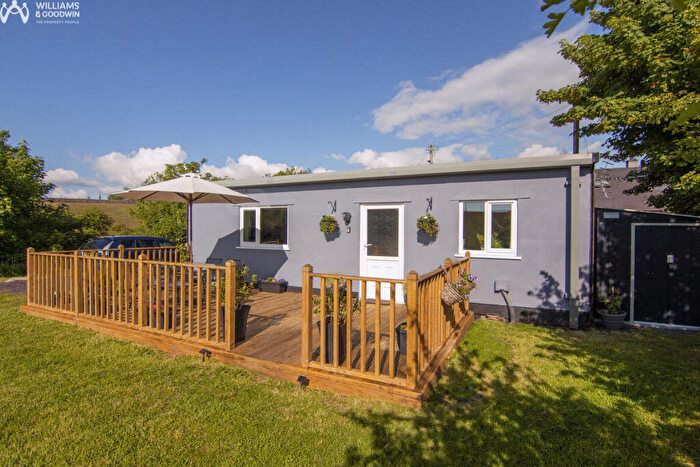
Properties for sale in Clynnog
![]()
If you are looking to sell your house, let it out, or receive a property valuation, an expert can help you.
Click the button below to get started.

Roads and Postcodes in Clynnog
Navigate through our locations to find the location of your next house in Clynnog, Caernarfon for sale or to rent.
| Streets | Postcodes |
|---|---|
| Capel Uchaf | LL54 5DH |
| Clynnog Road | LL54 5ED LL54 5EL |
| Garth Estate | LL54 5ET |
| Lleuar Terrace | LL54 5ES |
| Llwyn Beuno | LL54 5BW |
| Llwyn Y Ne | LL54 5BU |
| Llys Eben | LL54 5AQ |
| Newborough Terrace | LL54 5NL |
| Sportsman Row | LL54 5PH |
| St Beunos Court | LL54 5NP |
| Swan Terrace | LL54 5EE |
| Tainlon | LL54 5DE |
| LL54 5BP LL54 5BT LL54 5DA LL54 5DB LL54 5DF LL54 5DL LL54 5DW LL54 5EF LL54 5EG LL54 5EN LL54 5EP LL54 5ER LL54 5EU LL54 5EW LL54 5NG LL54 5NH LL54 5NR LL54 5NW LL54 5PE LL54 5PF LL54 5PL LL54 5PP LL54 5PR LL54 5PW LL54 6DS LL54 6SY LL54 5BS LL54 5DD LL54 5DG LL54 5DN LL54 5EH LL54 5EY LL54 5NN LL54 5NS LL54 5NT LL54 5PB LL54 5PD LL54 5PG LL54 5PN LL54 5EJ |
Transport near Clynnog

- FAQ
- Price Paid By Year
- Property Type Price
Frequently asked questions about Clynnog
What is the average price for a property for sale in Clynnog?
The average price for a property for sale in Clynnog is £250,202. This amount is 21% higher than the average price in Caernarfon. There are 267 property listings for sale in Clynnog.
What streets have the most expensive properties for sale in Clynnog?
The streets with the most expensive properties for sale in Clynnog are Capel Uchaf at an average of £525,000, Garth Estate at an average of £222,375 and Swan Terrace at an average of £190,500.
What streets have the most affordable properties for sale in Clynnog?
The streets with the most affordable properties for sale in Clynnog are Sportsman Row at an average of £125,000, Lleuar Terrace at an average of £155,000 and Llwyn Y Ne at an average of £155,953.
Which train stations are available in or near Clynnog?
Some of the train stations available in or near Clynnog are Penychain, Criccieth and Abererch.
Property Price Paid in Clynnog by Year
The average sold property price by year was:
| Year | Average Sold Price | Price Change |
Sold Properties
|
|---|---|---|---|
| 2025 | £285,000 | 22% |
6 Properties |
| 2024 | £221,280 | -19% |
12 Properties |
| 2023 | £262,772 | -9% |
11 Properties |
| 2022 | £285,886 | 22% |
23 Properties |
| 2021 | £222,449 | -13% |
10 Properties |
| 2020 | £250,359 | 23% |
11 Properties |
| 2019 | £192,411 | 8% |
21 Properties |
| 2018 | £176,562 | 9% |
8 Properties |
| 2017 | £161,401 | -11% |
12 Properties |
| 2016 | £179,368 | 20% |
8 Properties |
| 2015 | £143,523 | -4% |
19 Properties |
| 2014 | £148,812 | 28% |
8 Properties |
| 2013 | £107,583 | -41% |
6 Properties |
| 2012 | £151,555 | 8% |
9 Properties |
| 2011 | £139,750 | -19% |
8 Properties |
| 2010 | £166,235 | 14% |
8 Properties |
| 2009 | £142,666 | -9% |
6 Properties |
| 2008 | £156,150 | -29% |
10 Properties |
| 2007 | £201,200 | 12% |
10 Properties |
| 2006 | £177,663 | 36% |
15 Properties |
| 2005 | £113,129 | -5% |
9 Properties |
| 2004 | £118,630 | 6% |
13 Properties |
| 2003 | £111,919 | 28% |
17 Properties |
| 2002 | £80,796 | 32% |
25 Properties |
| 2001 | £55,035 | -26% |
14 Properties |
| 2000 | £69,460 | -19% |
14 Properties |
| 1999 | £82,500 | 21% |
10 Properties |
| 1998 | £65,153 | 35% |
13 Properties |
| 1997 | £42,363 | -54% |
11 Properties |
| 1996 | £65,211 | 7% |
9 Properties |
| 1995 | £60,857 | - |
7 Properties |
Property Price per Property Type in Clynnog
Here you can find historic sold price data in order to help with your property search.
The average Property Paid Price for specific property types in the last three years are:
| Property Type | Average Sold Price | Sold Properties |
|---|---|---|
| Semi Detached House | £182,976.00 | 6 Semi Detached Houses |
| Detached House | £302,611.00 | 18 Detached Houses |
| Terraced House | £142,200.00 | 5 Terraced Houses |