
Houses for sale & to rent in Caernarfon, Gwynedd - Gwynedd
House Prices in Caernarfon
Properties in Caernarfon have an average house price of £207k and had 1,070 Property Transactions within the last 3 years.¹
Caernarfon is an area in Gwynedd - Gwynedd with 14,089 households², where the most expensive property was sold for £840k.
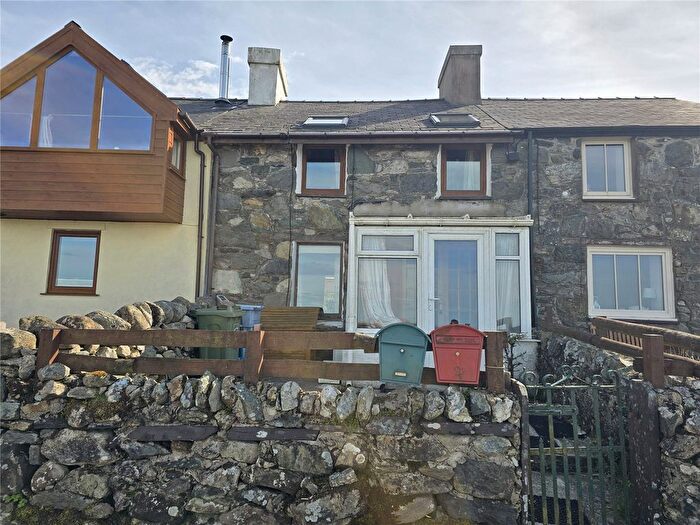
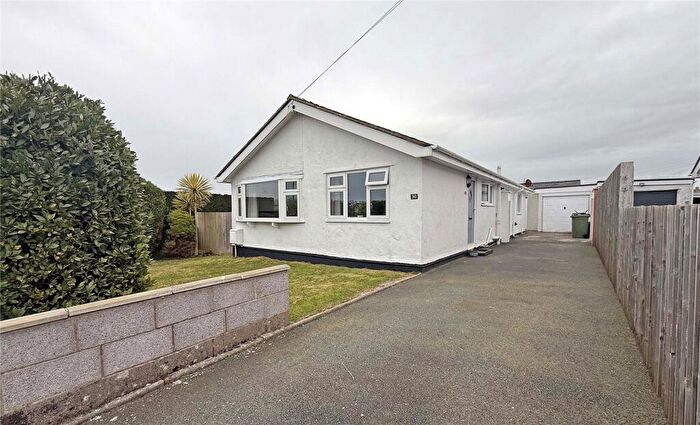
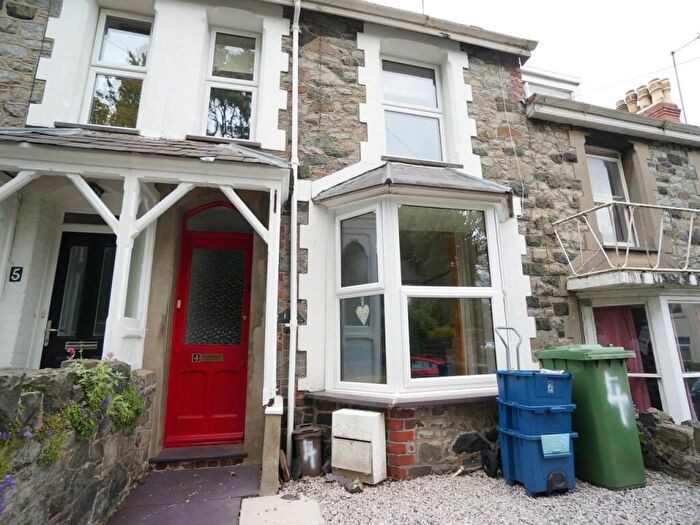
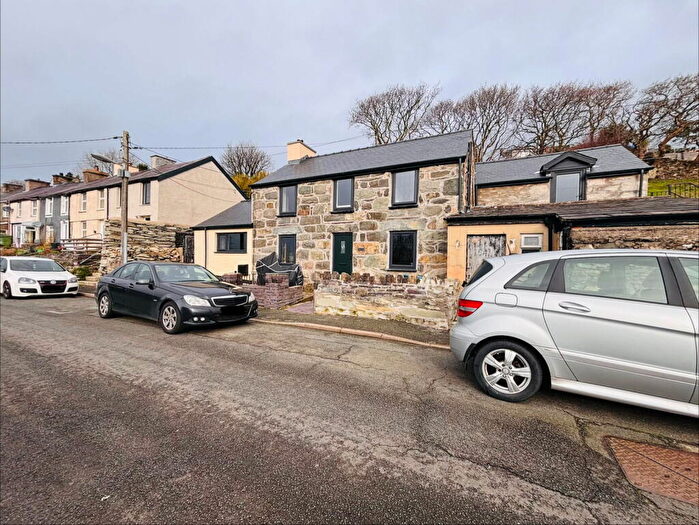
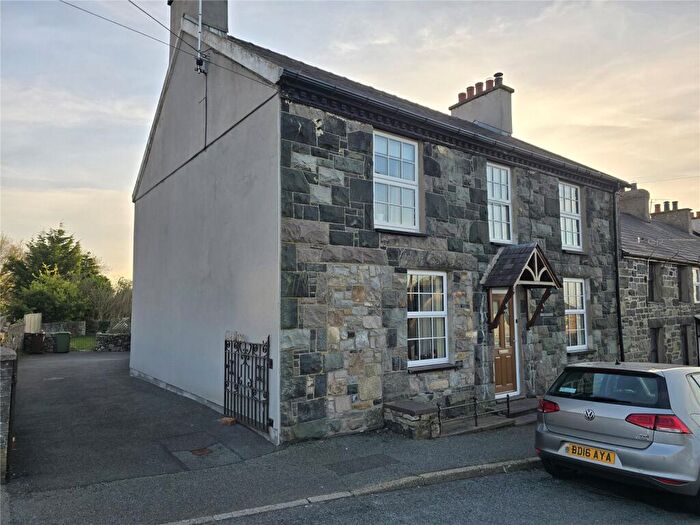
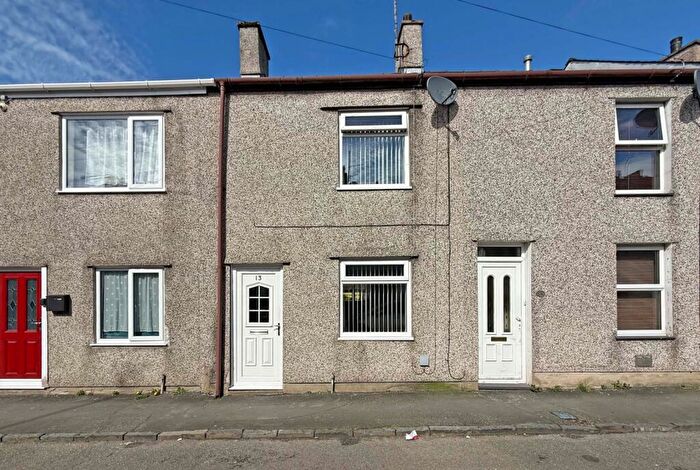
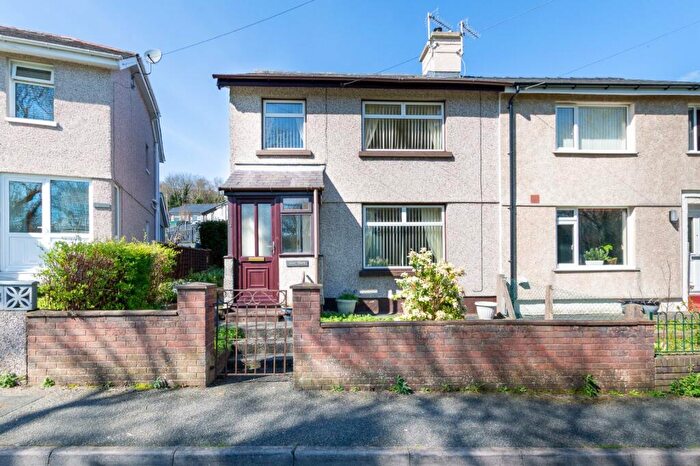
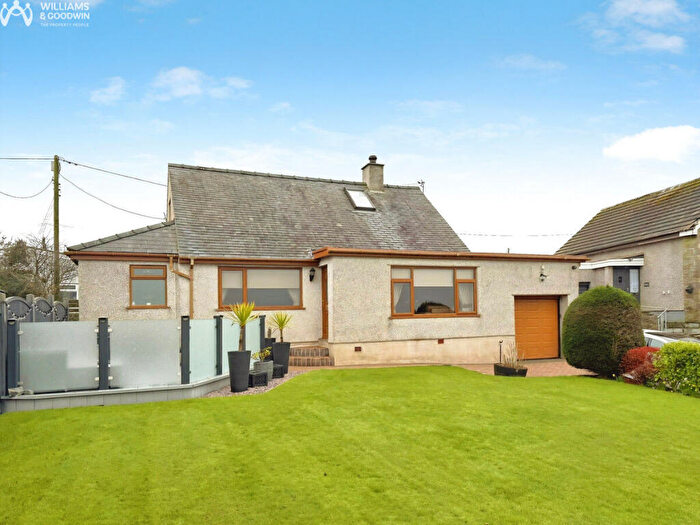
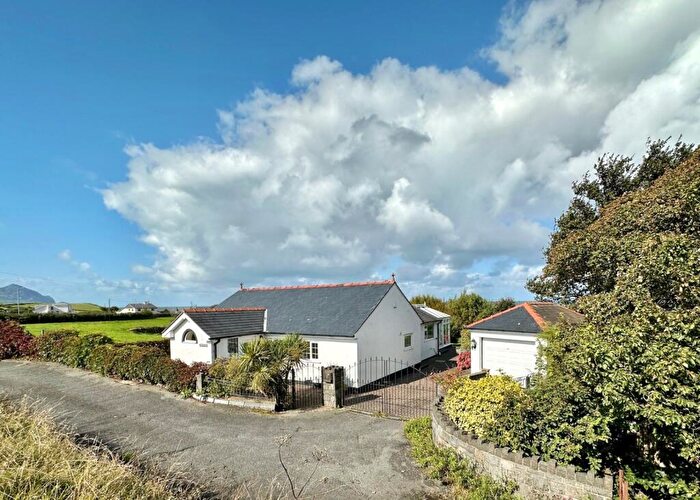
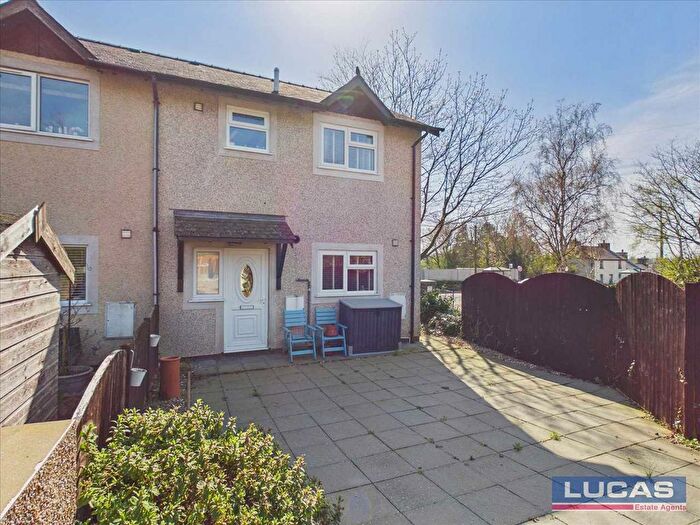
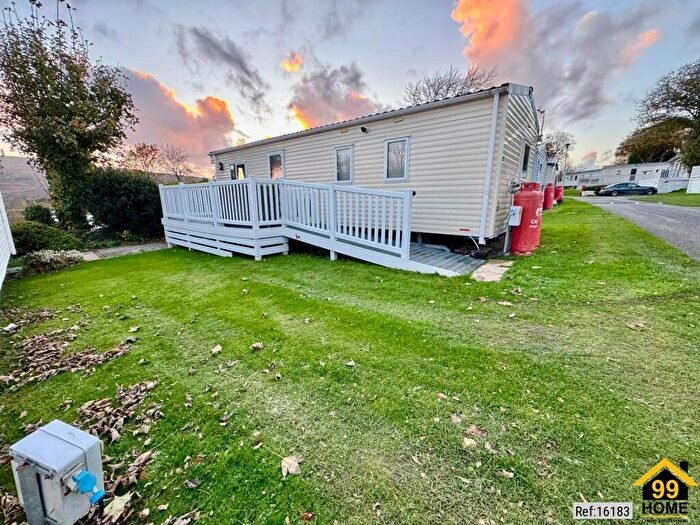
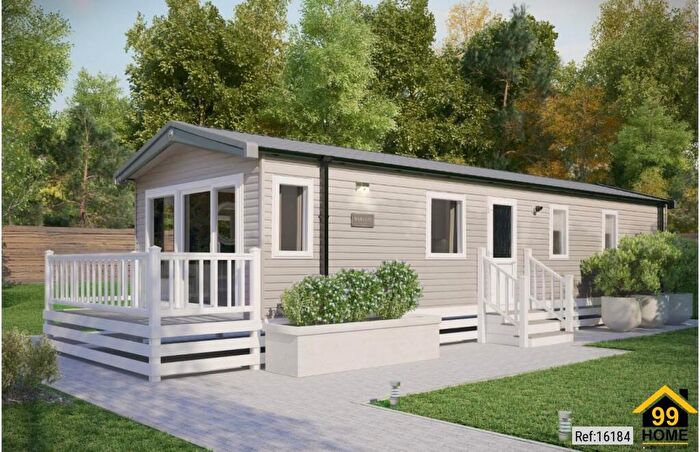
Properties for sale in Caernarfon
![]()
If you are looking to sell your house, let it out, or receive a property valuation, an expert can help you.
Click the button below to get started.
Neighbourhoods in Caernarfon
Navigate through our locations to find the location of your next house in Caernarfon, Gwynedd - Gwynedd for sale or to rent.
Transport in Caernarfon
Please see below transportation links in this area:
-
 Llanfairpwll Station
 -
Bangor (Gwynedd) Station
-
Bodorgan Station
-
Porthmadog Station
-
Criccieth Station
-
Ty Croes Station
-
Minffordd Station
-
Roman Bridge Station
-
Penrhyndeudraeth Station
-
Rhosneigr Station
- FAQ
- Price Paid By Year
- Property Type Price
Frequently asked questions about Caernarfon
What is the average price for a property for sale in Caernarfon?
The average price for a property for sale in Caernarfon is £206,550. This amount is 8% lower than the average price in Gwynedd - Gwynedd. There are 7,599 property listings for sale in Caernarfon.
What locations have the most expensive properties for sale in Caernarfon?
The locations with the most expensive properties for sale in Caernarfon are Porthmadog-tremadog at an average of £263,700, Penisarwaun at an average of £262,073 and Clynnog at an average of £250,202.
What locations have the most affordable properties for sale in Caernarfon?
The locations with the most affordable properties for sale in Caernarfon are Penygroes at an average of £141,679, Talysarn at an average of £150,208 and Llanllyfni at an average of £161,333.
Which train stations are available in or near Caernarfon?
Some of the train stations available in or near Caernarfon are Llanfairpwll, Bangor (Gwynedd) and Bodorgan.
Property Price Paid in Caernarfon by Year
The average sold property price by year was:
| Year | Average Sold Price | Price Change |
Sold Properties
|
|---|---|---|---|
| 2026 | £203,316 | -3% |
3 Properties |
| 2025 | £210,149 | 1% |
331 Properties |
| 2024 | £208,907 | 4% |
391 Properties |
| 2023 | £200,455 | -9% |
345 Properties |
| 2022 | £217,758 | 16% |
463 Properties |
| 2021 | £183,241 | 7% |
504 Properties |
| 2020 | £171,320 | -2% |
385 Properties |
| 2019 | £174,404 | 6% |
471 Properties |
| 2018 | £163,466 | 1% |
467 Properties |
| 2017 | £161,216 | 5% |
414 Properties |
| 2016 | £152,724 | 2% |
391 Properties |
| 2015 | £149,899 | 11% |
410 Properties |
| 2014 | £133,842 | -6% |
405 Properties |
| 2013 | £141,436 | 6% |
347 Properties |
| 2012 | £133,343 | -4% |
294 Properties |
| 2011 | £139,116 | -3% |
353 Properties |
| 2010 | £143,782 | 3% |
342 Properties |
| 2009 | £139,730 | -14% |
314 Properties |
| 2008 | £159,702 | 5% |
246 Properties |
| 2007 | £151,380 | 3% |
470 Properties |
| 2006 | £146,711 | 10% |
464 Properties |
| 2005 | £132,454 | 15% |
436 Properties |
| 2004 | £112,435 | 16% |
454 Properties |
| 2003 | £94,681 | 30% |
567 Properties |
| 2002 | £66,745 | 11% |
641 Properties |
| 2001 | £59,618 | 12% |
633 Properties |
| 2000 | £52,728 | 7% |
570 Properties |
| 1999 | £49,190 | 4% |
467 Properties |
| 1998 | £47,462 | 5% |
505 Properties |
| 1997 | £45,209 | 3% |
455 Properties |
| 1996 | £44,046 | -1% |
384 Properties |
| 1995 | £44,367 | - |
307 Properties |
Property Price per Property Type in Caernarfon
Here you can find historic sold price data in order to help with your property search.
The average Property Paid Price for specific property types in the last three years are:
| Property Type | Average Sold Price | Sold Properties |
|---|---|---|
| Semi Detached House | £204,902.00 | 250 Semi Detached Houses |
| Terraced House | £148,525.00 | 496 Terraced Houses |
| Detached House | £310,511.00 | 303 Detached Houses |
| Flat | £96,640.00 | 21 Flats |