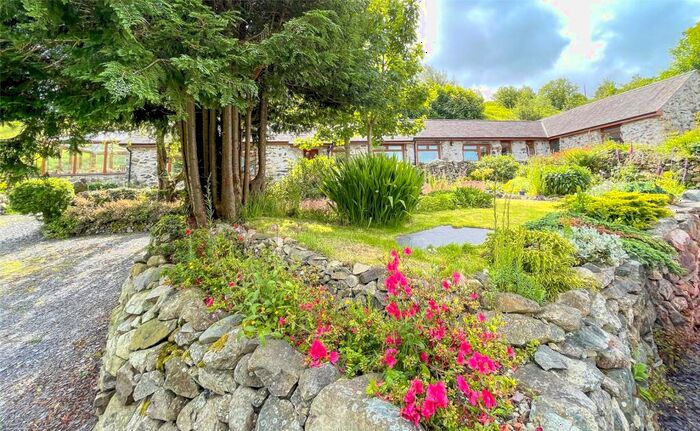
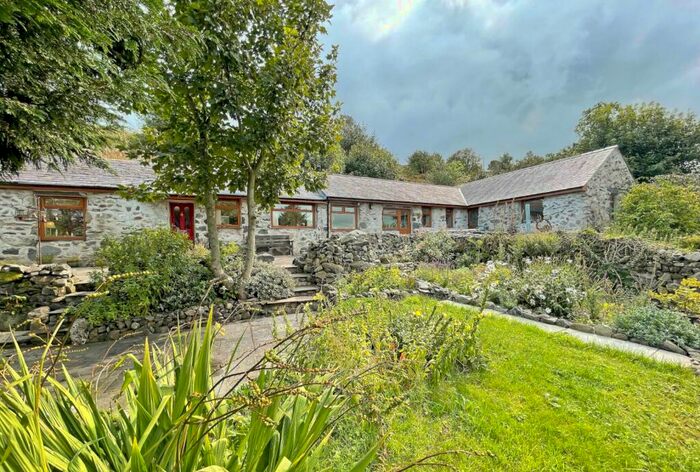
Houses for sale & to rent in Cwm-y-glo, Caernarfon
House Prices in Cwm-y-glo
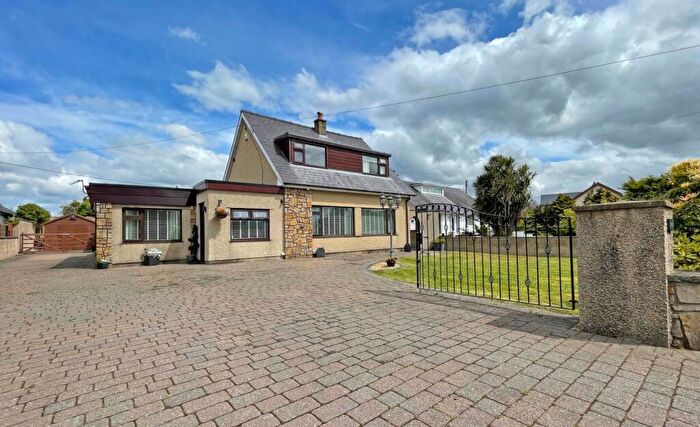
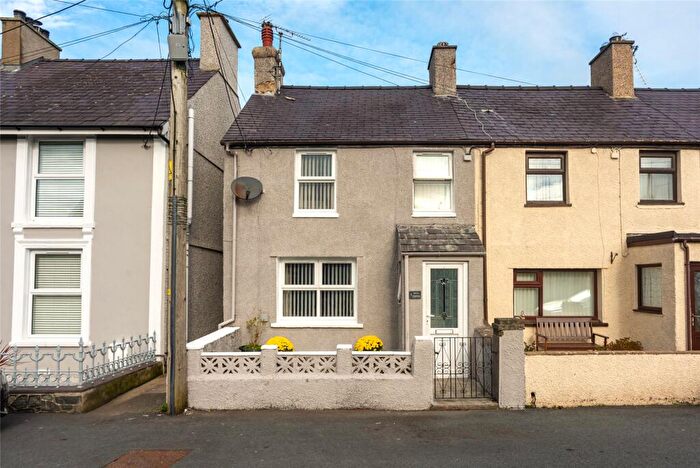
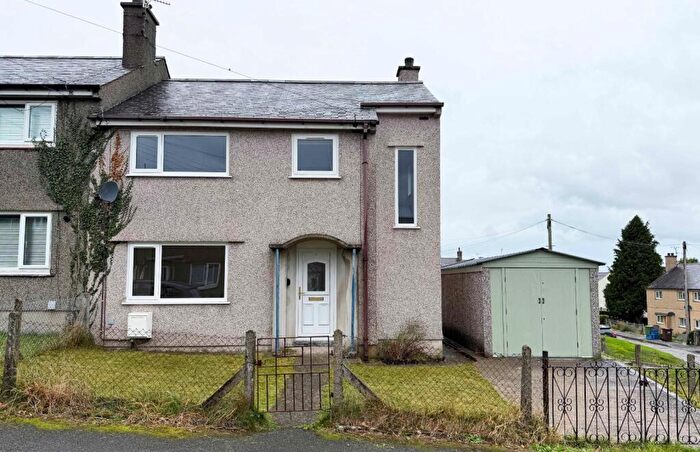
Properties in Cwm-y-glo have an average house price of £207,189.00 and had 32 Property Transactions within the last 3 years¹.
Cwm-y-glo is an area in Caernarfon, Gwynedd - Gwynedd with 403 households², where the most expensive property was sold for £442,000.00.
Properties for sale in Cwm-y-glo
Roads and Postcodes in Cwm-y-glo
Navigate through our locations to find the location of your next house in Cwm-y-glo, Caernarfon for sale or to rent.
| Streets | Postcodes |
|---|---|
| Allt Goch | LL55 4DW |
| Bron Seiont | LL55 1UD |
| Bryn Crwn | LL55 4DN |
| Bryn Hyfryd Terrace | LL55 4DU |
| Bryngwyn Terrace | LL55 4RH |
| Cae Ty Capel | LL55 4FB |
| Dolafon | LL55 4DB |
| Fron Heulog | LL55 4DD |
| Fron Oleu | LL55 4RT |
| Glyndwr Terrace | LL55 4DS |
| Min Y Parc | LL55 4RN |
| Minffrwd Terrace | LL55 4RR |
| New Street | LL55 4DE |
| Pant Castell | LL55 4RJ |
| Pant Y Coed | LL55 4RW |
| Plas Pantafon | LL55 4RA |
| Pool Street | LL55 4DR |
| Rhes Tan Marian | LL55 4FD |
| Tan Y Bryn | LL55 4DG |
| Tan Y Coed Terrace | LL55 4RL |
| Trefor Terrace | LL55 4RS |
| LL55 2AQ LL55 2BB LL55 2SL LL55 2SN LL55 2SP LL55 2SR LL55 2SW LL55 2TN LL55 4DF LL55 4DH LL55 4DL LL55 4DP LL55 4DT LL55 4DY LL55 4EA LL55 4ED LL55 4PY LL55 4RB LL55 4RF LL55 4RG LL55 4RP LL55 4RU LL55 4RY LL55 4SA LL55 2BP LL55 4DA LL55 4EB LL55 4HJ LL55 4HX LL55 4RE |
Transport near Cwm-y-glo
-
Llanfairpwll Station
-
Bangor (Gwynedd) Station
-
Bodorgan Station
-
Llanfairfechan Station
-
Roman Bridge Station
-
Ty Croes Station
-
Dolwyddelan Station
-
Penmaenmawr Station
-
Blaenau Ffestiniog Station
-
Pont-y-Pant Station
- FAQ
- Price Paid By Year
- Property Type Price
Frequently asked questions about Cwm-y-glo
What is the average price for a property for sale in Cwm-y-glo?
The average price for a property for sale in Cwm-y-glo is £207,189. This amount is 0.45% higher than the average price in Caernarfon. There are 454 property listings for sale in Cwm-y-glo.
What streets have the most expensive properties for sale in Cwm-y-glo?
The streets with the most expensive properties for sale in Cwm-y-glo are Bryngwyn Terrace at an average of £227,830, Minffrwd Terrace at an average of £210,000 and Bryn Hyfryd Terrace at an average of £197,000.
What streets have the most affordable properties for sale in Cwm-y-glo?
The streets with the most affordable properties for sale in Cwm-y-glo are Fron Heulog at an average of £120,000, New Street at an average of £164,416 and Allt Goch at an average of £193,750.
Which train stations are available in or near Cwm-y-glo?
Some of the train stations available in or near Cwm-y-glo are Llanfairpwll, Bangor (Gwynedd) and Bodorgan.
Property Price Paid in Cwm-y-glo by Year
The average sold property price by year was:
| Year | Average Sold Price | Price Change |
Sold Properties
|
|---|---|---|---|
| 2025 | £214,071 | 8% |
8 Properties |
| 2024 | £197,041 | -8% |
12 Properties |
| 2023 | £212,750 | -27% |
12 Properties |
| 2022 | £270,150 | 18% |
10 Properties |
| 2021 | £221,760 | 24% |
19 Properties |
| 2020 | £168,250 | -16% |
8 Properties |
| 2019 | £194,600 | 21% |
10 Properties |
| 2018 | £154,500 | -22% |
20 Properties |
| 2017 | £187,765 | 20% |
13 Properties |
| 2016 | £149,542 | -3% |
20 Properties |
| 2015 | £153,678 | 23% |
14 Properties |
| 2014 | £117,888 | -35% |
9 Properties |
| 2013 | £159,466 | 14% |
9 Properties |
| 2012 | £137,525 | 22% |
8 Properties |
| 2011 | £106,625 | -41% |
8 Properties |
| 2010 | £150,576 | 31% |
13 Properties |
| 2009 | £104,000 | -65% |
4 Properties |
| 2008 | £171,250 | 19% |
8 Properties |
| 2007 | £137,903 | -4% |
16 Properties |
| 2006 | £142,938 | -25% |
17 Properties |
| 2005 | £179,100 | 48% |
5 Properties |
| 2004 | £92,617 | -64% |
12 Properties |
| 2003 | £151,790 | 66% |
18 Properties |
| 2002 | £51,297 | 10% |
19 Properties |
| 2001 | £46,225 | -17% |
14 Properties |
| 2000 | £54,146 | -8% |
16 Properties |
| 1999 | £58,377 | 6% |
13 Properties |
| 1998 | £54,645 | 10% |
20 Properties |
| 1997 | £49,203 | 31% |
14 Properties |
| 1996 | £33,833 | 2% |
15 Properties |
| 1995 | £33,081 | - |
11 Properties |
Property Price per Property Type in Cwm-y-glo
Here you can find historic sold price data in order to help with your property search.
The average Property Paid Price for specific property types in the last three years are:
| Property Type | Average Sold Price | Sold Properties |
|---|---|---|
| Semi Detached House | £196,800.00 | 5 Semi Detached Houses |
| Detached House | £288,708.00 | 12 Detached Houses |
| Terraced House | £145,438.00 | 15 Terraced Houses |

